Futures Trading Levels and Economic Reports for September 4, 2013

Connect with Us! Use Our Futures Trading Levels and Economic Reports RSS Feed.

Like us on FacebookFollow us on TwitterView our profile on LinkedInFind us on Google+Cannon Trading Futures Trading Resistance & Support Levels and Economic ReportsFind us on Yelp

1. Market Commentary
2. Futures Support and Resistance Levels – S&P, Nasdaq, Dow Jones, Russell 2000, Dollar Index
3. Commodities Support and Resistance Levels – Gold, Euro, Crude Oil, T-Bonds
4. Commodities Support and Resistance Levels – Corn, Wheat, Beans, Silver
5. Futures Economic Reports for Wednesday September 4, 2013

Hello Traders,

For 2013 I would like to wish all of you discipline and patience in your trading! 


Markets are quite sensitive to news breaks, especially with the Syria situation.


I think the following holds true EVERY day and every trade but even more so when the markets are tense like they are with the Syria situation right now:


When you think you are are about to get into a trade, take a few extra seconds to answer yourself the following:

Where will I place a stop?

Do I have a first target profit?

If I get my first profit target, what do I do with the remaining of the trade?  Do I use a trailing stop?

Do I have a final target?

What is the trade size I will use?


I know that sometimes you have to trade with the flow and make decisions on the fly but the more often you will think these steps out and plan your trade, the better chances you have to follow your plan and stay disciplined.


In between a daily chart of the mini NASDAQ 100 for your review as I feel the NASDAQ 100 is the leader of the indices recently.


Many have asked me for the meaning of the diamonds, arrows, plus signs etc.

It is actually part of a trading methodology I came up with and plan to have a series of webinars in the next few weeks where I review my indicators, money mgmt concept and more but to give a brief explanation:


Red Diamond is possible sell if we can take out previous bar low.

Blue diamond= possible buy if we can takeout previous bar high.

Same applies for Blue/ red triangles AS LONG as we get what I call price confirmation.


The lines are either FIBONACCI retracement or extension. More details will be explained in the first webinar which will be next Wednesday and an invite will follow this Friday.
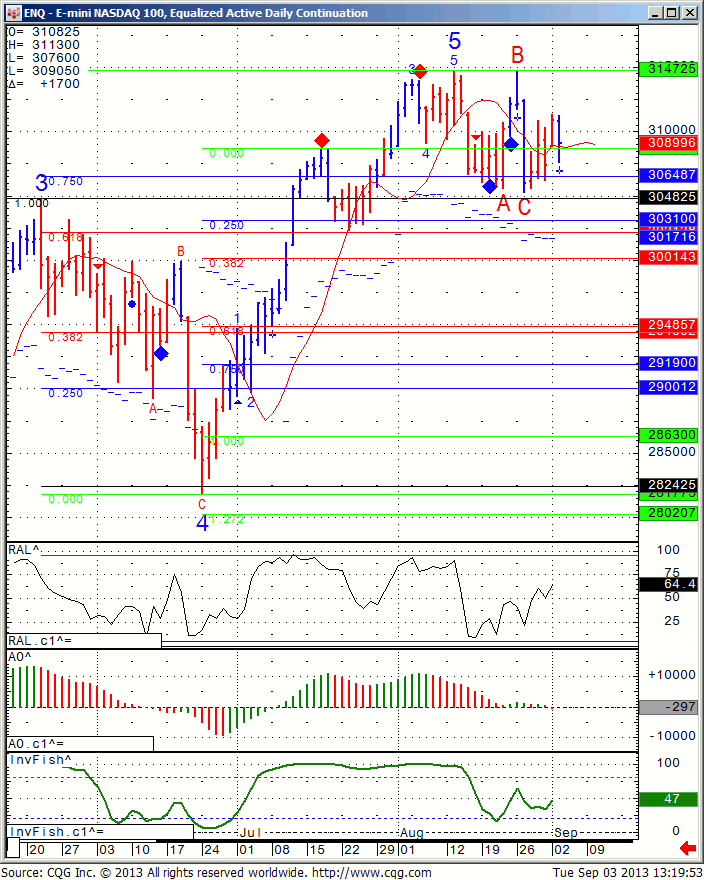
mini NASDAQ daily chart


You like the information we share? We would appreciate your positive reviews on Google+ , Facebook, Yelp etc…use the icons below to share, recommend, review us and more!

Like us on FacebookFollow us on TwitterView our profile on LinkedInFind us on Google+Cannon Trading Futures Trading Resistance & Support Levels and Economic ReportsFind us on Yelp

Futures Trading Levels and Economic Reports for August 30, 2013

Connect with Us! Use Our Futures Trading Levels and Economic Reports RSS Feed.

Like us on FacebookFollow us on TwitterView our profile on LinkedInFind us on Google+Cannon Trading Futures Trading Resistance & Support Levels and Economic ReportsFind us on Yelp

1. Market Commentary
2. Futures Support and Resistance Levels – S&P, Nasdaq, Dow Jones, Russell 2000, Dollar Index
3. Commodities Support and Resistance Levels – Gold, Euro, Crude Oil, T-Bonds
4. Commodities Support and Resistance Levels – Corn, Wheat, Beans, Silver
5. Futures Economic Reports for Friday August 30, 2013

Hello Traders,

For 2013 I would like to wish all of you discipline and patience in your trading! 


We will observe modified trading hours for Labor Day. Make sure to check the times and contact your broker if you have any questions.  Please scroll down to the previous blog below to see the schedule.  Thank you!


You like the information we share? We would appreciate your positive reviews on Google+ , Facebook, Yelp etc…use the icons below to share, recommend, review us and more!

Like us on FacebookFollow us on TwitterView our profile on LinkedInFind us on Google+Cannon Trading Futures Trading Resistance & Support Levels and Economic ReportsFind us on Yelp

Futures Trading Levels and Economic Reports for August 29, 2013

Connect with Us! Use Our Futures Trading Levels and Economic Reports RSS Feed.

Like us on FacebookFollow us on TwitterView our profile on LinkedInFind us on Google+Cannon Trading Futures Trading Resistance & Support Levels and Economic ReportsFind us on Yelp

1. Market Commentary
2. Futures Support and Resistance Levels – S&P, Nasdaq, Dow Jones, Russell 2000, Dollar Index
3. Commodities Support and Resistance Levels – Gold, Euro, Crude Oil, T-Bonds
4. Commodities Support and Resistance Levels – Corn, Wheat, Beans, Silver
5. Futures Economic Reports for Thursday August 29, 2013

Hello Traders,

For 2013 I would like to wish all of you discipline and patience in your trading! 


The mental part of trading is so hard….


Today for example I had excellent signals on the crude oil yet barely managed to scratch…


It started with me trying to trade while doing other things (not a good idea…)

Then I would miss a good trade and get anxious to jump in even though the signal was done with…also not a good thing.


Once I did get in, since my psyche was already off, I did not have the patience to stay in the trade and let my stops and targets work, so I would get out. Sure enough seconds after I get out, the market goes my way and drives me crazy…not a good thing again….Luckily the signals were good enough otherwise this could have been a bad day.


The points I am trying to make today?

Make sure you are focused and not distracted.

If you sense that you are not in the right frame of mind, take a small break.

Plan your trade and then have patience to trade your plan.

I highly recommend using daily stops and profit targets. Set a profit target for the day and when achieved take your profit and walk away. Set a daily loss limit, i.e the most you are willing to risk on any given day. When that happens, walk away. Might be a losing day but if you stop it can not turn into a TERRIBLE day….


I wrote a full article about my day trading money management approach for SFO magazine few years back. If you like a copy, please email me and I will send you the PDF.


If you are a client, simply include your account number.

If you are a prospect, please answer the following:


1. Have you traded futures before?

2. What markets interest you at this time?

3. Are you planning to daytrade, longer term trades? options/futures?

4. What is the amount of capital you are planning to open an account with or working with currently?

5. Have you taken a course or been mentored by anyone?

6. Do you currently have your own charts that you are using?


You like the information we share? We would appreciate your positive reviews on Google+ , Facebook, Yelp etc…use the icons below to share, recommend, review us and more!

Like us on FacebookFollow us on TwitterView our profile on LinkedInFind us on Google+Cannon Trading Futures Trading Resistance & Support Levels and Economic ReportsFind us on Yelp

Futures Trading Levels and Economic Reports for August 27, 2013

Connect with Us! Use Our Futures Trading Levels and Economic Reports RSS Feed.

Like us on FacebookFollow us on TwitterView our profile on LinkedInFind us on Google+Cannon Trading Futures Trading Resistance & Support Levels and Economic ReportsFind us on Yelp

1. Market Commentary
2. Futures Support and Resistance Levels – S&P, Nasdaq, Dow Jones, Russell 2000, Dollar Index
3. Commodities Support and Resistance Levels – Gold, Euro, Crude Oil, T-Bonds
4. Commodities Support and Resistance Levels – Corn, Wheat, Beans, Silver
5. Futures Economic Reports for Tuesday August 27, 2013

Hello Traders,

For 2013 I would like to wish all of you discipline and patience in your trading! 


Situation in Syria is heating up and over the next few days/ weeks you may see some erratic moves in markets like SP 500 ( and other indices), gold, crude oil, bonds and others.
I personally always like to use stops and actually have my software checked with auto bracket each time I enter a daytrade. I like to have a stop entered right away and then be able to adjust according to the charts. Moves like we saw today ( see mini SP chart below) can happen frequently in times of Geo-political uncertainty. The SP500 dropped over 13 points in matter of 11 minutes. I actually seen much bigger and faster moves happen before but my main point here is that I recommend using stops and placing stop orders rather than using “mental stop”.
If you need help on how to set up the auto bracket on either E-futures Int’l orTransactAT, feel free to email me and I will be happy to assist.
7 tick range bar chart, mini S&P


You like the information we share? We would appreciate your positive reviews on Google+ , Facebook, Yelp etc…use the icons below to share, recommend, review us and more!

Like us on FacebookFollow us on TwitterView our profile on LinkedInFind us on Google+Cannon Trading Futures Trading Resistance & Support Levels and Economic ReportsFind us on Yelp

Futures Trading Levels and Economic Reports for August 23, 2013

Connect with Us! Use Our Futures Trading Levels and Economic Reports RSS Feed.

Like us on FacebookFollow us on TwitterView our profile on LinkedInFind us on Google+Cannon Trading Futures Trading Resistance & Support Levels and Economic ReportsFind us on Yelp

1. Market Commentary
2. Futures Support and Resistance Levels – S&P, Nasdaq, Dow Jones, Russell 2000, Dollar Index
3. Commodities Support and Resistance Levels – Gold, Euro, Crude Oil, T-Bonds
4. Commodities Support and Resistance Levels – Corn, Wheat, Beans, Silver
5. Futures Economic Reports for Friday August 23, 2013

Hello Traders,

For 2013 I would like to wish all of you discipline and patience in your trading! 


Another big day in stock index futures. Push lower overnight and then a powerful rally the rest of the day session.


The big question of course is….is this a short covering rally or the start of another leg up?


No one has the answer but we can all speculate on different scenarios. Looking at both the SP500 ( mini) and the NASDAQ 100 ( mini ) charts below, I think the following need to happen in order for the markets to have continued momentum to the upside: Nasdaq has to break above 3115 and mini sp needs to break 1657.75 followed by 1562 . Even then the question is does one think these markets can make new highs or not?


Either way price action was bullish today, we took out yesterdays low and closed above yesterday’s high. I think it’s called outside day reversal but don’t quote me on that….


NASDAQ 100 is the stronger sector leading the way so far.


On the downside, I want to see SP 500 “entering the cloud” below 1640 and the NASDAQ going below 3064.


Lots of technical chatter today and bottom line is the way price action will be tomorrow..Hence futures trading (-:


Charts for your review below:


mini nasdaq 100 daily


You like the information we share? We would appreciate your positive reviews on Google+ , Facebook, Yelp etc…use the icons below to share, recommend, review us and more!

Like us on FacebookFollow us on TwitterView our profile on LinkedInFind us on Google+Cannon Trading Futures Trading Resistance & Support Levels and Economic ReportsFind us on Yelp

Futures Trading Levels and Economic Reports for August 22, 2013

Connect with Us! Use Our Futures Trading Levels and Economic Reports RSS Feed.

Like us on FacebookFollow us on TwitterView our profile on LinkedInFind us on Google+Cannon Trading Futures Trading Resistance & Support Levels and Economic ReportsFind us on Yelp

1. Market Commentary
2. Futures Support and Resistance Levels – S&P, Nasdaq, Dow Jones, Russell 2000, Dollar Index
3. Commodities Support and Resistance Levels – Gold, Euro, Crude Oil, T-Bonds
4. Commodities Support and Resistance Levels – Corn, Wheat, Beans, Silver
5. Futures Economic Reports for Thursday August 22, 2013

Hello Traders,

For 2013 I would like to wish all of you discipline and patience in your trading! 

FOMC minutes came out and was actually better than advertised….This is the first time in a while where I felt we saw legitimate , free market action. The market had volatility, wide ranges and moved both ways on one of the better trading volumes in weeks.


Don’t get me wrong, I am not saying that every trading day should like this but we have witnessed over the past 3-4 years been a market guided by QE where traders and large institutions were just looking to buy the dips. I am sure that this will not be over in one day and it is a process but I have a feeling that this is a start of going back to “normal”, free market conditions. “normal”, free markets can and will have strong corrections and moves both up and down.


What does it mean to you the day-trader? Look back at intraday charts from 2007- 2009 and you will get an idea.


In between I am sharing a small  piece from a booklet I wrote where I outline some of my day-trading theories and techniques.


My opinion is that there are 3 main types of trading days.


    1. Most common is two sided trading action with swings up and down – this type of trading day is most suitable for the main aspect of this model, which is taking trades based on the arrows.
    2. Strong trending day, mostly one directional – this type of trading day is the least common, many times this will happen on Mondays and maybe 3-5 times a month at most – this type of trading day is most suitable for using the color scheme I have on the charts. Green bars mean strong up trend, red bars mean strong down trend. If you determined that this is a trend day, then use pull backs to enter with the direction of trend and use the parabolic (little dashes) as you trailing stop.
    3. Slow and/ or choppy trading day – this type of trading day is best suited for taking small profits from the market by either using the main model or taking the diamonds as entry signal, and going for quick profits and tight stops.


Assessing the Type of Trading Day

  • A good question is how can one assess what type of trading day we will have while the market is still trading? I am doing some work about it and will be happy to hear feedback via email, but here are some initial observations:


1)    Was the overnight session a wide, two sided trading range? If the answer is yes, good chances are for a similar trading day during the primary session (primary session is when the cash/ stock market is open).

2)    Mondays have the highest chance for trending days.

3)    The behavior of the first hour of trading can also suggests the type of action for the rest of the day.

4)    If the first 30 minutes have good volume, better chances for type 1 or type 2 trading days.

5)    Low volume during the first 30 minutes can suggest a choppy (type 3 trading day).

6)    Is there a big report today? monthly employment situation? FOMC statement? The major reports can create volatility in the market, so be aware of what reports are scheduled.


You like the information we share? We would appreciate your positive reviews on Google+ , Facebook, Yelp etc…use the icons below to share, recommend, review us and more!

Like us on FacebookFollow us on TwitterView our profile on LinkedInFind us on Google+Cannon Trading Futures Trading Resistance & Support Levels and Economic ReportsFind us on Yelp

Futures Trading Levels and Economic Reports for August 21, 2013

Connect with Us! Use Our Futures Trading Levels and Economic Reports RSS Feed.

Like us on FacebookFollow us on TwitterView our profile on LinkedInFind us on Google+Cannon Trading Futures Trading Resistance & Support Levels and Economic ReportsFind us on Yelp

1. Market Commentary
2. Futures Support and Resistance Levels – S&P, Nasdaq, Dow Jones, Russell 2000, Dollar Index
3. Commodities Support and Resistance Levels – Gold, Euro, Crude Oil, T-Bonds
4. Commodities Support and Resistance Levels – Corn, Wheat, Beans, Silver
5. Futures Economic Reports for Wednesday August 21, 2013

Hello Traders,

For 2013 I would like to wish all of you discipline and patience in your trading! 


FOMC minutes tomorrow should bring some additional volatility to the markets and in my opinion will either confirm another leg down or not.


In between, a little tip that I find useful and wanted to share with you:


It is a known fact that fear and greed can be one of your worst enemies.


One way I found that helped some clients to deal with the fear and greed and its related cousin, “getting out of winners too soon and staying in losers too long…” is entering multiple contracts when getting into a day-trade.


Obviously, one has to have the appropriate risk capital, margin requirements to do so but the advantage of trading more than one “unit” or splitting your trading size into two or more parts is as such:


If you enter a trade with one contract ( or if you are treating your trading size as one unit, meaning you enter a trade with 4 contracts and exit the trade with 4 contracts, that is considered treating your trading size as one unit), you can face a very quick dilemma, especially when day-trading. You get in and very quickly you are up 2 mini SP points….what do you do? Do you take profit? Bring your stop loss closer? How do you avoid getting out too early or too late?

On the flip side, you enter a trade and it goes against rather quickly…if you get out then it is a loser and what if the market goes back up says the little devil voice in our head….

In the good case scenario when market decided to be nice to us and is moving in our direction, what I like to do it is exit half of my position relatively quick. In the case of the mini SP , around 7 ticks profit. What I found out is that will allow me to manage the rest of the trade in a much more relaxed manner since I already “locked profits in” I can now look for a proper stop, close to my breakeven level. I can analyze my next target more realistically and hopefully if the market provides room for additional gains, be in there to participate.

The same can be applied to the stop loss part. I can choose to risk a smaller amount or a tight stop on the first half of my position and a bit wider stop on the other half of the position. That can help prevent the scenario when one does not get out of a trade because mentally he or she does not want to accept the loss….


Off course there is much more to trading and day-trading. Entry signals, exit techniques, why and when to get in a trade are key but I hope that this little tip will assist you while trading and will prevent some of the instances where you get out too late or too early…..


You like the information we share? We would appreciate your positive reviews on Google+ , Facebook, Yelp etc…use the icons below to share, recommend, review us and more!

Like us on FacebookFollow us on TwitterView our profile on LinkedInFind us on Google+Cannon Trading Futures Trading Resistance & Support Levels and Economic ReportsFind us on Yelp

Futures Trading Levels and Economic Reports for August 16, 2013

Connect with Us! Use Our Futures Trading Levels and Economic Reports RSS Feed.

Like us on FacebookFollow us on TwitterView our profile on LinkedInFind us on Google+Cannon Trading Futures Trading Resistance & Support Levels and Economic ReportsFind us on Yelp

1. Market Commentary
2. Futures Support and Resistance Levels – S&P, Nasdaq, Dow Jones, Russell 2000, Dollar Index
3. Commodities Support and Resistance Levels – Gold, Euro, Crude Oil, T-Bonds
4. Commodities Support and Resistance Levels – Corn, Wheat, Beans, Silver
5. Futures Economic Reports for Friday August 16, 2013

Hello Traders,

For 2013 I would like to wish all of you discipline and patience in your trading! 

You like the information we share? We would appreciate your positive reviews on Google+ , Facebook, Yelp etc…use the icons below to share, recommend, review us and more!

Continue reading “Futures Trading Levels and Economic Reports for August 16, 2013”

Futures Trading Levels and Economic Reports for August 15, 2013

Connect with Us! Use Our Futures Trading Levels and Economic Reports RSS Feed.

Like us on FacebookFollow us on TwitterView our profile on LinkedInFind us on Google+Cannon Trading Futures Trading Resistance & Support Levels and Economic ReportsFind us on Yelp

1. Market Commentary
2. Futures Support and Resistance Levels – S&P, Nasdaq, Dow Jones, Russell 2000, Dollar Index
3. Commodities Support and Resistance Levels – Gold, Euro, Crude Oil, T-Bonds
4. Commodities Support and Resistance Levels – Corn, Wheat, Beans, Silver
5. Futures Economic Reports for Thursday August 15, 2013

Hello Traders,

For 2013 I would like to wish all of you discipline and patience in your trading! 

I will try to share once in a while some “swing trade set ups” I share with my broker assist clients in hopes of showing different angle to trading and other trading types than day-trading.

Today is a set up in the Euro currency market.

Based on research I have done with the most active futures markets, I have applied 2 of the most successful of my 5 ALGOS to each specific market based on the past behavior ( past performance is not indicative of future results). As you can see from the chart, the two algos I use for the euro are marked with triangles and + sign.

I then use experience and knowledge I have accumulated over the years to determine stops and exits.

In this case I got a sell signal to go short the euro. For me personally signals need what I call price confirmation, so in this case I would go short the Euro at 132.33 on a stop. So unless price action takes out what I consider support level, i will not be short.

If and once I am in the market, I will use 131.51 as my initial target and 133.61 as my initial stop.

Chart for your review below. Any questions, please let me know and I will be happy to assist.

Continue reading “Futures Trading Levels and Economic Reports for August 15, 2013”

Futures Trading Levels and Economic Reports for August 14, 2013

Connect with Us! Use Our Futures Trading Levels and Economic Reports RSS Feed.

Like us on FacebookFollow us on TwitterView our profile on LinkedInFind us on Google+Cannon Trading Futures Trading Resistance & Support Levels and Economic ReportsFind us on Yelp

1. Market Commentary
2. Futures Support and Resistance Levels – S&P, Nasdaq, Dow Jones, Russell 2000, Dollar Index
3. Commodities Support and Resistance Levels – Gold, Euro, Crude Oil, T-Bonds
4. Commodities Support and Resistance Levels – Corn, Wheat, Beans, Silver
5. Futures Economic Reports for Wednesday August 14, 2013

Hello Traders,

For 2013 I would like to wish all of you discipline and patience in your trading! 

I am being asked often “how do you set up your charts?”  or “how do you make trading decisions?”

The answer will often vary based on the client I am assisting, if it is a managed account or not, the time frame and more.

However, when it comes to day-trading, I really like using range bars and renko charts. To me I find the visual smoother and more helpful for any time frame of less than 30 minutes.

I like to keep my day trading chart simple.

I include in it the following:

My diamond ALGO
Hull Moving Average
my custom indicator REL ( somewhat similar to RSI)
open/high/low
Market profile value areas and other support and resistance levels

When I assist clients in trading I like to trade in multiple of twos. Take profit on first target with half position and let the other half ride for the few times that we get a “runner”, a big winner.

The two charts below are good examples of what I wrote above. It is from today’s session and you can see the described tools in the charts.

Obviously one needs to manage positions once in a trade, which is sometimes much hardwer than the entry and I have some tips on that subject as well.

I will be more than happy to share more with you if interested. Please see instructions below the charts.


Crude Oil 18 Tick Range Bar Chart


Mini S&P 7 Ticks Range Bar Chart


Would you like to have access to my DIAMOND and TOPAZ ALGOs as shown above

and be able to apply for any market and any time frame on your own PC ?   You can now have a two weeks free trial where I enable the ALGO along with few studies for your own sierra/ ATcharts.

To start your trial, please visit:

If so, please send me an email with the following information:


1. Are you currently trading futures?

2. Charting software you use?

3. If you use sierra or ATcharts, please let me know the user name so I can enable you

4. Markets you currently trading?

Continue reading “Futures Trading Levels and Economic Reports for August 14, 2013”