Tuesday Morning Support and Resistance Numbers

If you would like these numbers before the market opens, make sure you SIGN UP with your email above.

Here’s a morning cup o’ joe for all you futures traders, our morning support and resistance levels. Good trading!

divider black 190

Support and Resistance Levels – S&P 500, Nasdaq 100, Dow Jones, Mini Russell 2000, 30-Year US Bond, 10-Year US Note

Contract (June) Mini S&P 500 Mini Nasdaq 100 Dow Jones Mini Russell 2000 30-Year US Bond 10-Year US Note
Resistance Level 3 ——————————————Resistance Level 2

——————————————

Resistance Level 1

——————————————

Support Level 1

——————————————

Support Level 2

——————————————

Support Level 3

1334.81328.75


1318.5


1312


1307.5


1299.75

26092575


2557


2532


2521


2499

1267812567


12549


12467


12438


12387

775.4768.6


764


759.8


756.7


751.2

1480014717


14709


14624


14605


14511

13319.513314.5


13312


13303.5


13223


13212

Continue reading “Tuesday Morning Support and Resistance Numbers”
Crude Oil and Stock Index Futures: Small Bounce or Short-Term Bottom?

Jump to a section in this post:

1. Market Commentary
2. Support and Resistance Levels – S&P, Nasdaq, Dow Jones, Russell 2000
3. Support and Resistance Levels – Gold, Euro, Crude Oil, T-Bonds
4. Support and Resistance Levels – Corn, Wheat, Beans, Silver
5. Economic Reports for Tuesday May 22, 2012

Hello Traders,

We started the week with nice bounce on stock indices, crude oil  and gold continue to hold.

The big question: Is this a small correction/ bounce after the strong sell off last week or is this a short term bottom?


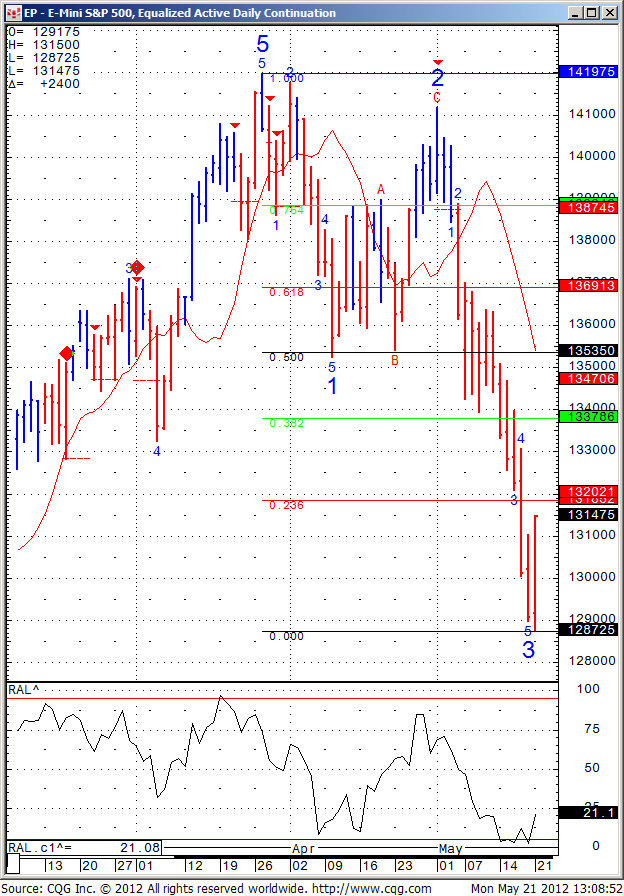
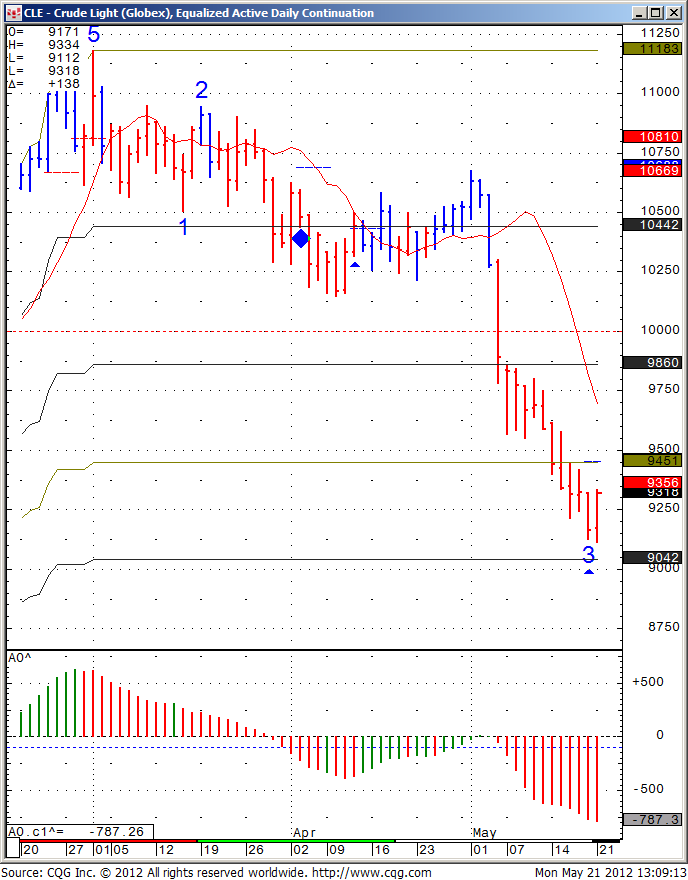
My opinion is that it is just a normal bounce after strong sell off and that there is more room on the downside but we will need to see the market reaction if we can climb up to 1320 and 1337 on the SP and  94.50 on the crude oil


Daily charts of both below for your review:


Mini SP daily Chart

mini sp daily


Crude Oil Futures Daily chart 
crude oil futures daily chart


Continue reading “Crude Oil and Stock Index Futures: Small Bounce or Short-Term Bottom?”

Monday Morning Support and Resistance Numbers


If you would like these numbers before the market opens, make sure you SIGN UP with your email above.

Here’s a morning cup o’ joe for all you futures traders, our morning support and resistance levels. Good trading!

divider black 190

Support and Resistance Levels – S&P 500, Nasdaq 100, Dow Jones, Mini Russell 2000, 30-Year US Bond, 10-Year US Note

Contract (June) Mini S&P 500 Mini Nasdaq 100 Dow Jones Mini Russell 2000 30-Year US Bond 10-Year US Note
Resistance Level 3——————————————Resistance Level 2

——————————————

Resistance Level 1

——————————————

Support Level 1

——————————————

Support Level 2

——————————————

Support Level 3

1318.51308


1304


1290.75


1281


1278

25562537


2511


2465


2444


2428

1259812529


12451


12352


12318


12248

768.6762.4


755.5


742.3


732.5


731.6

14823 (all time high)14806

14727


14714


14624


14518

13327 (all time high)13323

13320.5


13306


13226.5


13216.5

Continue reading “Monday Morning Support and Resistance Numbers”
Friday Morning Support and Resistance Numbers

If you would like these numbers before the market opens, make sure you SIGN UP with your email above.

Here’s a morning cup o’ joe for all you futures traders, our morning support and resistance levels. Good trading!

divider black 190

Support and Resistance Levels – S&P 500, Nasdaq 100, Dow Jones, Mini Russell 2000, 30-Year US Bond, 10-Year US Note

Contract (June) Mini S&P 500 Mini Nasdaq 100 Dow Jones Mini Russell 2000 30-Year US Bond 10-Year US Note
Resistance Level 3 ——————————————Resistance Level 2

——————————————

Resistance Level 1

——————————————

Support Level 1

——————————————

Support Level 2

——————————————

Support Level 3

13321323

1312.75


1303.25


1299.50


1296.00

25562544

2532


2492


2481


2463

1267212596

12512


12432


12401


12352

770.8765.1

758.8


746.8


741.3


732.5

14823 (all time high)14813

14807


14719


14708


14629

13327 (all time high)13323

13320.5


13300


13222


13213

Continue reading “Friday Morning Support and Resistance Numbers”
Markets Pick Up Volatility | Support & Resistance Levels


Jump to a section in this post:

1. Market Commentary
2. Support and Resistance Levels – S&P, Nasdaq, Dow Jones, Russell 2000
3. Support and Resistance Levels – Gold, Euro, Crude Oil, T-Bonds
4. Support and Resistance Levels – Corn, Wheat, Beans, Silver
5. Economic Reports for Friday May 18, 2012


Hello Traders,

Markets have picked up some volatility. Indices, energies, metals, grains – are all experiencing some big moves and higher volatility.

Couple of tips I want to share:

1. Higher volatility requires SMALLER trading size, since the trading bands are now going to be wider.

2. It’s ok to “miss a trade” better than a bad trade, so don’t chase the market…

3. If you are daytrading, try the following: place your entry level very close to where you were originally going to place your stop order and place your stop order higher or lower than that. Yes you will “miss ” more than a few trades but this may help increase your chances of a good trades when you get in rather than get stopped out

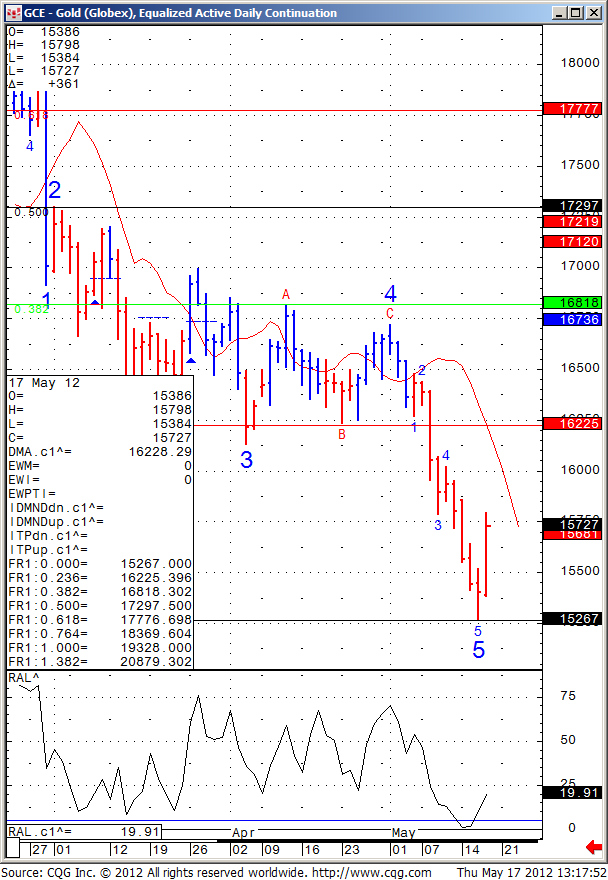
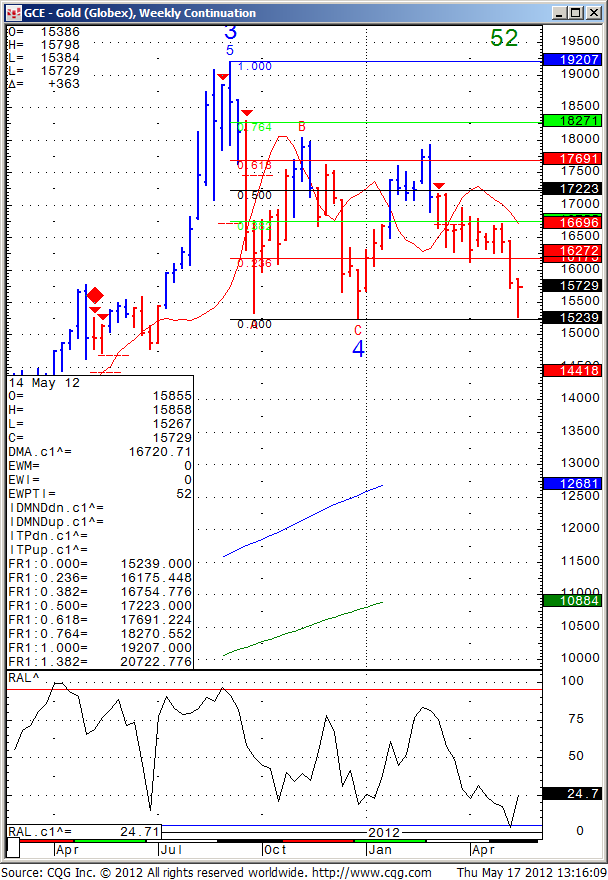
Below you will see two charts of the GOLD market. Weekly and daily. Gold has hit a strong support level and may be due for a nice bounce. I think if tomorrow we can have a strong weekly and daily close, than chances for a strong bounce are higher, on the other hand failure to finish the week with momentum may trigger another run at the lows and perhaps breaking these lows.

“Plan your trade, trade your plan!”

GOLD WEEKLY

571


GOLD DAILY

572

Continue reading “Markets Pick Up Volatility | Support & Resistance Levels”

Thursday Morning Support and Resistance Numbers

If you would like these numbers before the market opens, make sure you SIGN UP with your email above.

Here’s a morning cup o’ joe for all you futures traders, our morning support and resistance levels. Good trading!

divider black 190

Support and Resistance Levels – S&P 500, Nasdaq 100, Dow Jones, Mini Russell 2000, 30-Year US Bond, 10-Year US Note

Contract (June) Mini S&P 500 Mini Nasdaq 100 Dow Jones Mini Russell 2000 30-Year US Bond 10-Year US Note
Resistance Level 3——————————————Resistance Level 2

——————————————

Resistance Level 1

——————————————

Support Level 1

——————————————

Support Level 2

——————————————

Support Level 3

1352.51336.75


1329.5


1315.75


1308.25


1296.00

26242583


2569


2583


2563.75


2543

1281912708


12647


12533


12460


12248

780776.4


772.5


765


756.1


741.3

1472914716


14706 (all time high)

14609


14526


14431

13319.5 (all time high)13312.5 

13308


13300


13222


13213

Continue reading “Thursday Morning Support and Resistance Numbers”
Weekly Chart of the Mini NASDAQ | Support and Resistance Levels


Jump to a section in this post:
1. Market Commentary
2. Support and Resistance Levels – S&P, Nasdaq, Dow Jones, Russell 2000
3. Support and Resistance Levels – Gold, Euro, Crude Oil, T-Bonds
4. Support and Resistance Levels – Corn, Wheat, Beans, Silver
5. Economic Reports for Thursday May 17, 2012


Hello Traders,

Weekly chart of the mini NASDAQ with possible levels to watch for your review below.

Patience, discipline and ability to accept losses are some of the biggest keys for any trading, especially for day-trading.

Write your rules down, post them on the computer and make a conscious effort to follow them. I know when I follow my own rules, it helps me and sometimes the biggest battle is just staying disciplined.

Continue reading “Weekly Chart of the Mini NASDAQ | Support and Resistance Levels”

Tuesday Morning Support and Resistance Numbers

If you would like these numbers before the market opens, make sure you SIGN UP with your email above.

Here’s a morning cup o’ joe for all you futures traders, our morning support and resistance levels. Good trading!

divider black 190

Support and Resistance Levels – S&P 500, Nasdaq 100, Dow Jones, Mini Russell 2000, 30-Year US Bond, 10-Year US Note

Contract (June) Mini S&P 500 Mini Nasdaq 100 Dow Jones Mini Russell 2000 30-Year US Bond 10-Year US Note
Resistance Level 3 ——————————————Resistance Level 2

——————————————

Resistance Level 1

——————————————

Support Level 1

——————————————

Support Level 2

——————————————

Support Level 3

1362.751352


1346.75


1333.75


1329.25


1315.75

26472624


2607


2581


2575


2543

1283012791


12730


12630


12511


12476

794.9786.9


782


774.1


772.2


756

14700 (all time high)14626 

14620


14508


14416


14328

13331.513324.5


13319.5 (all time high)

13229


13225


13217.5

Continue reading “Tuesday Morning Support and Resistance Numbers”