4 Timely Lessons from the Week’s Sharpest Index Futures Decline, May Meal, Non Farm Payroll

9dc1e02e d5f7 4ff4 abf7 1df60775f196

Index Futures

index futures 2

+

Extreme Volatility

+

Non Farm Payroll Tomorrow

non farm payroll

By Mark O’Brien, Senior Broker

As of this typing stock index futures and other futures contracts (but particularly index futures) have experienced single-day downward moves not seen in years:

Index Futures

index futures

→ E-mini Dow Jones: down ±1,600 points / 3.7%

→ E-mini S&P 500: down ±260 points / 4.5%

→ E-mini Nasdaq: down ±1,025 points / 5.1%

→ E-mini Russell 2000: down ±128 points / 6.2%

With tomorrow ushering in the Labor Dept.’s release of its monthly Non-farm payrolls report and the furtherance of what looks to be the beginning of a global trade war, expect no drop-off in market volatility.

Index Futures

Traders not only need to be extra cautious in making trading decisions, it’s also important to be aware of important aspects of the markets they’re trading.

Key among these are the daily price limits of the markets you’re trading. A price limit is the maximum price range permitted for a futures contract in each trading session. When markets hit the price limit, different actions occur depending on the product being traded.

Index Futures

Some markets may temporarily halt until price limits can be expanded or trading may be stopped for the day based on regulatory rules. Different futures contracts will have different price limit rules; i.e. Equity Index futures have different rules than Agricultural futures.

Price limits are re-calculated daily and remain in effect for all trading days (except in certain physically-deliverable markets, where price limits are lifted prior to expiration so that futures prices are not prevented from converging on prices for the underlying commodity).

Index Futures

Equity Indexes futures have a three level expansion: 7%, 13% and 20% to the downside, and a 7% limit up and down in overnight trading.

Follow the links below to the CME Group web site to find more information on price limits generally and specific price limits for the markets you’re trading:

Find daily price limits for CME Group Agricultural, Cryptocurrency, Energy, Equity Index, Interest Rates, and Metals products: click here.

Index Futures

S

May Meal

soybean 2

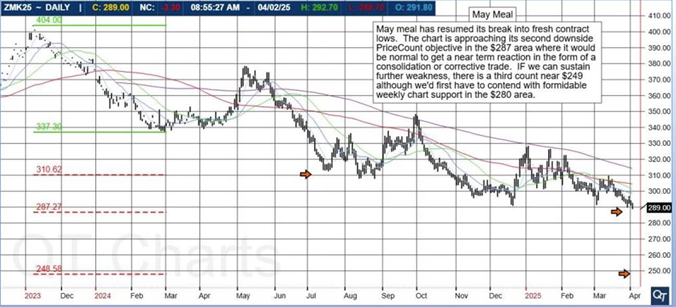
May meal has resumed its break into fresh contract lows. The chart is approaching its second downisde PriceCount objective in the $287 area where it would be normal to get a near term reaction in the form of a consolidation or corrective trade. IF we can sustain further weakness, there is a third count near $249 although we’d first have to contend with formidable weekly chart support in the $280 area.

That’s May Meal

a100f8cb afb9 4151 95fc e0ce93896d95

The PriceCount study is a tool that can help to project the distance of a move in price. The counts are not intended to be an ‘exact’ science but rather offer a target area for the four objectives which are based off the first leg of a move with each subsequent count having a smaller percentage of being achieved.

It is normal for the chart to react by correcting or consolidating at an objective and then either resuming its move or reversing trend. Best utilized in conjunction with other technical tools, PriceCounts offer one more way to analyze charts and help to manage your positions and risk. Learn more at www.qtchartoftheday.com

Trading in futures, options, securities, derivatives or OTC products entails significant risks which must be understood prior to trading and may not be appropriate for all investors. Past performance of actual trades or strategies is not necessarily indicative of future results.

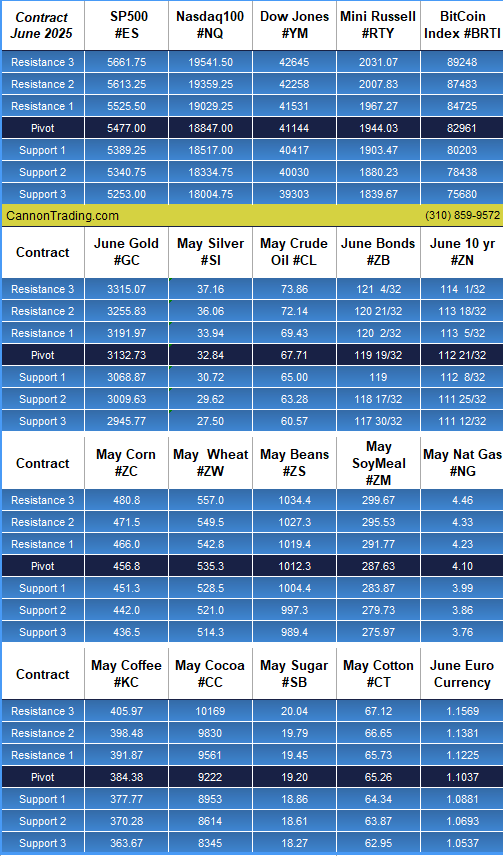
Daily Levels for April 4th, 2025

eddcf476 d2d8 4735 bfaa 4f1e0f0f6510

Want to feature our updated trading levels on your website? Simply paste a small code, and they’ll update automatically every day!

Click here for quick and easy instructions.

822b33c5 2339 45ed bc84 e9c8f8c7358e

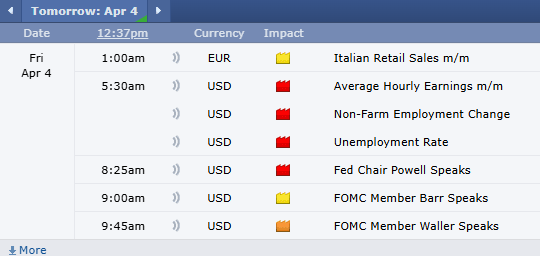
Economic Reports

provided by: ForexFactory.com

All times are Eastern Time (New York)

613d6733 4860 4b59 87ff 3945dafcd142

Find us on Trustpilot

stars

Trading Futures, Options on Futures, and retail off-exchange foreign currency transactions involves substantial risk of loss and is not suitable for all investors. You should carefully consider whether trading is suitable for you in light of your circumstances, knowledge, and financial resources. You may lose all or more of your initial investment. Opinions, market data, and recommendations are subject to change at any time.

Call Now

Join our Private Facebook group

Subscribe to our YouTube Channel

Listen to our podcast: Subscribe on AppleSpotify, Amazon

or wherever you listen to podcasts!

S
Facebook  Instagram  LinkedIn
S
ef3ab1c9 8d6d 4e60 a3f1 af5d9d4ecbb3
Services
Software
Tools
Community
Contact

Futures Levels & Economic Reports 7.09.2014

Connect with Us! Use Our Futures Trading Levels and Economic Reports RSS Feed.

Like us on FacebookFollow us on TwitterView our profile on LinkedInFind us on Google+Cannon Trading Futures Trading Resistance & Support Levels and Economic ReportsFind us on Yelp

1. Market Commentary
2. Futures Support and Resistance Levels – S&P, Nasdaq, Dow Jones, Russell 2000, Dollar Index
3. Commodities Support and Resistance Levels – Gold, Euro, Crude Oil, T-Bonds
4. Commodities Support and Resistance Levels – Corn, Wheat, Beans, Silver
5. Futures Economic Reports for Wednesday July 9, 2014

Hello Traders,

For 2014 I would like to wish all of you discipline and patience in your trading!

I am not sure if it is the overbought conditions stock index futures are in, perhaps fear of the start of earning season or maybe it is the tense situation over in Israel/ Middle East – but the result today was one of the more meaningful down days of the last few months along with above avg. volume.


Not sure it is anything more than normal market action after indices made all time highs last week….I am a little more skeptic now days when it comes to the short side of the indices. That been said, if September SP500 can break below 1952 ( just a bit below today’s lows) I think we have higher chances of a continuation lower.

In between, know what time frame you are trading, know your rules, your objectives, accept the fact that you will have good and bad trading days and measure your progress after you define what it is.

Trading Levels and Economic Reports for April 3, 2013


Jump to a section in this post:

1. Market Commentary
2. Support and Resistance Levels – S&P, Nasdaq, Dow Jones, Russell 2000, Dollar Index
3. Support and Resistance Levels – Gold, Euro, Crude Oil, T-Bonds
4. Support and Resistance Levels – Corn, Wheat, Beans, Silver
5. Economic Reports for Wednesday April 3, 2013


Hello Traders,

For 2013 I would like to wish all of you discipline and patience in your trading! 

So far most selling in stock index futures are met with volume buying at lower levels. I wish I had an idea of how long this would last….but I don’t. What can change the dynamics are the few employment reports we have this week. Starting with tomorrow ADP report, Thursday weekly report and non-farm payroll (the big report) this
Friday.
Be aware of when the different reports come out and their importance. I post the upcoming reports in this blog and I like using forexfactory.com as a source as well as when I do research about past reports.