Bear Trap?

What is a Bear Trap? Fed Speakers and more…
By John Thorpe, Senior Broker
With the Stock market pausing at these levels, what gives? Are we in a Bear Trap?
Bear Trap Definition:
A bear trap in trading occurs when an index appears to be in decline. Traders move in, expecting a continuing decline, posting short sales to profit from the downturn. However, the index unexpectedly reverses direction, causing those who bet against it (the bears) to lose on their trades.
Bear Trap: How to Mitigate Them
Bear Traps are very difficult to determine. This would mandate the need for good risk management tools, stops, option strategies, smaller position size when you believe your technical have signaled a bear market.
Choose your opportunities wisely. Prepare for shocks, on inflation soft and hard data in addition to the fed speakers the rest of this week. 2 tomorrow, 1 Thursday and 2 on Friday along with Core PCE Thursday and Mich. Consumer sentiment.
The Stock market has begun revealing the battle between Push-Pull inflation with Tariff uncertainty.
Kremlin on Tuesday acknowledged they’ve agreed to develop measures to stop strikes on Ukraine and Russian energy facilities for 30 days
Tomorrow:
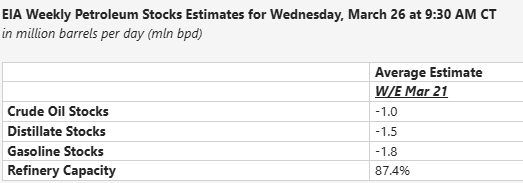
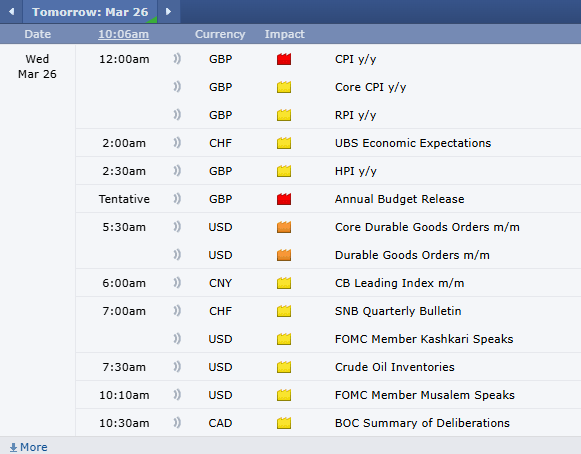
Econ Data: Durable Goods, EIA Crude Stocks
FED Speak: Kashkari 9:00 CDT, Musalem 9:10 CDT
Earnings: Quiet

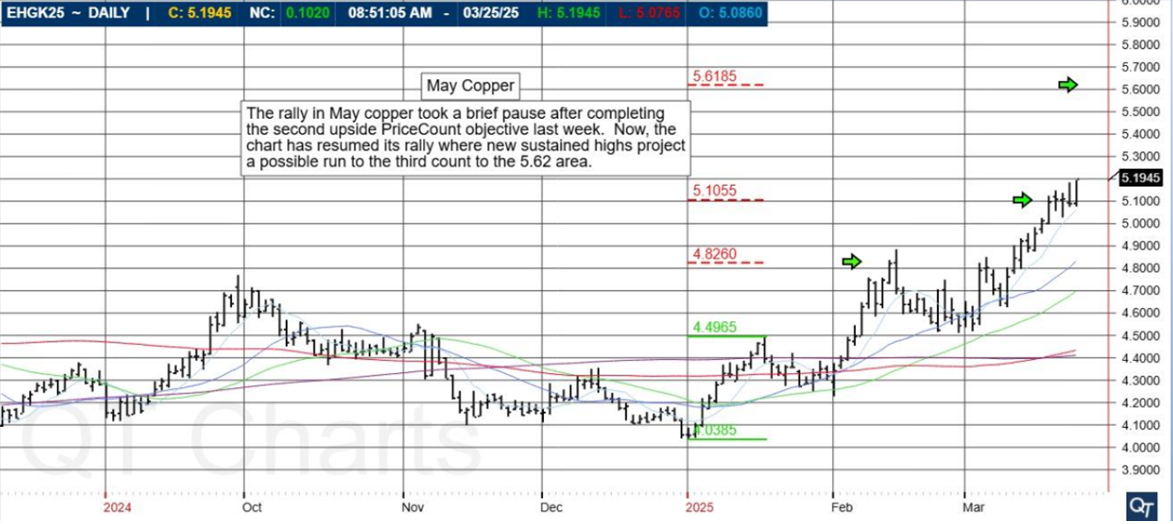
May Copper
The rally in May copper took a brief pause after completing the second upside PriceCount objective last week. Now, the chart has resumed its rally where new sustained highs project a possible run to the third count to the 5.62 area.

Chart above is provided by QT Market Center, A Swiss army knife charting package that’s not just for Hedgers, Cooperatives and Farmers alike but also for Spread traders, Swing traders and shorter time frame application for intraday traders with a unique proprietary indicator that can be applied to your specific trading needs.
Free Trial Available
The PriceCount study is a tool that can help to project the distance of a move in price. The counts are not intended to be an ‘exact’ science but rather offer a target area for the four objectives which are based off the first leg of a move with each subsequent count having a smaller percentage of being achieved. It is normalfor the chart to react by correcting or consolidating at an objective and then either resuming its move or reversing trend. Best utilized in conjunction with other technical tools, PriceCounts offer one more way to analyze charts and help to manage your positions and risk. Learn more at www.qtchartoftheday.com
Trading in futures, options, securities, derivatives or OTC products entails significant risks which must be understood prior to trading and may not be appropriate for all investors. Past performance of actual trades or strategies is not necessarily indicative of future results.
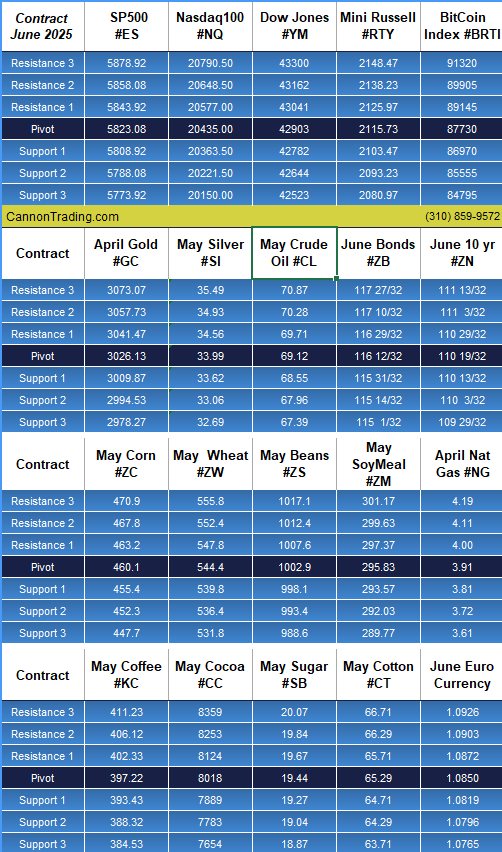
Daily Levels for March 26th, 2025

Want to feature our updated trading levels on your website? Simply paste a small code, and they’ll update automatically every day!
Click here for quick and easy instructions.

Economic Reports
provided by: ForexFactory.com
All times are Eastern Time (New York)

|
||||||||||||||||||||||||||||
|
||||||||||||||||||||||||||||
|

