Have a great weekend!
GOOD TRADING!
TRADING LEVELS
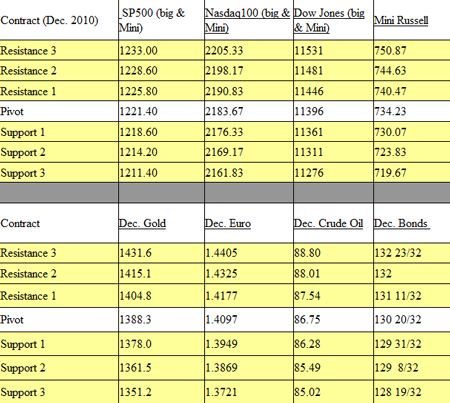 Continue reading “Futures Trading Levels for November 8th, 2010”
Have a great weekend!
GOOD TRADING!
TRADING LEVELS
 Continue reading “Futures Trading Levels for November 8th, 2010”
A BIG 24 hours lay ahead….I suspect some volatility to hit the night markets as election results come out and then we jump right into FOMC tomorrow.
FOMC tomrrow around 2:15 Eastern time.
FOMC days have different characteristics than other trading days. If you have traded for a while, check your trading notes from past FOMC days that may help you prepare for tomorrow.
if you’re a newcomer, take a more conservative approach and make sure you understand that the news can really move the market.
My observations suggest choppy, low volume up until announcement, followed by some sharp volatile moves right during and after the announcement.
I am including a five-minutes chart from Sept. 21st of this year, which was the last FOMC we had for your reference.
To be honest I don’t have any feel for the medium term outlook of stock indices.
I do like some of the intraday set ups we get in different markets such as Crude, Euro and the Mini SP.
We do have some reports tomorrow and it is the last trading day of the month so we should see some interesting price action.
As far as “mental tip”: keep reminding yourself that the hardest battle for a trader is waiting, patience and fighting ones own demons that normally appear when losing trades happen. Try to be among the tough ones who can control the negative emotions losing trades bring out and your trading will progress. Continue reading “Futures Trading Levels and Mental Tips for October 29th 2010”
Stocks finished pretty much unchanged today, which brings me to another point….
There ARE OTHER MARKETS one can day-trade….Most day-traders focus on the Mini SP 500 and it’s relatives:
Mini Nasdaq, Mini Dow, Mini Russell etc. because of volume, familiarity, trading hours etc.
However, markets like bonds, Euro Currency, Crude oil, beans, corn to name a few do offer day trading opportunities and risks. Different market have different personalities which may fit different traders. Different markets also have different trading hours when volatility is present, different volatility at different times and other
characteristics which traders may want to explore. During the day-trading charts service I hold daily, I feature the mini SP 500 chart along with Euro currency and Crude oil and possible trade set ups.
As always I recommend using demo account when exploring trading in market you normally don’t trade, as well as performing some research regarding tick size, price behavior and more.
FREE Trial for the Day-Trading Charts Service:
*************************************************************
https://www.cannontrading.com/tools/intraday-futures-trading-signals
************************************************************* Continue reading “Futures Trading Levels and Day Trading Webinar Trial, October 27th 2010”
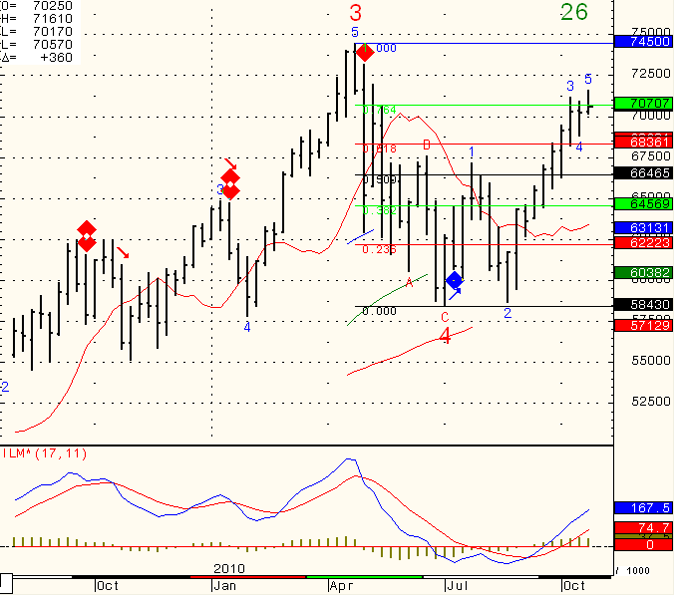
Weekly chart of the mini Russell 2000 for your review below.
Continue reading “Futures and Commodity Trading Levels for October 26th, 2010”
| Daily Support & Résistance Levels | Mini-S&P 500 Futures Dec. 10 |
Mini-Nasdaq 100 Futures Dec. 10 |
Mini-Dow Futures Dec. 10 |
Mini Russell 2000 Futures Dec.10 |
30-year US Bond Futures Dec. 10 |
10-Year US Note Futures Dec. 10 |
|---|---|---|---|---|---|---|
| Support 3 | 1167.25 | 2051.50 | 11014 | 688.10 | 12926 | 12528 |
| Support 2 | 1172.00 | 2066.00 | 11053 | 692.70 | 13025 | 12602 |
| Support 1 | 1175.00 | 2076.00 | 11077 | 695.60 | 13109 | 12610 |
| Resistance 1 | 1186.25 | 2104.75 | 11164 | 709.50 | 13129 | 12621 |
| Resistance 2 | 1189.50 | 2118.00 | 11213 | 711.70 | 13210 | 12628 |
| Resistance 3 | 1196.75 | 2133.00 | 11289 | 719.70 | 13230 | 12707 |
| Daily Support & Resistance Levels |
Gold Futures Dec.2010 |
Silver Futures Dec. 2010 |
Copper Futures Dec. 2010 |
Crude Oil Futures Nov. 2010 |
Euro Curr. Dec. 2010 |
Dollar Index Dec. 2010 |
| Support 3 | 1273.7 | 21.36 | 3.695 | 79.90 | 1.3763 | .7634 |
| Support 2 | 1300.7 | 22.21 | 3.720 | 80.72 | 1.3819 | .7706 |
| Support 1 | 1315.6 | 23.16 | 3.752 | 81.11 | 1.3850 | .7740 |
| Resistance 1 | 1334.0 | 23.37 | 3.850 | 81.87 | 1.4042 | .7795 |
| Resistance 2 | 1343.0 | 23.65 | 3.868 | 82.49 | 1.4100 | .7802 |
| Resistance 3 | 1360.0 | 24.15 | 3.880 | 83.10 | 1.4156 | .7861 |
Updated: 22-Oct-10 07:55 ET
| Date | ET | Release | For | Actual | Briefing.com | Consensus | Prior | Revised From |
|---|---|---|---|---|---|---|---|---|
| Oct 25 | 10:00 | Existing Home Sales | Sep | NA | NA | 4.25M | 4.13M | NA |
| Oct 26 | 09:00 | Case-Shiller 20-city Index | Aug | NA | NA | NA | 3.18% | NA |
| Oct 26 | 10:00 | Consumer Confidence | Oct | NA | NA | NA | -0.5% | NA |
| Oct 26 | 10:00 | FHFA Home Price Index | Aug | NA | NA | 1.4 | -0.7 | NA |
| Oct 27 | 7:00 | MBA Mortgage Applications | 10/22 | NA | NA | NA | -10.5% | NA |
| Oct 27 | 8:30 | Durable Orders | Sep | NA | NA | 0.8% | 4.13M | -1.3% |
| Oct 27 | 8:30 | Durable Orders – ex transporation | Aug | NA | -0.2% | 4.25M | 2.0% | NA |
| Oct 27 | 10:00 | New Home Sales | Sep | NA | NA | 297K | 288K | NA |
| Oct 27 | 10:30 | Crude Inventories | 10/23 | NA | NA | NA | 0.667M | NA |
| Oct 28 | 8:30 | Initial Claims | 10/23 | NA | NA | NA | 452K | NA |
| Oct 28 | 8:30 | Continuing Claims | 10/16 | NA | NA | NA | 4441K | NA |
| Oct 29 | 8:30 | GDP-Adv. | Q3 | NA | NA | 2.4% | 1.7% | NA |
| Oct 29 | 8:30 | Chain Deflator-Adv. | Q3 | NA | NA | NA | 1.9% | NA |
| Oct 29 | 8:30 | Employment Cost Index | Q3 | NA | NA | 0.5% | 0.5% | NA |
| Oct 29 | 9:45 | Chicago PMI | Oct | NA | NA | NA | 60.40 | NA |
| Oct 29 | 9:55 | Michigan Sentiment – Final | Oct | NA | NA | 68.0 | 67.9 | NA |
Continue reading “Daily Support & Resistance and Economic Data to be Released, October 22nd 2010”
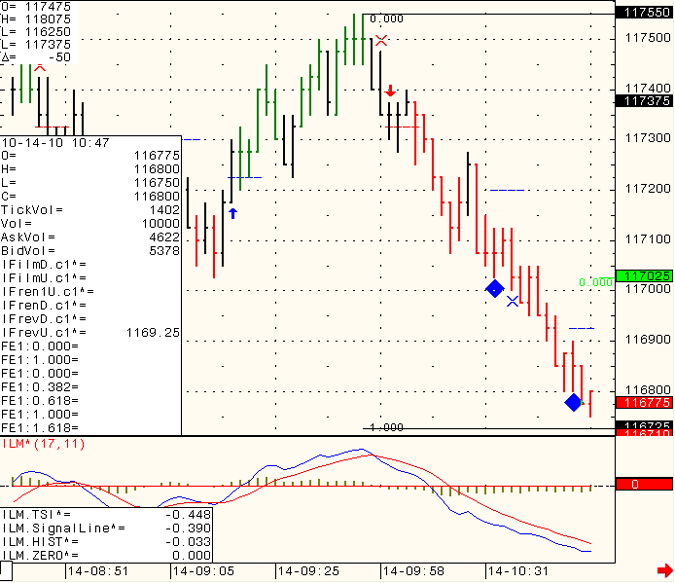
Screen shot from today’s session during our “live charts” service where one can see realtime trade set ups below.
For a free trial please visit:
https://www.cannontrading.com/tools/intraday-futures-trading-signals
Continue reading “Futures & Commodity Trading Levels and Charts for October 15th 2010”
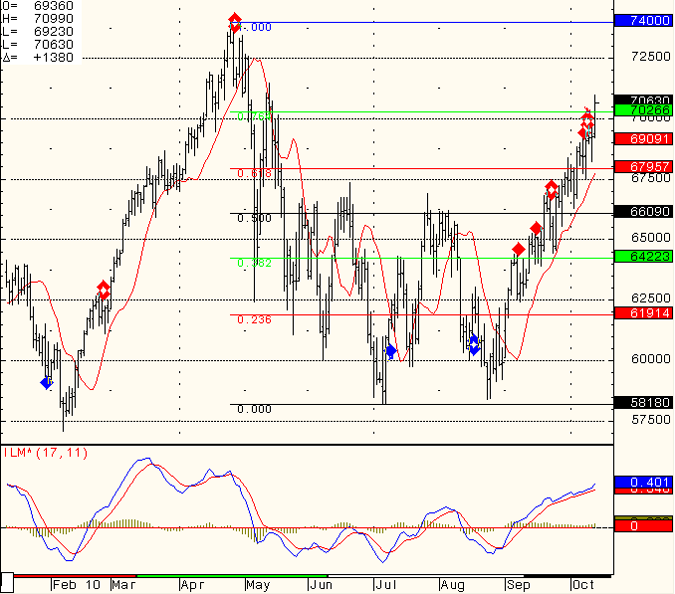
The FED keeps pumping money through its “Quantitative Easing” and the market continues to bounce higher.
Not sure how long this “game” will continue but a technical overview of the mini Russell (which I feel is the leader amongst indicies) is below for your information.
Continue reading “Futures Trading Levels & Economic Reports for October 14th 2010”
FOMC tomorrow around 2:15 Eastern time. Even before that we will start the day with some important housing numbers. FOMC days have different characteristics than other trading days. If you have traded for a while, check your trading notes from past FOMC days that may help you prepare for tomorrow. If you are a newcomer, take a more conservative approach and make sure you understand that the news can really move the market. My observations suggest choppy, low volume up until announcement, followed by some some sharp volatile moves right during and after the announcement. I am including 5 minutes chart from August 10th of this year, which was the last FOMC we had for your reference. Continue reading “FOMC to Provide Futures Trading Market with Direction, September 21st, 2010”
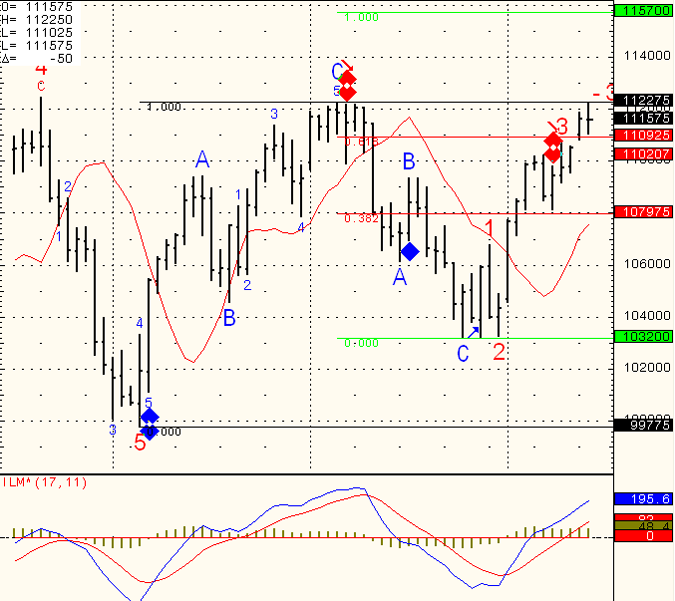
Well by now this is the 3rd or 4th time we are knocking on 1122.75…..that means one out of two (in my opinion): Tomorrow morning reports help this market break this level and start another leg up towards 1157.00
OR…..
Market fails one more time against this level, fills the gap below ( 1105.75) before giving us some additional clues.
I would love to have the “correct answer” to give you but only time and price action will tell….
Continue reading “Commodities and Futures Trading Levels, September 16th 2010”