Memorial Day Holiday Schedule 2014 for CME / Globex and ICE Exchanges

Memorial Day Holiday Schedule 2014 for CME / Globex and ICE Exchanges


CME / CBOT / Globex® Memorial Day Holiday Schedule

Equity Products

Friday, May 23

1615 CT / 1715 ET / 2115 UTC – Regular close

Sunday, May 25

1700 CT / 1800 ET / 2200 UTC – Regular open for trade date Tuesday, May 27*

Monday, May 26

1200 CT / 1300 ET / 1700 UTC – Trading halt (pre-open)

1700 CT / 1800 ET / 2200 UTC – Products resume trading

Tuesday, May 27

1615 CT / 1715 ET / 2115 UTC – Regular close

Interest Rate & FX Products

Friday, May 23

1515 CT / 1615 ET / 2015 UTC – Early close

Sunday, May 25

1700 CT / 1800 ET / 2200 UTC – Regular open for trade date Tuesday, May 27*

Monday, May 26

1200 CT / 1300 ET / 1700 UTC – Trading halt (pre- open)

1700 CT / 1800 ET / 2200 UTC – Products resume trading

Tuesday, May 27

1600 CT / 1700 ET / 2100 UTC– Regular close

Energy, Metals & DME Products

Friday, May 23

1615 CT / 1715 ET / 2115 UTC – Regular close

Sunday, May 25

1700 CT / 1800 ET / 2200 UTC – Regular open for trade date Tuesday, May 27*

Monday, May 26

1200 CT / 1300 ET / 1700 UTC – Trading halt (pre-open)

1700 CT / 1800 ET / 2200 UTC – Products resume trading

Tuesday, May 27

1615 CT / 1715 ET/ 2115 UTC – Regular close

*Dates and times are subject to change

*Note: Session orders entered on Sunday are for trade date Tuesday, May 27

and will continue working until Tuesday’s close unless otherwise noted.

Globex® Memorial Day Holiday Schedule

Grain, Oilseed & MGEX Products

Friday, May 23

Regular close – Per each product schedule

Sunday, May 25

1600 CT / 1700 ET / 2100 UTC – Pre-open for trade date Tuesday, May 27*

Monday, May 26

1900 CT / 2000 ET / 0000 – Open for trade date Tuesday, May 27

Tuesday, May 27

0700 CT / 0800 ET / 1200 UTC – MGEX Apple Juice – Regular open

Regular close – Per each product schedule

Livestock, Dairy & Lumber Products

Friday, May 23

Regular close – Per each product schedule for:

• Livestock

• Dairy

• Lumber

Monday, May 26

1700 CT / 1800 ET / 2200 UTC – Dairy markets open for trade date Tuesday, May 27*

Tuesday, May 27

900 CT / 1000 ET / 1400 UTC – Lumber market open

905 CT / 1005 ET / 1405 UTC – Livestock markets open

Regular close – Per each product schedule

More details at:  http://www.cmegroup.com/tools-information/holiday-calendar/files/2014-memorial-day-holiday-schedule.pdf

ICE Futures U.S.(sm) Memorial Day, May 26, 2014:

AGRICULTURAL PRODUCTS*

DATE OPEN OUTCRY / ELECTRONIC

Fri May 23 Regular Hours / Regular Hours

Mon May 26 Closed / Closed

*Including RJ/CRB and CCI contracts.

FINANCIAL PRODUCTS

(Currencies Pairs — U.S. Dollar Index)

DATE OPEN OUTCRY /  ELECTRONIC

Fri, May 23 Early close at 1:00 p.m. ET  / Early close at 4:15 p.m. ET

Mon, May 26 Closed / Early close at 1:00 p.m. ET

STOCK INDEX PRODUCTS

(NYSE Composite Index— Russell Indexes)

DATE OPEN OUTCRY / ELECTRONIC

Fri May 23 Regular Hours / Early Close at 4:15 p.m. ET

Mon May 26 Closed / Early close at 11:30 a.m. ET

**For those futures and options contracts which continue to trade on the floor.

More details at: https://www.theice.com/publicdocs/futures_us/exchange_notices/MemorialDay%20_2_.pdf

The above sources were compiled from sources believed to be reliable.  Cannon Trading assumes no responsibility for any errors or omissions.  It is meant as an alert to events that may affect trading strategies and is not necessarily complete.  The closing times for certain contracts may have been rescheduled.
Volatility in the S&P Futures Markets and Mini S&P Chart 4.25.2014

Connect with Us! Use Our Futures Trading Levels and Economic Reports RSS Feed.

Like us on FacebookFollow us on TwitterView our profile on LinkedInFind us on Google+Cannon Trading Futures Trading Resistance & Support Levels and Economic ReportsFind us on Yelp

1. Market Commentary
2. Futures Support and Resistance Levels – S&P, Nasdaq, Dow Jones, Russell 2000, Dollar Index
3. Commodities Support and Resistance Levels – Gold, Euro, Crude Oil, T-Bonds
4. Commodities Support and Resistance Levels – Corn, Wheat, Beans, Silver
5. Futures Economic Reports for Friday April 25, 2014

Hello Traders,

For 2014 I would like to wish all of you discipline and patience in your trading!

WOW! Volatility the first 90 minutes of cash open reminded me almost of the summer of 2008…..
Market gaped higher based on APPLE earnings yesterday but when cash opened took a nose dive based on news from Ukraine….

Times like that are dangerous for MOST traders. yes, some of the more experienced or perhaps well capitalized traders look for days like this but for many others the fast and powerful moves can be a little too much…..

My advice? Know who you are as trader, learn to trade with stops, learn to lower your exposure/ trading quantity when volatility picks up and most of all if at any time you feel VERY UNCOMFORTABLE…take a few minutes, step away from the machine, take some deep breaths and decide if and how to continue….

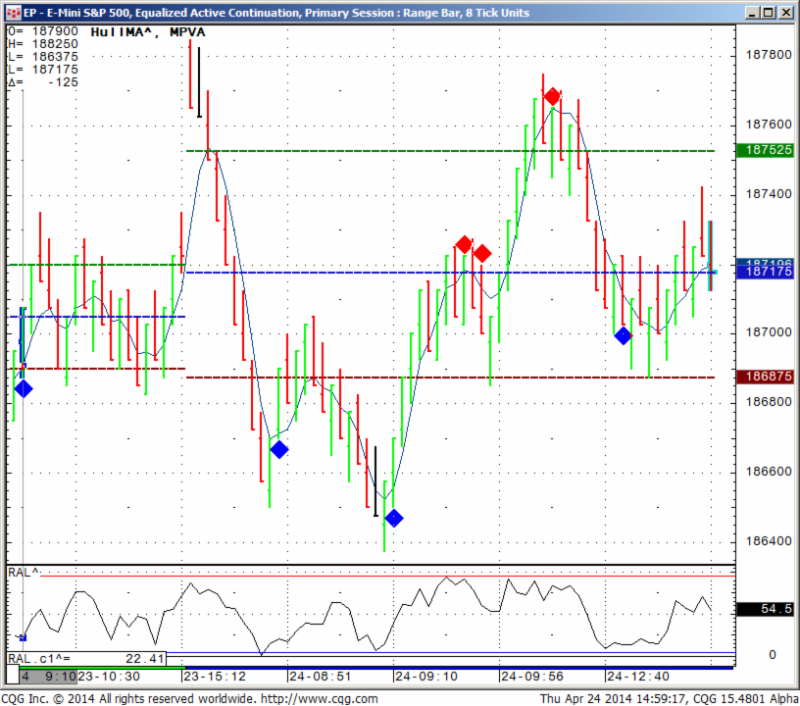
In between see below my mini SP 500 chart ( 8 ticks range chart) along with my proprietary indicators/ ALGO from today:

EP - E-mini S&P 500, Equalized Active Continuation, Primary Session: : Range Bar, 8 Tick Units
EP – E-mini S&P 500, Equalized Active Continuation, Primary Session: : Range Bar, 8 Tick Units

Would you like to have access to my DIAMOND and TOPAZ ALGOs as shown above and be able to apply for any market and any time frame on your own PC ?  You can now have a three weeks free trial where I enable the ALGO along with few studies for your own sierra/ ATcharts OR CQG Q Trader.

Continue reading “Volatility in the S&P Futures Markets and Mini S&P Chart 4.25.2014”

Futures Market Observations and Economic Reports 4.24.2014

Connect with Us! Use Our Futures Trading Levels and Economic Reports RSS Feed.

Like us on FacebookFollow us on TwitterView our profile on LinkedInFind us on Google+Cannon Trading Futures Trading Resistance & Support Levels and Economic ReportsFind us on Yelp

1. Market Commentary
2. Futures Support and Resistance Levels – S&P, Nasdaq, Dow Jones, Russell 2000, Dollar Index
3. Commodities Support and Resistance Levels – Gold, Euro, Crude Oil, T-Bonds
4. Commodities Support and Resistance Levels – Corn, Wheat, Beans, Silver
5. Futures Economic Reports for Thursday April 24, 2014

Hello Traders,

For 2014 I would like to wish all of you discipline and patience in your trading!

Getting Clues from other markets?

When day-trading a specific market do you only look at the chart for that specific market? maybe you took it a step further and you are viewing multiple time frame charts for the same market which is a good step in my eyes.

Now lets take this even one step further by observing what markets have correlation, direct or inverse to the market you are trading, perhaps this can help you make decisions when trading.

I will give a few examples from my experience:

When I am in a position in the mini SP 500, I will often observe what the bonds are doing ( many times inverse correlation), I will take notice of what the Dow, Russell and NASDAQ are doing as well ( direct correlation)

If I am trading crude oil, I will many times pay attention to what unleaded gas and heating oil are doing (very close, although not direct correlation) as well as what WTI crude is doing.

One more example may be when I have a position trade in beans and I will try to get a feel for the overall direction of the grain markets (is there a trend? are they sideways?) by looking at corn, wheat in general and then look to see what bean oil and soy meal which are by products of beans are doing.

One question that can be asked is “what do you mean observe this or that market”? and a good example will be:

Lets say I am short the mini SP 500 and I am not sure if to take profit or not. I look at the mini Russell and see that mini Russell just made new lows, that will give me more confidence to stay in my short position as I feel there might be more room to the downside.

Continue reading “Futures Market Observations and Economic Reports 4.24.2014”

Good Friday Futures Trading Holiday Hours and Economic Reports 4.17.2014

Connect with Us! Use Our Futures Trading Levels and Economic Reports RSS Feed.

Like us on FacebookFollow us on TwitterView our profile on LinkedInFind us on Google+Cannon Trading Futures Trading Resistance & Support Levels and Economic ReportsFind us on Yelp

1. Market Commentary
2. Futures Support and Resistance Levels – S&P, Nasdaq, Dow Jones, Russell 2000, Dollar Index
3. Commodities Support and Resistance Levels – Gold, Euro, Crude Oil, T-Bonds
4. Commodities Support and Resistance Levels – Corn, Wheat, Beans, Silver
5. Futures Economic Reports for Thursday April 17, 2014

Hello Traders,

For 2014 I would like to wish all of you discipline and patience in your trading!

Good Friday Day Holiday Schedule for CME / Globex and ICE Exchanges

All times listed as Central Time

Thursday, April 17

  • CME & CBOT Equity Products

1615 CT / 1715 ET / 2115 UTC – Regular close

  • ICE Equity Products

1615 CT / 1715 ET / 2115 UTC – Regular close

  • CME & CBOT Interest Rate & FX Products

1600 CT 1700 ET / 2100 UTC – Regular close

  • CBOTKCBT Grain & Agricultural Products

Regular close – per each product schedule

Note: Grain pre-opening between 2:30 P.M. – 4:00 P.M.

  • Other CME Group Products

1355 CT / 1455 ET / 1855 UTC – Early Close

  • ICE SoftsCash-Settled Grains

Regular close – Per each product schedule

Friday, April 18

  • CME & CBOT Equity Products

CME Globex is closed

  • CME & CBOT Interest Rate & FX Products

CME Globex is closed

  • CBOT, KCBT Grain & Agricultural Products

CME Globex is closed

  • Other CME Group Products

CME Globex is closed

Sunday, April 20

  • CME & CBOT Equity Products

1700 CT / 1800 ET / 2200 UTC – Regular open for trade date Monday, Apr 21

  • CME & CBOT Interest Rate & FX Products

1700 CT/ 1800 ET / 2200 UTC – Regular open for trade date Monday, Apr 21

  • CBOTKCBT Grain & Agricultural Products

1900 CT / 2000 ET / 2300 UTC – Regular open for trade date Monday, Apr 21

  • Other CME Group Products

Regular Open per each product schedule for:

Livestock, Weather, Real Estate, Lumber, Dairy Continue reading “Good Friday Futures Trading Holiday Hours and Economic Reports 4.17.2014”

Futures Trading Levels and Reports for August 30, 2012

Jump to a section in this post:

1. Market Commentary
2. Support and Resistance Levels – S&P, Nasdaq, Dow Jones, Russell 2000, Dollar Index
3. Support and Resistance Levels – Gold, Euro, Crude Oil, T-Bonds
4. Support and Resistance Levels – Corn, Wheat, Beans, Silver
5. Economic Reports for Thursday August 30, 2012


Hello Traders,

One Way to Eliminate Fear and Greed While Day Trading

Disclaimer

The methods described in this article are for educational purposes only. Past results are not necessarily indicative of future results. The author and the publisher assume no responsibility for your trading results. Trading involves a high degree of risk. No recommendation is being made to buy any stock, commodity, option or other financial instrument. Consult your financial advisor before starting any investment system.


It is a known fact that fear and greed can be a trader’s worst enemies.

I’ve found one way that has helped some clients deal with fear and greed and their cousin, “getting out of winners too soon and staying in losers too long.”

What is it? Entering Multiple Contracts: Philosophy

In order to enter multiple contracts while day trading, one has to have the appropriate risk capital and margin requirements. But the advantage of trading more than one “unit” or splitting your trading size into two or more parts is as such:

If you enter a trade with one contract (or if you are treating your trading size as one unit, meaning you enter a trade with 4 contracts and exit the trade with 4 contracts), you can face a very quick dilemma, especially when day-trading. Consider the two following scenarios:

  1. You get in and very quickly you are up 2 mini SP points…what do you do? Do you take profit? Bring your stop loss closer? How do you avoid getting out too early or too late?
  2. You enter a trade and it goes against you rather quickly…if you get out then it is a loser…but the little voice in your head says “what if the market goes back up?”

In the first case scenario, when market decided to be nice to us and moved in our direction, I like to exit half of my positions relatively quickly. In the case of the mini SP, this would be around 7 ticks profit.

What I’ve found is that this will allow me to manage the rest of the trade in a much more relaxed manner. Since I’ve already locked profits in, now I can look for a proper stop close to my break-even level. I can analyze my next target more realistically and, if the market provides room for additional gains, be there to participate.

Continue reading “Futures Trading Levels and Reports for August 30, 2012”

Futures Trading Levels and Economic Reports for December 7th 2010

Today was a “slow trading day” when it came to stock indices, which leads me to a good point I would like to make. Most of our day traders, trade the e-mini stock index futures, mostly the mini SP because of its heavy daily volume and exposure.

However, I think that day-traders should be able to follow at least another market, maybe even two additional markets and look for different set up in these markets as well.

Good example from today is the Euro currency. While the mini SP was pretty dead….the Euro had nice range, good volatility and good volume which presents both risks and opportunities for day-traders.

Obviously, before you start trading a new market you should educate yourself on tick size, trading hours, “personality”, when is there more volume in that specific contract etc.

If you do so, I think you will achieve a couple of things, first is diversification. While some days trades in certain market may not work, trades in a different market may provide balance.

Also, if on certain days, certain markets are “sleepy” ( which most day-traders do NOT like), another market may have more action….

As always, do your homework, practice in simulation mode first and make sure you understand the “new contract” you may be trading along with the risks involved.

Below is a screen shot of the Euro Currency from todays webinar session :
( free trial at – https://www.cannontrading.com/tools/intraday-futures-trading-signals )

SP-500-Day-Trading-2010-12-07 Continue reading “Futures Trading Levels and Economic Reports for December 7th 2010”

Daily Support & Resistance and Economic Data to be Released, October 12th 2010


Daily Support & Résistance Levels Mini-S&P 500 Futures
Dec. 10
Mini-Nasdaq 100 Futures
Dec. 10
Mini-Dow Futures
Dec. 10
Mini Russell 2000 Futures
Dec.10
30-year US Bond Futures
Dec. 10
10-Year US Note
Futures Dec. 10
Support 3 1146.00 1989.00 10770 675.90 13209 12607
Support 2 1150.50 2006.00 10851 680.00 13300 12625
Support 1 1155.50 2016.50 10897 684.00 13326 12703
Resistance 1 1165.00 2035.00 10984 696.90 13519 12722
Resistance 2 1171.25 2051.00 11010 701.60 13612 12727.5
Resistance 3 1174.75 2063.00 11115 707.40 12627 12810.5
Daily Support & Resistance Levels
Gold Futures
Dec.2010
Silver Futures
Dec. 2010
Copper Futures
Dec. 2010
Crude Oil Futures
Nov. 2010
Euro Curr.
Dec. 2010
Dollar Index
Dec. 2010
Support 3 1308.5 22.35 3.720 80.30 1.3667 .7705
Support 2 1326.0 22.86 3.750 80.88 1.3740 .7748
Support 1 1341.0 22.96 3.780 81.55 1.3767 .7773
Resistance 1 1356.0 23.31 3.800 82.48 1.3831 .7799
Resistance 2 1366.0 23.40 3.822 83.50 1.3864 .7817
Resistance 3 1375.0 23.67 3.867 84.43 1.3924 .7878

Updated: 12-Oct-10 7:59 ET

This Week’s Calendar

Click on a “Release” for Insight

Date ET Release For Actual Briefing.com Consensus Prior Revised From
Oct 12 14:00 Minutes of FOMC Meeting 9/21
Oct 13 07:00 MBA Mortgage Applications 10/08 NA NA -0.2%
Oct 13 08:30 Export Prices ex-ag. Sep NA NA 0.5%
Oct 13 08:30 Import Prices ex-oil Sep NA NA 0.3%
Oct 13 10:30 Crude Inventories 10/09 NA NA 3.09M
Oct 13 14:00 Treasury Budget Sep -$32.0B -$33.5B -$46.6B
Oct 14 08:30 Initial Claims 10/09 450K 450K 445K
Oct 14 08:30 Continuing Claims 10/02 4450K 4450K 4462K
Oct 14 08:30 PPI Sep 0.1% 0.2% 0.4%
Oct 14 08:30 Core PPI Sep 0.1% 0.1% 0.1%
Oct 14 08:30 Trade Balance Aug -$40.0B -$44.5B -$42.8B
Oct 15 08:30 CPI Sep 0.1% 0.2% 0.3%
Oct 15 08:30 Core CPI Sep 0.1% 0.1% 0.1%
Oct 15 08:30 Retail Sales Sep 0.2% 0.4% 0.4%
Oct 15 08:30 Retail Sales ex-auto Sep 0.1% 0.4% 0.6%
Oct 15 08:30 NY Fed – Empire Manufacturing Survey Oct 3.0% 5.75 4.10
Oct 15 09:55 Mich Sentiment Oct 67.0 68.5 68.2
Oct 15 10:00 Business Inventories Aug 0.4% 0.5% 1.0%

12. OCT. 2010 – Today´s Highlighted Splits

SYMBOL COMPANY EVENT TITLE EPS ESTIMATE EPS ACTUAL PREV. YEAR ACTIVITY DATE/TIME (ET)
INTC Intel Corporation Q3 2010 Intel Corporation Earnings Release $ 0.50 n/a $ 0.33 12-Oct
CSX CSX Corporation Q3 2010 CSX Corporation Earnings Release $ 1.04 n/a $ 0.74 12-Oct AMC
FAST Fastenal Q3 2010 Fastenal Earnings Release & September 2010 Sales Release $ 0.50 n/a $ 0.32 12-Oct BMO
VOXX Audiovox Corporation Q2 2011 Audiovox Corporation Earnings Release $ 0.00 n/a $ 0.04 12-Oct AMC
DIET eDiets.com, Inc. Preliminary Q3 2010 eDiets.com, Inc. Earnings Release n/a n/a n/a 12-Oct BMO
AIP.L AIR PARTNER Preliminary 2010 AIR PARTNER Earnings Release n/a n/a n/a 12-Oct BMO

Continue reading “Daily Support & Resistance and Economic Data to be Released, October 12th 2010”

Daily Support & Resistance and Economic Data to be Released, October 11th 2010


Daily Support & Resistance Levels Mini-S&P 500 Futures
Dec. 10
Mini-Nasdaq 100 Futures
Dec. 10
Mini-Dow Futures
Dec. 10
Mini Russell 2000 Futures
Dec.10
30-year US Bond Futures
Dec. 10
10-Year US Note
Futures Dec. 10
Support 3 1146.25 2001.50 10877 675.20 13209 12615.5
Support 2 1150.75 2013.00 10919 682.80 13300 12624.5
Support 1 1155.75 2020.00 10942 687.00 13326 12702.5
Resistance 1 1165.00 2032.00 10987 695.00 13519 12721
Resistance 2 11.71.25 2051.00 11010 701.60 13612 12726.5
Resistance 3 1174.75 2063.00 11115 707.40 13627 12810.5
Daily Support & Resistance Levels
Gold Futures
Dec.2010
Silver Futures
Dec. 2010
Copper Futures
Dec. 2010
Crude Oil Futures
Nov. 2010
Euro Curr.
Dec. 2010
Dollar Index
Dec. 2010
Support 3 1325.0 22.35 3.720 80.30 1.3781 76.29
Support 2 1337.0 22.86 3.758 81.53 13827 77.05
Support 1 1344.0 23.18 3.780 82.28 1.3873 77.15
Resistance 1 1356.0 23.69 3.820 82.79 1.4023 77.62
Resistance 2 1366.0 23.85 3.835 83.52 1.4067 77.75
Resistance 3 1375.0 24.08 3.867 84.43 1.4138 77.98

Continue reading “Daily Support & Resistance and Economic Data to be Released, October 11th 2010”