Last Trading Day of The Year | Support and Resistance Levels

Jump to a section in this post:
1. Market Commentary
2. Support and Resistance Levels – S&P, Nasdaq, Dow Jones, Russell 2000
3. Support and Resistance Levels – Gold, Euro, Crude Oil, T-Bonds
4. Support and Resistance Levels – March Corn, March Wheat, Jan Beans, March Silver
5. Economic Reports for Thursday, December 29 2011

divider black 190

1. Market Commentary

Last trading day for 2011 is tomorrow, I expect another thin volume day but sometimes, last trading day of the month/ year on thin volume can create some volatility.

Holiday Hours available at:

New Year’s 2012 Futures Trading Hours and Holiday Trading Schedule

2. Support and Resistance Levels – S&P, Nasdaq, Dow Jones, Russell 2000

Contract (Dec. 2011) SP500
(big & Mini)
Nasdaq100
(big & Mini)
Dow Jones
(big & Mini)
Mini Russell
Resistance Level 3 1270.43 2309.00 12349 755.83
Resistance Level 2 1263.97 2294.50 12279 749.47
Resistance Level 1 1260.73 2287.00 12244 746.13
Pivot Point 1254.27 2272.50 12174 739.77
Support Level 1 1251.03 2265.00 12139 736.43
Support Level 2 1244.57 2250.50 12069 730.07
Support Level 3 1241.33 2243.00 12034 726.73

Continue reading “Last Trading Day of The Year | Support and Resistance Levels”
Market Commentary | Support and Resistance Levels | Special Hours

Jump to a section in this post:
1. Market Commentary
2. Support and Resistance Levels – S&P, Nasdaq, Dow Jones, Russell 2000
3. Support and Resistance Levels – Gold, Euro, Crude Oil, T-Bonds
4. Support and Resistance Levels – March Corn, March Wheat, Jan Beans, March Silver
5. Economic Reports for Thursday, December 29 2011

divider black 190

1. Market Commentary

View the Holiday Trading Hours here.

2. Support and Resistance Levels – S&P, Nasdaq, Dow Jones, Russell 2000

Contract (Dec. 2011) SP500
(big & Mini)
Nasdaq100
(big & Mini)
Dow Jones
(big & Mini)
Mini Russell
Resistance Level 3 1274.53 2317.00 12335 762.90
Resistance Level 2 1267.77 2303.50 12280 756.50
Resistance Level 1 1256.63 2283.00 12185 745.20
Pivot Point 1249.87 2269.50 12130 738.80
Support Level 1 1238.73 2249.00 12035 727.50
Support Level 2 1231.97 2235.50 11980 721.10
Support Level 3 1220.83 2215.00 11885 709.80

Continue reading “Market Commentary | Support and Resistance Levels | Special Hours”

Daily chart of the Dow Jones cash index | Support and Resistance Levels

Jump to a section in this post:
1. Market Commentary
2. Support and Resistance Levels – S&P, Nasdaq, Dow Jones, Russell 2000
3. Support and Resistance Levels – Gold, Euro, Crude Oil, T-Bonds
4. Support and Resistance Levels – March Corn, March Wheat, Jan Beans, March Silver
5. Economic Reports for Wednesday, December 28 2011

divider black 190

1. Market Commentary

Also, I mentioned before and I am mentioning again, volume is much lighter recent days. Be aware of the change in “intra-day personalities of the markets” and I recommend taking the approach of “no trade is better than a bad trade”….

We are also light on economic numbers and reports rest of the week as you can see below.

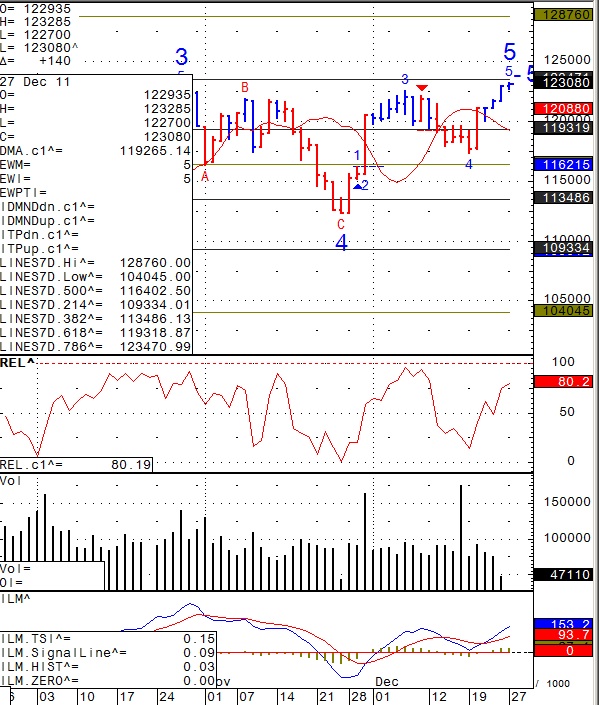
Daily chart of the Dow Jones cash index for your review below. Note the decline in volume over past few days.

39MBQ Continue reading “Daily chart of the Dow Jones cash index | Support and Resistance Levels”

Market Commentaries | Holiday Updates | Support and Resistance Levels

Jump to a section in this post:
1. Market Commentary
2. Support and Resistance Levels – S&P, Nasdaq, Dow Jones, Russell 2000
3. Support and Resistance Levels – Gold, Euro, Crude Oil, T-Bonds
4. Support and Resistance Levels – March Corn, March Wheat, Jan Beans, March Silver
5. Economic Reports for Friday, December 23, 2011

divider black 190

1. Market Commentary

Holiday schedule for this Friday through Tuesday for your review below. Please contact your broker with any questions. This is one of the few times where many markets will be closed from Friday afternoon until early Tuesday morning, so please review schedule below.

Also, I mentioned before and I am mentioning again, volume is much lighter recent days and i suspect that the same will happen next Thursday/ Friday. Be aware of the change in “intra-day personalities of the markets” and I recommend taking the approach of “no trade is better than a bad trade”….

View the Holiday Trading Hours here.

2. Support and Resistance Levels – S&P, Nasdaq, Dow Jones, Russell 2000

Contract (Dec. 2011) SP500
(big & Mini)
Nasdaq100
(big & Mini)
Dow Jones
(big & Mini)
Mini Russell
Resistance Level 3 1262.33 2285.67 12188 758.10
Resistance Level 2 1255.92 2274.33 12152 752.00
Resistance Level 1 1251.83 2268.67 12128 746.90
Pivot Point 1245.42 2257.33 12092 740.80
Support Level 1 1241.33 2251.67 12068 735.70
Support Level 2 1234.92 2240.33 12032 729.60
Support Level 3 1230.83 2234.67 12008 724.50

Continue reading “Market Commentaries | Holiday Updates | Support and Resistance Levels”

Market Commentary | Support and Resistance Levels

span style=”text-decoration: underline;”>Jump to a section in this post:
1. Market Commentary
2. Support and Resistance Levels – S&P, Nasdaq, Dow Jones, Russell 2000
3. Support and Resistance Levels – Gold, Euro, Crude Oil, T-Bonds
4. Support and Resistance Levels – March Corn, March Wheat, Jan Beans, March Silver
5. Economic Reports for Thursday, December 22, 2011

divider black 190

1. Market Commentary

2. Support and Resistance Levels – S&P, Nasdaq, Dow Jones, Russell 2000

Contract (Dec. 2011) SP500
(big & Mini)
Nasdaq100
(big & Mini)
Dow Jones
(big & Mini)
Mini Russell
Resistance Level 2 1249.35 2290.67 12118 759.20
Resistance Level 1 1243.80 2268.33 12082 748.70
Pivot Point 1233.45 2241.67 12008 735.60
Support Level 1 1227.90 2219.33 11972 725.10
Support Level 2 1217.55 2192.67 11898 712.00
Support Level 3 1212.00 2170.33 11862 701.50

Continue reading “Market Commentary | Support and Resistance Levels”

Tuesday Morning Support and Resistance Numbers

Here’s a morning cup o’ joe for all you futures traders, our morning support and resistance levels. Good trading!

divider black 190

Support and Resistance Levels – S&P 500, Nasdaq 100, Dow Jones, Mini Russell 2000, 30-Year US Bond, 10-Year US Note

Contract (Dec. 2011) Mini S&P 500 Mini Nasdaq 100 Dow Jones Mini Russell 2000 30-Year US Bond 10-Year US Note
Resistance Level 3——————————————

Resistance Level 2

——————————————

Resistance Level 1

——————————————

Support Level 1

——————————————

Support Level 2

——————————————

Support Level 3

1240.5 

1232


1223.25


1208.25


1203.5


1193

2275 

2258


2240


2226


2217


2204

12025 

11956


11886


11771


11729


11661

732 

725.5


719.10


712.00


708.40


702.40

14611 

14529


14521


14423


14328


14303

13130 

13118.5


13111


13023.5


13011.5


13001

Continue reading “Tuesday Morning Support and Resistance Numbers”

Mini SP500 daily chart | Support and Resistance Levels

Jump to a section in this post:
1. Market Commentary
2. Support and Resistance Levels – S&P, Nasdaq, Dow Jones, Russell 2000
3. Support and Resistance Levels – Gold, Euro, Crude Oil, T-Bonds
4.Economic Reports for Tuesday, December 20 2011

divider black 190

1. Market Commentary

Front month for stock indices, currencies, grains and most active markets is now MARCH. Symbol for March is H


Gold and Crude front month is February. 


If you are not sure which month you should be trading, please contact your broker. 

  We are now entering a period of the year when volume may be lower than normal. It will be more noticeable starting Friday Dec. 23rd as we will enter the holiday period of Christmas and New year.

Understand that lower volume can results some erratic moves at times and during other periods of the day can create “sleepy, slow ” type of trading.

Make sure you are aware of the trading schedule, reports times so you are not caught by surprise.

Happy Holidays and great trading, mini SP500 daily chart for your review below with possible levels of support and resistance


489

2. Support and Resistance Levels – S&P, Nasdaq, Dow Jones, Russell 2000

Contract (Dec. 2011) SP500
(big & Mini)
Nasdaq100
(big & Mini)
Dow Jones
(big & Mini)
Mini Russell
Resistance Level 3 1234.50 2277.67 11973 744.03
Resistance Level 2 1226.50 2262.33 11912 735.67
Resistance Level 1 1211.50 2233.67 11788 720.13
Pivot Point 1203.50 2218.33 11727 711.77
Support Level 1 1188.50 2189.67 11603 696.23
Support Level 2 1180.50 2174.33 11542 687.87
Support Level 3 1165.50 2145.67 11418 672.33

3. Support & Resistance Levels for Gold, Euro, Crude Oil, and U.S. T-Bonds

divider black 190
4. Economic ReportsBuilding Permits
8:30amHousing Stats
8:30am

Contract Feb. Gold Dec. Euro Jan. Crude Oil March. Bonds
Resistance Level 3 1624.9 1.3100 96.58 148 3/32
Resistance Level 2 1617.1 1.3077 95.61 147 5/32
Resistance Level 1 1605.0 1.3038 94.72 146 23/32
Pivot Point 1597.2 1.3015 93.75 145 25/32
Support Level 1 1585.1 1.2976 92.86 145 11/32
Support Level 2 1577.3 1.2953 91.89 144 13/32
Support Level 3 1565.2 1.2914 91.00 143 31/32

Friday Morning Support and Resistance

Here’s a morning cup o’ joe for all you futures traders, our morning support and resistance levels. Good trading!

divider black 190

Support and Resistance Levels – S&P 500, Nasdaq 100, Dow Jones, Mini Russell 2000, 30-Year US Bond, 10-Year US Note

Contract (Dec. 2011) Mini S&P 500 Mini Nasdaq 100 Dow Jones Mini Russell 2000 30-Year US Bond 10-Year US Note
Resistance Level 3——————————————

Resistance Level 2

——————————————

Resistance Level 1

——————————————

Support Level 1

——————————————

Support Level 2

——————————————

Support Level 3

1241.25

1233


1224.75


1213.25


1207.25


1193

2280.00

2265


2247.5


2215


2196


2135

12038

11972


11906


11826


11776


11694

732

725.5


721.4


712.50


707.00


698.10

14613

14514


14504


14326


14303


14216

13130

13109.5


13102


13014.5


13004


12927

Continue reading “Friday Morning Support and Resistance”

Daily Chart of Feb Gold | Support and Resistance Levels

Jump to a section in this post:
1. Market Commentary
2. Support and Resistance Levels – S&P, Nasdaq, Dow Jones, Russell 2000
3. Support and Resistance Levels – Gold, Euro, Crude Oil, T-Bonds
4. Support and Resistance Levels – March Corn, March Wheat, Jan Beans, March Silver
5. Economic Reports for Friday, December 16, 2011

divider black 190

1. Market Commentary

Gold has been the leader of the general markets last few days.
I tried sending a chart of gold yesterday but the wrong chart went out, so lets try this again:
Daily chart of Feb Gold for your review below –
468

2. Support and Resistance Levels – S&P, Nasdaq, Dow Jones, Russell 2000

Contract (Dec. 2011) SP500
(big & Mini)
Nasdaq100
(big & Mini)
Dow Jones
(big & Mini)
Mini Russell
Resistance Level 3 1230.17 2275.33 11965 737.93
Resistance Level 2 1224.83 2262.67 11925 727.07
Resistance Level 1 1218.67 2245.33 11870 719.83
Pivot Point 1213.33 2232.67 11830 708.97
Support Level 1 1207.17 2215.33 11775 701.73
Support Level 2 1201.83 2202.67 11735 690.87
Support Level 3 1195.67 2185.33 11680 683.63

Continue reading “Daily Chart of Feb Gold | Support and Resistance Levels”

Gold in the Markets | Support and Resistance Levels

Jump to a section in this post:
1. Market Commentary
2. Support and Resistance Levels – S&P, Nasdaq, Dow Jones, Russell 2000
3. Support and Resistance Levels – Gold, Euro, Crude Oil, T-Bonds
4. Support and Resistance Levels – March Corn, March Wheat, Jan Beans, March Silver
5. Daily Chart of February Gold Futures
6. Economic Reports for Thursday, December 15, 2011

divider black 190

1. Market Commentary and Daily Mini S&P 500 Chart

Today’s big mover was gold. While we had big moves in many markets, currencies getting weaker against the dollar, energies lower, stock indices lower, it was the metals lead by gold which experienced some of the bigger % moves.

2. Support and Resistance Levels – S&P, Nasdaq, Dow Jones, Russell 2000

Contract (Dec. 2011) SP500
(big & Mini)
Nasdaq100
(big & Mini)
Dow Jones
(big & Mini)
Mini Russell
Resistance Level 3 1230.33 2295.00 11968 734.27
Resistance Level 2 1224.27 2277.00 11917 726.83
Resistance Level 1 1215.13 2252.00 11833 715.57
Pivot Point 1209.07 2234.00 11782 708.13
Support Level 1 1199.93 2209.00 11698 696.87
Support Level 2 1193.87 2191.00 11647 689.43
Support Level 3 1184.73 2166.00 11563 678.17

Continue reading “Gold in the Markets | Support and Resistance Levels”