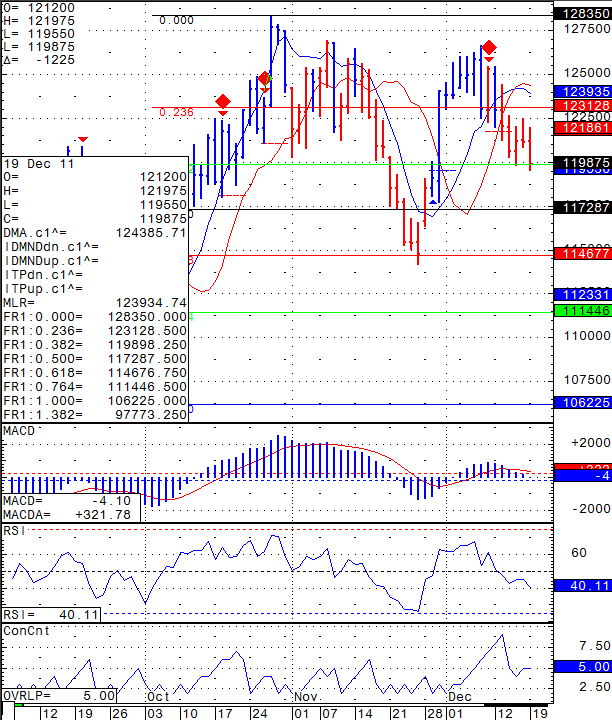
Mini SP500 daily chart | Support and Resistance Levels
Posted By:- Ilan Levy-Mayer Vice President, Cannon Trading Futures Blog
Jump to a section in this post:
1. Market Commentary
2. Support and Resistance Levels – S&P, Nasdaq, Dow Jones, Russell 2000
3. Support and Resistance Levels – Gold, Euro, Crude Oil, T-Bonds
4.Economic Reports for Tuesday, December 20 2011

1. Market Commentary
Front month for stock indices, currencies, grains and most active markets is now MARCH. Symbol for March is H
Gold and Crude front month is February.
If you are not sure which month you should be trading, please contact your broker.
We are now entering a period of the year when volume may be lower than normal. It will be more noticeable starting Friday Dec. 23rd as we will enter the holiday period of Christmas and New year.
Understand that lower volume can results some erratic moves at times and during other periods of the day can create “sleepy, slow ” type of trading.
Make sure you are aware of the trading schedule, reports times so you are not caught by surprise.
Happy Holidays and great trading, mini SP500 daily chart for your review below with possible levels of support and resistance
2. Support and Resistance Levels – S&P, Nasdaq, Dow Jones, Russell 2000
| Contract (Dec. 2011) | SP500 (big & Mini) |
Nasdaq100 (big & Mini) |
Dow Jones (big & Mini) |
Mini Russell |
| Resistance Level 3 | 1234.50 | 2277.67 | 11973 | 744.03 |
| Resistance Level 2 | 1226.50 | 2262.33 | 11912 | 735.67 |
| Resistance Level 1 | 1211.50 | 2233.67 | 11788 | 720.13 |
| Pivot Point | 1203.50 | 2218.33 | 11727 | 711.77 |
| Support Level 1 | 1188.50 | 2189.67 | 11603 | 696.23 |
| Support Level 2 | 1180.50 | 2174.33 | 11542 | 687.87 |
| Support Level 3 | 1165.50 | 2145.67 | 11418 | 672.33 |
3. Support & Resistance Levels for Gold, Euro, Crude Oil, and U.S. T-Bonds

4. Economic ReportsBuilding Permits
8:30amHousing Stats
8:30am
| Contract | Feb. Gold | Dec. Euro | Jan. Crude Oil | March. Bonds |
| Resistance Level 3 | 1624.9 | 1.3100 | 96.58 | 148 3/32 |
| Resistance Level 2 | 1617.1 | 1.3077 | 95.61 | 147 5/32 |
| Resistance Level 1 | 1605.0 | 1.3038 | 94.72 | 146 23/32 |
| Pivot Point | 1597.2 | 1.3015 | 93.75 | 145 25/32 |
| Support Level 1 | 1585.1 | 1.2976 | 92.86 | 145 11/32 |
| Support Level 2 | 1577.3 | 1.2953 | 91.89 | 144 13/32 |
| Support Level 3 | 1565.2 | 1.2914 | 91.00 | 143 31/32 |


