Futures Trading Levels for April 22nd, 2021

_________________________________________________

Voted #1 Blog and #1 Brokerage Services on TraderPlanet for 2016!!  

_________________________________________________

Like us on FaceBook!
Get Real Time updates and market alerts on Twitter!
Get Real Time updates and more on our private FB group!
Dear Traders,
Today’s action in Silver, gold, SP and NQ lead me to write the quick piece below.
Few words on BREAKOUT trading.
The concept is one of many different traders use.
Some like to use COUNTRER TREND trading.
others look at ORDER FLOW, some will use support and resistance mainly and hopefully more traders will master a few different techniques and use the appropriate one depending on the type of trading day that is developing in front of their eyes.
The concept of break out trading looks for the market to “snap out” of a certain trading range and continue moving in that direction. The toughest part is to filter out the “fake breakouts” and recognize early enough which breakouts have the potential to be a powerful one.
A few tips to explore:
Look for a breakout on a smaller time frame that will coincide with a longer time frame CURRENT trend. So you may look at a daily trend and look for a breakout on the hourly chart?
You may trade smaller time frames and look for breakouts that will coincide with the 30 minute chart time frame.
Last but not least ( for today only of course as I am sure there are MUCH more than the short few pointers I am sharing….) try utilizing different type of charts and do your homework in regards to which breakouts seem to work better than others. Look at RANGE BAR charts, explore VOLUME charts, maybe even take a look at Renko bars and other types as well.
30 MINUTES chart of ES below with 4 different pointers to look at, marked A through D. CLICK for larger IMAGE. ALWAYS much easier to look back in hindsight and explain what happened….I wish it was that easier when trading live….Click on the chart so you are able to read the pointers along with some insight for educational purposes.
210421EP E Mini S%26P 500 Equalized Active 30 Min Continuation
To access a free trial to the ALGOS shown in the chart along with other tools? (Slanted arrows possible buy, diamonds = possible exit/ tighten stops) visit and sign up for a free trial for 21 days with real-time data.

Good Trading

Trading Futures, Options on Futures, and retail off-exchange foreign currency transactions involves substantial risk of loss and is not suitable for all investors.  You should carefully consider whether trading is suitable for you in light of your circumstances, knowledge, and financial resources. You may lose all or more of your initial investment. Opinions, market data, and recommendations are subject to change at any time when it comes to Futures Trading.


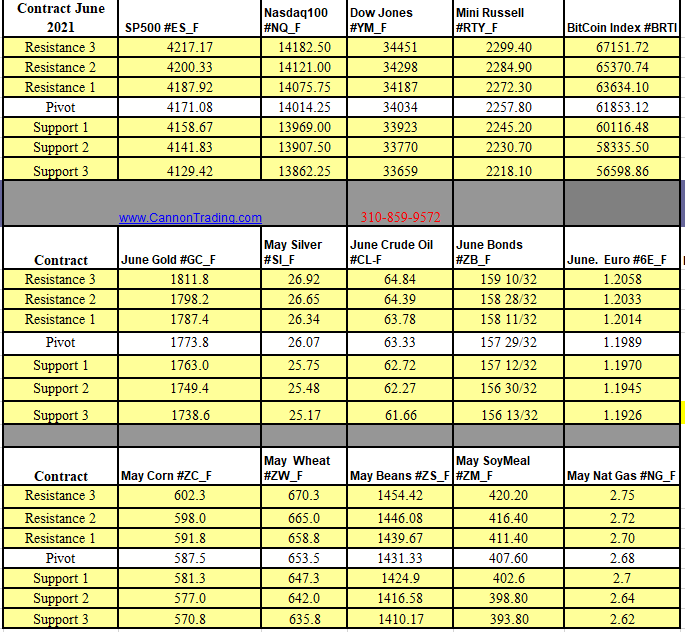
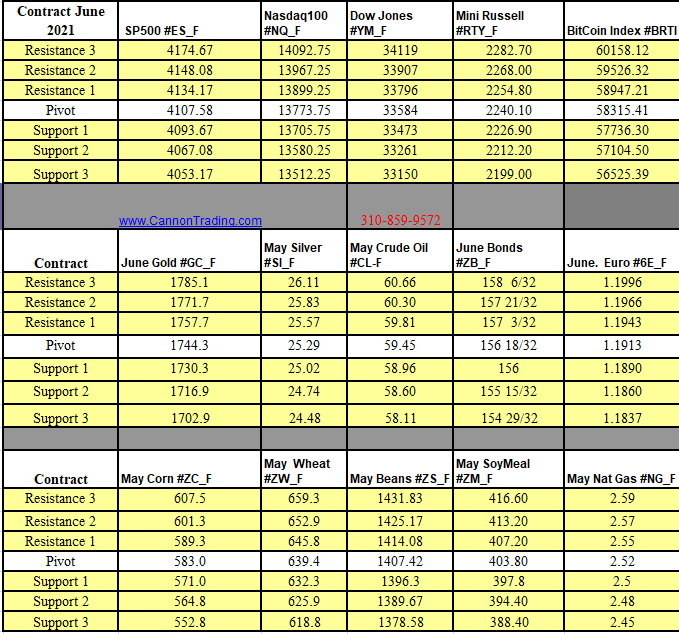
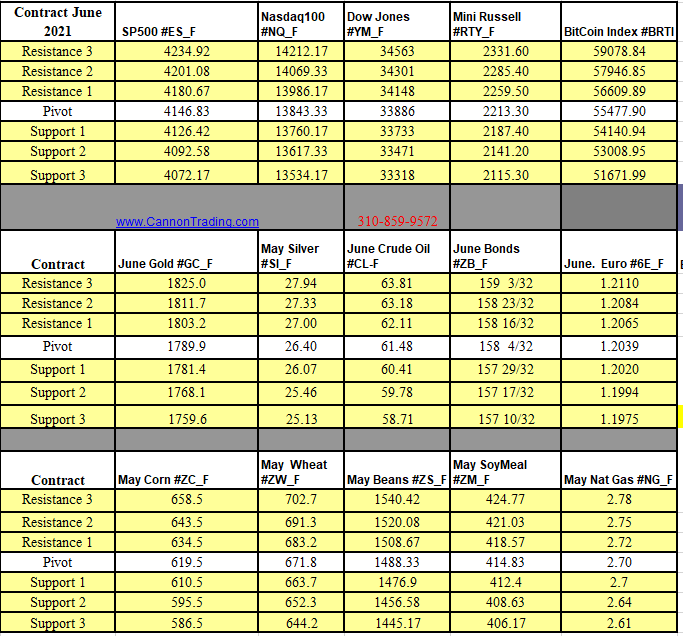
Futures Trading Levels

4-22-2021

cd7ef5a3 24a0 44cb aec6 76ba3670a6a1

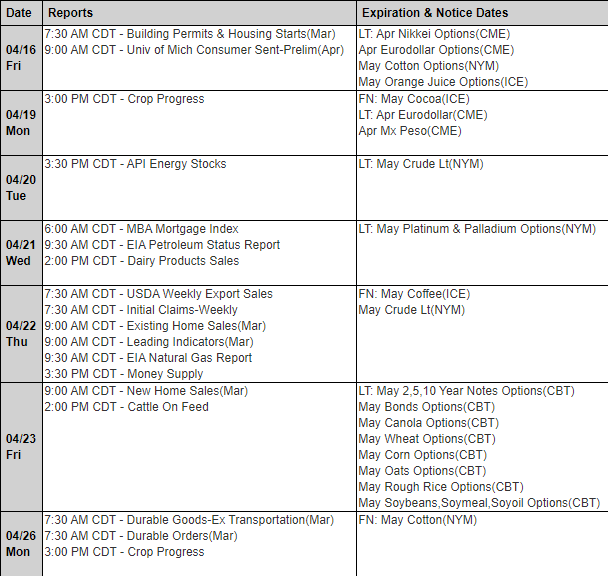
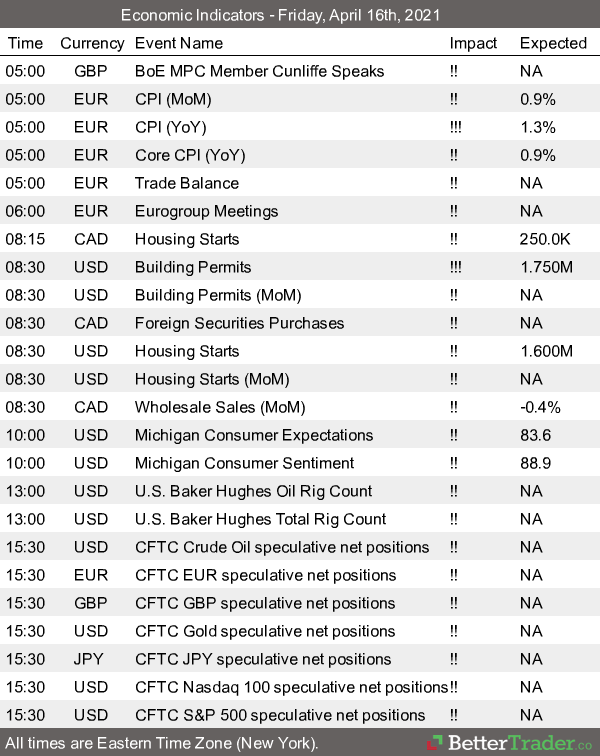
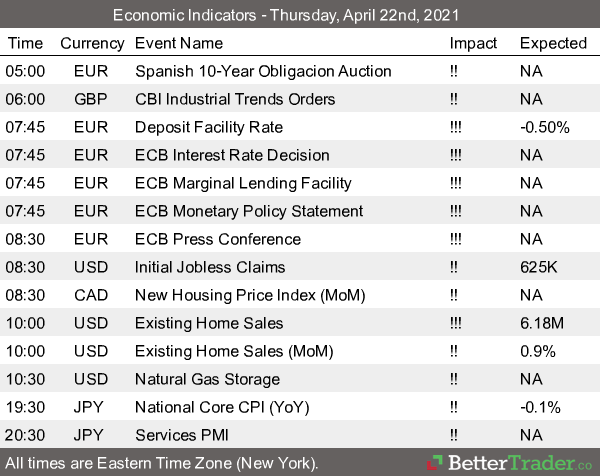
Economic Reports, source: 

 www.BetterTrader.co
 

cac45270 488d 4ad4 a941 0f4f55cfe297

This is not a solicitation of any order to buy or sell, but a current market view provided by Cannon Trading Inc. Any statement of facts here in contained are derived from sources believed to be reliable, but are not guaranteed as to accuracy, nor they purport to be complete. No responsibility is assumed with respect to any such statement or with respect to any expression of opinion herein contained. Readers are urged to exercise their own judgement in trading.

Trading the 30 Year Bonds In Place of the NQ? 30 Year Bond Chart for Review & Support and Resistance Levels 4.21.2021

_________________________________________________

Voted #1 Blog and #1 Brokerage Services on TraderPlanet for 2016!!  

_________________________________________________

Dear Traders,

Like us on FaceBook!
Get Real Time updates and market alerts on Twitter!
Get Real Time updates and more on our private FB group!
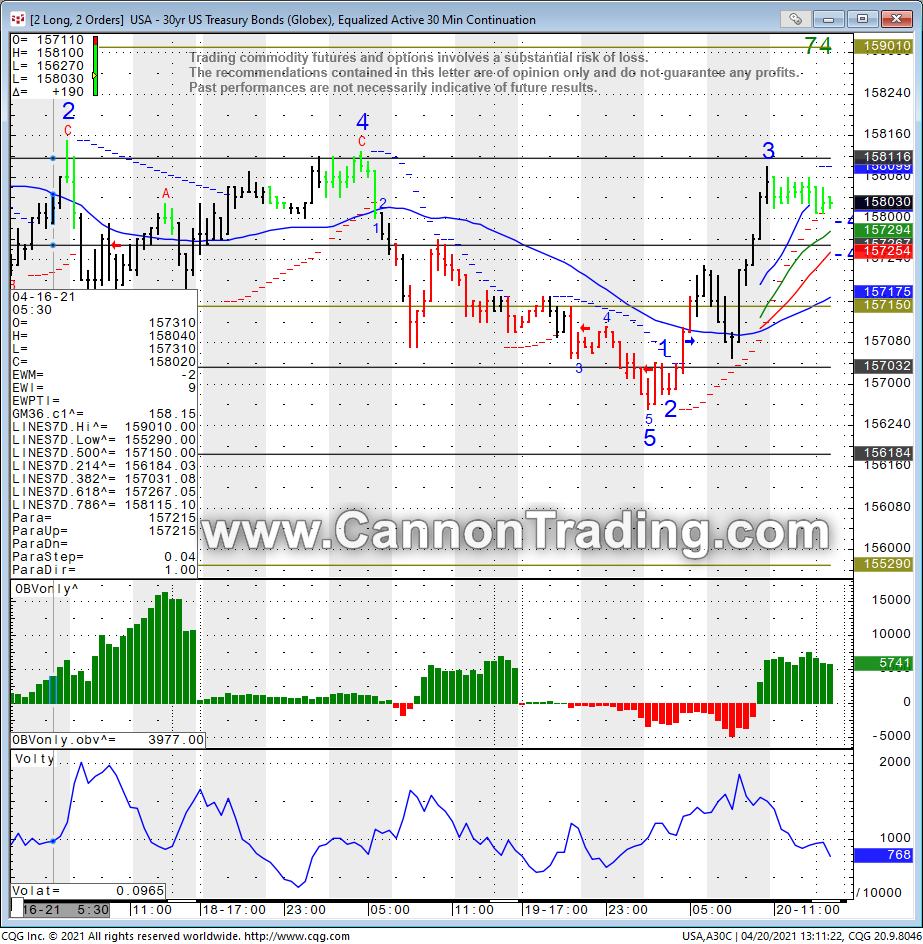
Spoke with a client today I have not spoken with in a while and was happy to hear from him that his own day trading improved once he SWITCHED over from NQ to ZB ( mini NASDAQ to T bonds).
Why am I happy you may ask?
  1. Always good to hear your clients trading is improving
  2. I am in believe that different markets are better for different traders and that it is worth while to explore other markets for trading. I personally like to mix and match 3-5 markets . Sometimes even moving from NQ to MNQ can help.
  3. When it comes to short term trading my favorites ( personally) are: ES/MES, MNQ ( I feel NQ can be too much at these price levels and you probably need $30k to day trade 1 NQ ), CL, GC, ZB, ZS
Here is something I wrote on bonds a while back and worth sharing:
Each market has a different personality, different behavior along with different times of the day when it is most active. If you are finding that the ES (mini SP) is not giving you enough OR too much risk/opportunities then start monitoring a couple of other markets and perhaps explore them in demo / simulated mode.
I think that there are more than a few markets that are suitable for day-trading. Below you will find some observations, tips along with what are unique about these markets, personality and most active trading hours (interest rates, mostly the ten year and 30 year).
In most platforms, the symbols are ZB for 30 year bonds and ZN for 10 year notes.
Product Symbol
ZB
Contract Size
The unit of trading shall be U.S. Treasury Bonds having a face value at maturity of one hundred thousand dollars ($100,000) or multiples thereof
Price Quotation
Points ($1,000) and 1/32 of a point. For example, 134-16 represents 134 16/32. Par is on the basis of 100 points.
Product Symbol
ZN
Underlying Unit
One U.S. Treasury note having a face value at maturity of $100,000.
Deliverable Grades
U.S. Treasury notes with a remaining term to maturity of at least six and a half years, but not more than 10 years, from the first day of the delivery month. The invoice price equals the futures settlement price times a conversion factor, plus accrued interest. The conversion factor is the price of the delivered note ($1 par value) to yield 6 percent.
Price Quote
Points ($1,000) and halves of 1/32 of a point. For example, 126-16 represents 126 16/32 and 126-165 represents 126 16.5/32. Par is on the basis of 100 points.
Tick Size
(minimum fluctuation)
One-half of one thirty-second (1/32) of one point ($15.625, rounded up to the nearest cent per contract), except for intermonth spreads, where the minimum price fluctuation shall be one-quarter of one thirty-second of one point ($7.8125 per contract).
Contract Months
The first five consecutive contracts in the March, June, September, and December quarterly cycle.
These contracts are often affected by many of the economic reports that come out at 8:30 AM Eastern and there is very active volume between the hours of 8 AM EST and 3 PM EST
Volume on both contracts is very good. Ten years will often have 1 million contracts traded per day (might be the second most active US futures market after the mini SP 500) and the bonds will avg. around 300,000 contracts.
These markets can experience very volatile movements during and right after different reports but then will often trade smooth or in an intraday trend the rest of the day.
30 MINUTES chart of ZB ( t-bond futures) for your review below
30 Year Bond Futures Chart
To access a free trial to the ALGOS shown in the chart along with other tools? (Slanted arrows possible buy, pink squares = possible exit/ tighten stops) visit and sign up for a free trial for 21 days with real-time data.

Good Trading

Trading Futures, Options on Futures, and retail off-exchange foreign currency transactions involves substantial risk of loss and is not suitable for all investors.  You should carefully consider whether trading is suitable for you in light of your circumstances, knowledge, and financial resources. You may lose all or more of your initial investment. Opinions, market data, and recommendations are subject to change at any time when it comes to Futures Trading.


Futures Trading Levels

4-21-2021

c

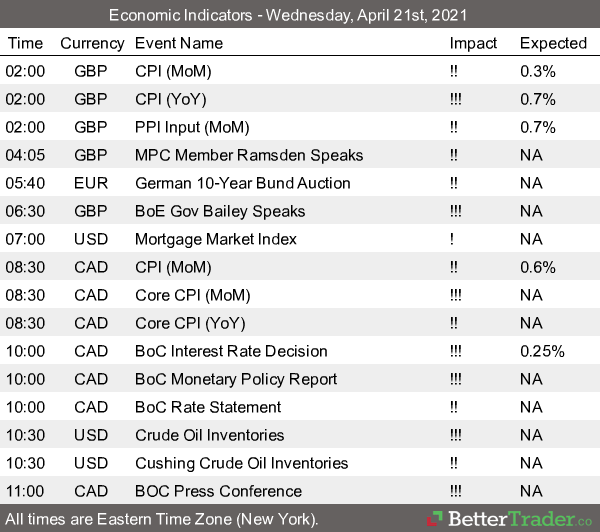
Economic Reports, source: 

 www.BetterTrader.co

b3289aae 7d19 4d06 b355 264ab6f310b5


This is not a solicitation of any order to buy or sell, but a current market view provided by Cannon Trading Inc. Any statement of facts here in contained are derived from sources believed to be reliable, but are not guaranteed as to accuracy, nor they purport to be complete. No responsibility is assumed with respect to any such statement or with respect to any expression of opinion herein contained. Readers are urged to exercise their own judgement in trading.
Bitcoin Driving Force? BRTI Chart for Review & Trading Levels 4.20.2021

_________________________________________________

Voted #1 Blog and #1 Brokerage Services on TraderPlanet for 2016!!  

_________________________________________________

Dear Traders,

Like us on FaceBook!
Get Real Time updates and market alerts on Twitter!
Get Real Time updates and more on our private FB group!
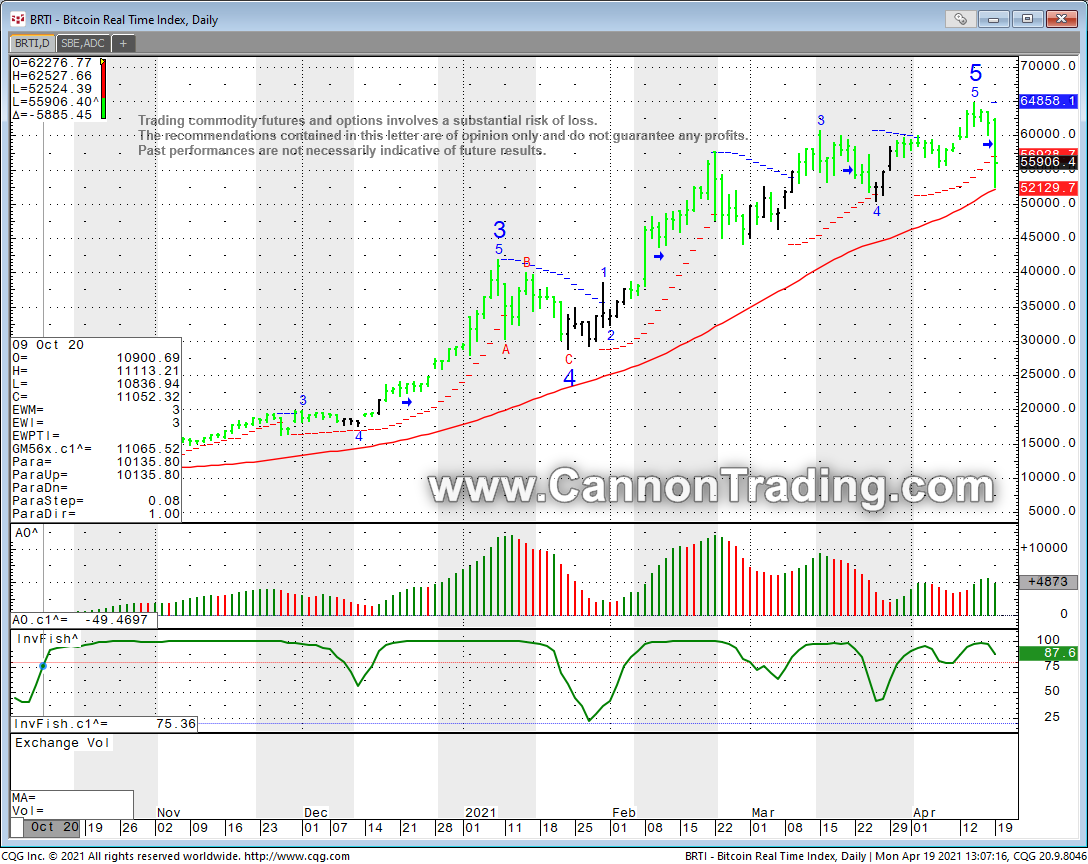
Bitcoin seem to be the driving force behind some of the moves to start the week…..
Daily chart of the BRTI, the index of Bitcoin below for your review.
Notice the Index tested major support level ( red line) and for NOW was able to bounce of it…..
MICRO bitcoin futures contracts are coming soon!! May 3rd. We will send more info before hand but feel free to reach out to your cannon broker/ contact if you have any questions.
Bircoin Futures Daily Chart
To access a free trial to the ALGOS shown in the chart along with other tools? (Slanted arrows possible buy, pink squares = possible exit/ tighten stops) visit and sign up for a free trial for 21 days with real-time data.

Good Trading

Trading Futures, Options on Futures, and retail off-exchange foreign currency transactions involves substantial risk of loss and is not suitable for all investors.  You should carefully consider whether trading is suitable for you in light of your circumstances, knowledge, and financial resources. You may lose all or more of your initial investment. Opinions, market data, and recommendations are subject to change at any time when it comes to Futures Trading.


Futures Trading Levels

4-20-2021

0998a4ad 5f87 4327 9b49 df31fcb5b73a

Economic Reports, source: 

 www.BetterTrader.co

64c188f2 f006 433f 8947 dd2b34464b50


This is not a solicitation of any order to buy or sell, but a current market view provided by Cannon Trading Inc. Any statement of facts here in contained are derived from sources believed to be reliable, but are not guaranteed as to accuracy, nor they purport to be complete. No responsibility is assumed with respect to any such statement or with respect to any expression of opinion herein contained. Readers are urged to exercise their own judgement in trading.
Weekly Newsletter – Trading Resources and more! 4.19.2021

_________________________________________________

Voted #1 Blog and #1 Brokerage Services on TraderPlanet for 2016!!  

_________________________________________________

Dear Traders,

Get Real Time updates and more on our private FB group!
Trading 202: Futures Options Writing
Have you ever wondered who sells the futures options that most people buy?
These people are known as the option writers/sellers. Their sole objective is to collect the premium paid by the option buyer. Option writing can also be used for hedging purposes and reducing risk. An option writer has the exact opposite to gain as the option buyer. The writer has unlimited risk and a limited profit potential, which is the premium of the option minus commissions. When writing naked futures options your risk is unlimited, without the use of stops. This is why we recommend exiting positions once a market trades through an area you perceived as strong support or resistance. So why would anyone want to write an option?
Here are a few reasons:
  1. Most futures options expire worthless and out of the money. Therefore, the option writer is collecting the premium the option buyer paid.
  2. There are three ways to win as an option writer. A market can go in the direction you thought, it can trade sideways and in a channel, or it can even go slowly against you but not through your strike price. The advantage is time decay.
  3. The writer believes the futures contract will not reach a certain strike price by the expiration date of the option. This is known as naked option selling.
  4. To hedge against a futures position. For example: someone who goes long cocoa at 850 can write a 900 strike price call option with about one month of time until option expiration. This allows you to collect the premium of the call option if cocoa settles below 900, based on option expiration. It also allows you to make a profit on the actual futures contract between 851 and 900. This strategy also lowers your margin on the trade and should cocoa continue lower to 800, you at least collect some premium on the option you wrote. Risk lies if cocoa continues to decline because you only collect a certain amount of premium and the futures contract has unlimited risk the lower it goes.
To read the rest of the article as well as power point presentation along with a summary table instantly
NQ vs. ES DAILY SPREAD chart. Click for larger image.
I have been asked by clients over the years: “What other angles are there for short term trading?” The answer I normally give is that there are many different ways to trade and one has to find what works for him/ her based on time/ personality/ risk capital and more. That being said, I feel that spreads are often ignored and more traders should explore spreads on a few different levels:
  1. Longer term, perhaps seasonal
  2. Day trading/ swing trading, looking for the strength or weakness of one sector versus the other. Gold vs. Silver, Hogs vs. cattle, mini Russel versus mini Dow, heating oil vs unleaded gas, SP vs NQ and more. Certain spreads have specific ratios for them to work and the field of spreads can not be learned overnight and requires effort, time and studying.
210408 EP E Mini S&P 500 Weekly Continuation
To access a free trial to the ALGOS shown in the chart along with other tools? (Slanted arrows possible buy, pink squares = possible exit/ tighten stops) visit and sign up for a free trial for 21 days with real-time data.

Good Trading

Trading Futures, Options on Futures, and retail off-exchange foreign currency transactions involves substantial risk of loss and is not suitable for all investors.  You should carefully consider whether trading is suitable for you in light of your circumstances, knowledge, and financial resources. You may lose all or more of your initial investment. Opinions, market data, and recommendations are subject to change at any time when it comes to Futures Trading.


Futures Trading Levels

4-19-2021

7553a31e e779 4d3d ae3a c048a2f99f0d

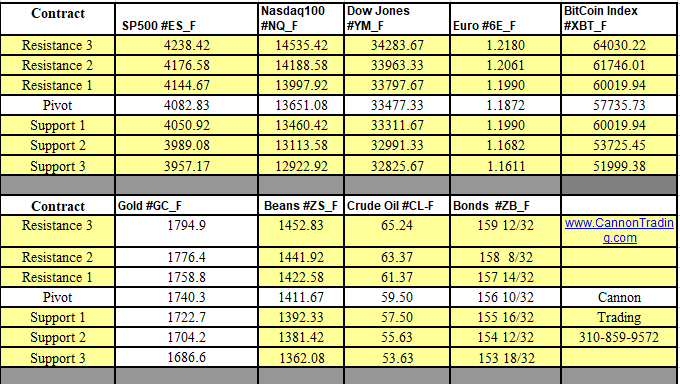
Weekly Levels8a2d8aab 4510 45fa af43 3a5b3918b152

Economic Reports, source: 

 www.BetterTrader.co

675c4b09 80b6 40da 909a 292f79247a46


This is not a solicitation of any order to buy or sell, but a current market view provided by Cannon Trading Inc. Any statement of facts here in contained are derived from sources believed to be reliable, but are not guaranteed as to accuracy, nor they purport to be complete. No responsibility is assumed with respect to any such statement or with respect to any expression of opinion herein contained. Readers are urged to exercise their own judgement in trading.
Stock Index Futures Climb Higher, ES Chart Review & Support and Resistance Levels 4.16.2021

_________________________________________________

Voted #1 Blog and #1 Brokerage Services on TraderPlanet for 2016!!  

_________________________________________________

Dear Traders,

Like us on FaceBook!
Get Real Time updates and market alerts on Twitter!
Get Real Time updates and more on our private FB group!
Stock index futures continue to climb higher.
The speed of the move and the slope of the move starting to slow down…..
Next objective S&P’S is 4205.
However, If S&P’s relax, we could retrace back
to 4102.00. Then 4088.75 becomes SUPPORT. Finally, 4079 must HOLD.
A CLOSE below neutralizes the SECULAR BULL TREND.
Last SUPPORT is 4068.00.
The market speed, intraday behavior, volatility and more are MUCH different than what we saw prior to Good Friday. Almost as if someone flipped the switch….
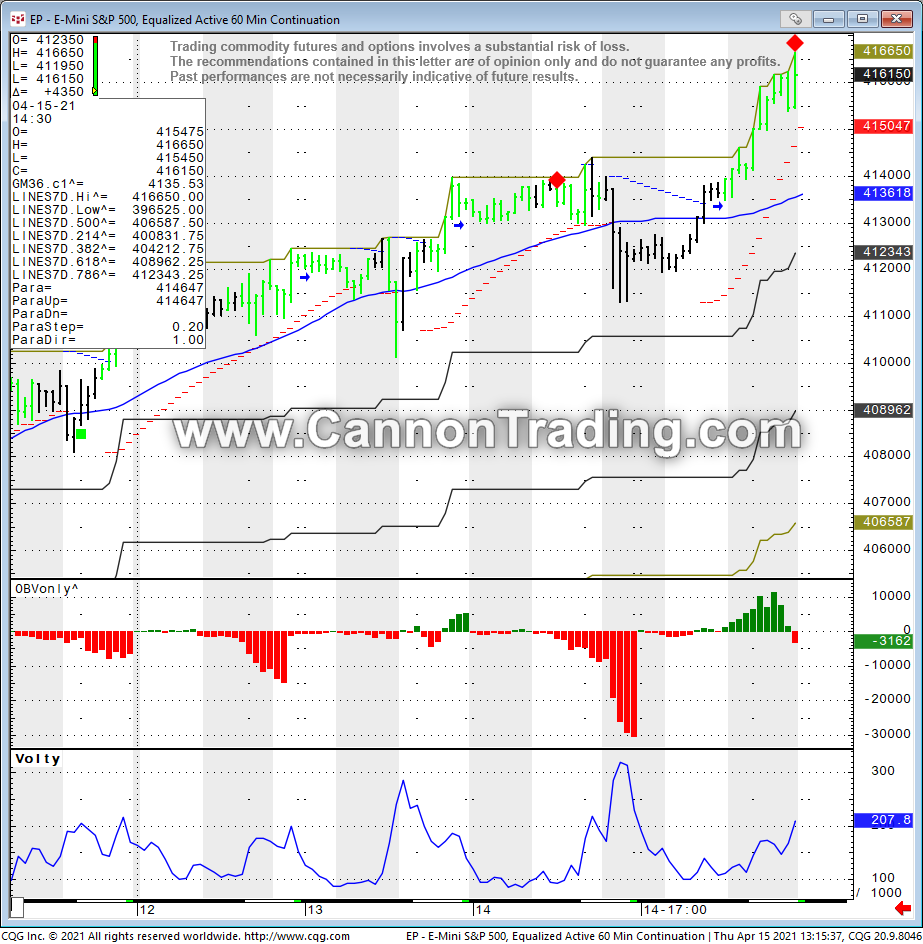
Hourly SP500 chart for your review below, notice no “red bars”, mostly signals of trend resuming ( blue arrows) with a couple of possible “profit taking” in the form of red diamonds…..:
Mini ES (S&P) 60 Minute Chart
To access a free trial to the ALGOS shown in the chart along with other tools? (Slanted arrows possible buy, pink squares = possible exit/ tighten stops) visit and sign up for a free trial for 21 days with real-time data.

Good Trading

Trading Futures, Options on Futures, and retail off-exchange foreign currency transactions involves substantial risk of loss and is not suitable for all investors.  You should carefully consider whether trading is suitable for you in light of your circumstances, knowledge, and financial resources. You may lose all or more of your initial investment. Opinions, market data, and recommendations are subject to change at any time when it comes to Futures Trading.


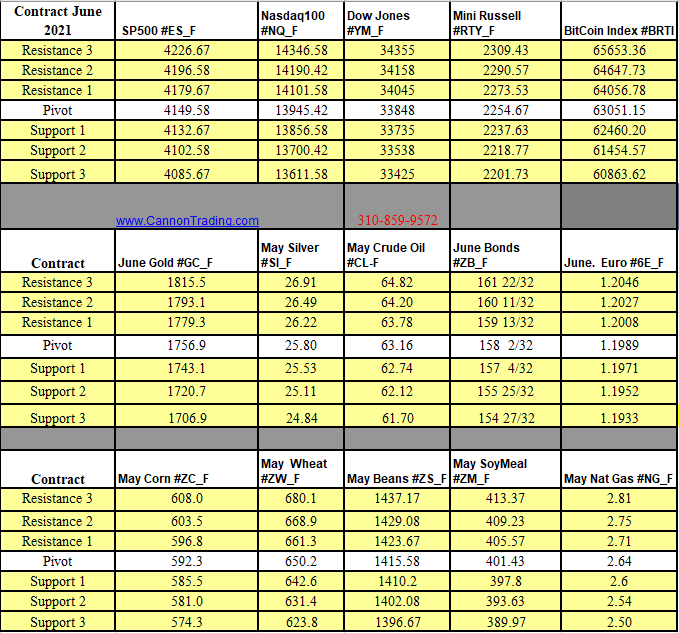
Futures Trading Levels

4-16-2021

f87dc177 1d84 4f81 9cbf 4e0f5f35a041

Economic Reports, source: 

 www.BetterTrader.co

a3ab0417 3fe6 4705 b2d7 f5fceb26cd26


This is not a solicitation of any order to buy or sell, but a current market view provided by Cannon Trading Inc. Any statement of facts here in contained are derived from sources believed to be reliable, but are not guaranteed as to accuracy, nor they purport to be complete. No responsibility is assumed with respect to any such statement or with respect to any expression of opinion herein contained. Readers are urged to exercise their own judgement in trading.
One Way to Eliminate Fear and Greed While Day Trading & Futures Trading Levels 4.15.2021

_________________________________________________

Voted #1 Blog and #1 Brokerage Services on TraderPlanet for 2016!!  

_________________________________________________

Dear Traders,

Like us on FaceBook!
Get Real Time updates and market alerts on Twitter!
Get Real Time updates and more on our private FB group!
One Way to Eliminate Fear and Greed While Day Trading
Disclaimer
The methods described in this article are for educational purposes only. Past results are not necessarily indicative of future results. The author and the publisher assume no responsibility for your trading results. Trading involves a high degree of risk. No recommendation is being made to buy any stock, commodity, option or other financial instrument. Consult your financial advisor before starting any investment system.
It is a known fact that fear and greed can be a trader’s worst enemies.
I’ve found one way that has helped some clients deal with fear and greed and their cousin, “getting out of winners too soon and staying in losers too long.”
What is it?
Entering multiple contracts. Now with the MICROS, this trading approach is more feasible for many more traders than before.
Entering Multiple Contracts: Philosophy
In order to enter multiple contracts while day trading, one has to have the appropriate risk capital and margin requirements. But the advantage of trading more than one “unit” or splitting your trading size into two or more parts is as such:
If you enter a trade with one contract (or if you are treating your trading size as one unit, meaning you enter a trade with 4 contracts and exit the trade with 4 contracts), you can face a very quick dilemma, especially when day-trading. Consider the two following scenarios:
1. You get in and very quickly you are up 2 mini SP points…what do you do? Do you take profit? Bring your stop loss closer? How do you avoid getting out too early or too late?
2. You enter a trade and it goes against you rather quickly…if you get out then it is a loser…but the little voice in your head says “what if the market goes back up?”
In the first case scenario, when market decided to be nice to us and moved in our direction, I like to exit half of my positions relatively quickly. In the case of the mini SP, this would be around 11 ticks profit.
What I’ve found is that this will allow me to manage the rest of the trade in a much more relaxed manner. Since I’ve already locked profits in, now I can look for a proper stop close to my break-even level. I can analyze my next target more realistically and, if the market provides room for additional gains, be there to participate.
In the second case scenario, I can choose to risk a smaller amount or use a tight stop on the first half of my position and a bit wider stop on the other half of the position. This can help prevent the scenario when one does not get out of a trade because mentally one does not want to accept the loss.
Of course, there is much more to trading and day trading. Entry signals, exit techniques, why and when to get in a trade, and so on — all of these are key.
But I hope that this tip will assist you while trading and will prevent some of the instances where you get out of a trade too late or too early.

Good Trading

Trading Futures, Options on Futures, and retail off-exchange foreign currency transactions involves substantial risk of loss and is not suitable for all investors.  You should carefully consider whether trading is suitable for you in light of your circumstances, knowledge, and financial resources. You may lose all or more of your initial investment. Opinions, market data, and recommendations are subject to change at any time when it comes to Futures Trading.


Futures Trading Levels

4-15-2021

e9798c69 5984 444a 9dce 86532b9c5f65

Economic Reports, source: 

 www.BetterTrader.co

7ec154a7 1508 4c19 ba2b 07fde668dcb7


This is not a solicitation of any order to buy or sell, but a current market view provided by Cannon Trading Inc. Any statement of facts here in contained are derived from sources believed to be reliable, but are not guaranteed as to accuracy, nor they purport to be complete. No responsibility is assumed with respect to any such statement or with respect to any expression of opinion herein contained. Readers are urged to exercise their own judgement in trading.
Futures Support and Resistance Levels 4.13.2021

_________________________________________________

Voted #1 Blog and #1 Brokerage Services on TraderPlanet for 2016!!  

_________________________________________________

Dear Traders,

Like us on FaceBook!
Get Real Time updates and market alerts on Twitter!
Get Real Time updates and more on our private FB group!
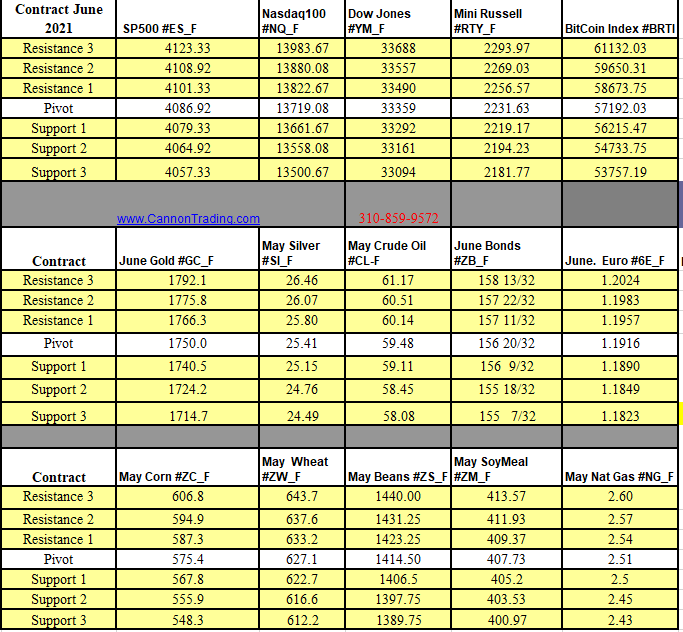
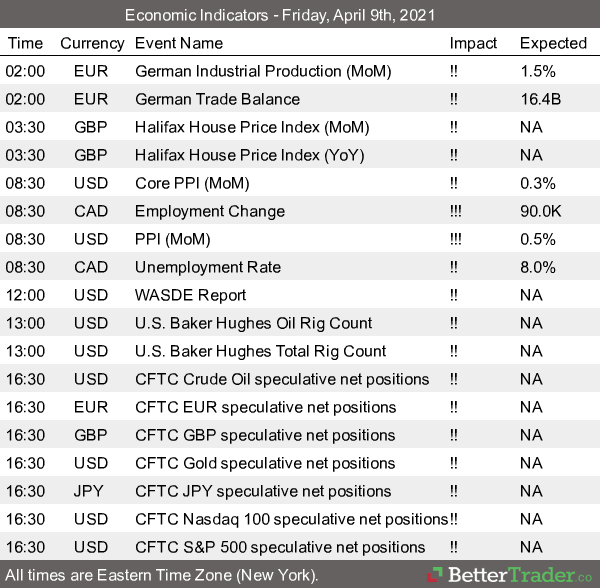
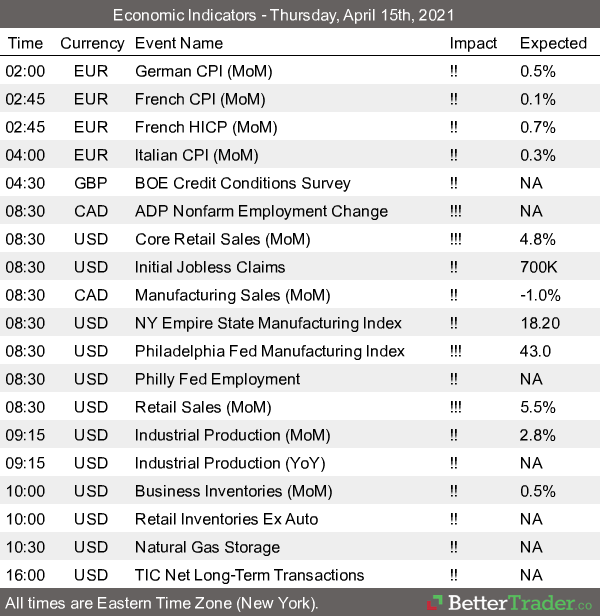
No commentary today – just levels and reports below to help you plan better for the next trading day!

Good Trading

Trading Futures, Options on Futures, and retail off-exchange foreign currency transactions involves substantial risk of loss and is not suitable for all investors.  You should carefully consider whether trading is suitable for you in light of your circumstances, knowledge, and financial resources. You may lose all or more of your initial investment. Opinions, market data, and recommendations are subject to change at any time when it comes to Futures Trading.


Futures Trading Levels

4-14-2021

6fea76b2 6559 491b 9da1 ea73dc7206d3

Economic Reports, source: 

 www.BetterTrader.co


ae3c8c87 75ad 4314 a611 38d9fc3781b8

This is not a solicitation of any order to buy or sell, but a current market view provided by Cannon Trading Inc. Any statement of facts here in contained are derived from sources believed to be reliable, but are not guaranteed as to accuracy, nor they purport to be complete. No responsibility is assumed with respect to any such statement or with respect to any expression of opinion herein contained. Readers are urged to exercise their own judgement in trading.

Short Trading Videos and Futures Support and Resistance Levels 4.13.2021

_________________________________________________

Voted #1 Blog and #1 Brokerage Services on TraderPlanet for 2016!!  

_________________________________________________

Dear Traders,

Like us on FaceBook!
Get Real Time updates and market alerts on Twitter!
Get Real Time updates and more on our private FB group!
Some nice short videos on different trading techniques one can explore at:
·    Ever wondered when to exit a trade? Take a look at what Ilan has to share on Bollinger Bands and a study called PARABOLICS
·    Some common uses you can make of support and resistance levels.
·    Filter out the noise with range bar charts
·    “Price Confirmation”
To access a free trial to the ALGOS shown in the videos along with other tools? (Slanted arrows possible buy, pink squares = possible exit/ tighten stops) visit and sign up for a free trial for 21 days with real-time data.

Good Trading

Trading Futures, Options on Futures, and retail off-exchange foreign currency transactions involves substantial risk of loss and is not suitable for all investors.  You should carefully consider whether trading is suitable for you in light of your circumstances, knowledge, and financial resources. You may lose all or more of your initial investment. Opinions, market data, and recommendations are subject to change at any time when it comes to Futures Trading.


Futures Trading Levels

4-13-2021

c93339dd bb23 459c 984c 914790d6361c

Economic Reports, source: 

 www.BetterTrader.co


6d9ea729 05dd 49ab bf0e 2a5139ae1537

This is not a solicitation of any order to buy or sell, but a current market view provided by Cannon Trading Inc. Any statement of facts here in contained are derived from sources believed to be reliable, but are not guaranteed as to accuracy, nor they purport to be complete. No responsibility is assumed with respect to any such statement or with respect to any expression of opinion herein contained. Readers are urged to exercise their own judgement in trading.
Weekly Newsletter #1046 Commitment of Traders Report PDF., ES Market Review & Trading Levels 4.10.2021

Cannon Futures Weekly Newsletter Issue # 1046

Dear Traders,

Like us on FaceBook!
Get Real Time updates and market alerts on Twitter!
Get Real Time updates and more on our private FB group!
Trading 102: Commitment of Traders Report – What Lies beneath
Commitment of Traders Report – COT
Commitment of Traders Report offers wealth of data when it comes to commodity and futures trading. You can somewhat say, this is a window into what the “big boys are doing” which is published weekly.
In this 24 page PDF booklet, Gary Kamen of Trends in Futures reviews the commitment of traders report, what it means, how traders can utilize it and much more.
Sign up and instantly download the booklet and learn about:
* History of the COT report
* Why is this report important?
* The new COT report
* How can you use the information in this report?
* And much more….
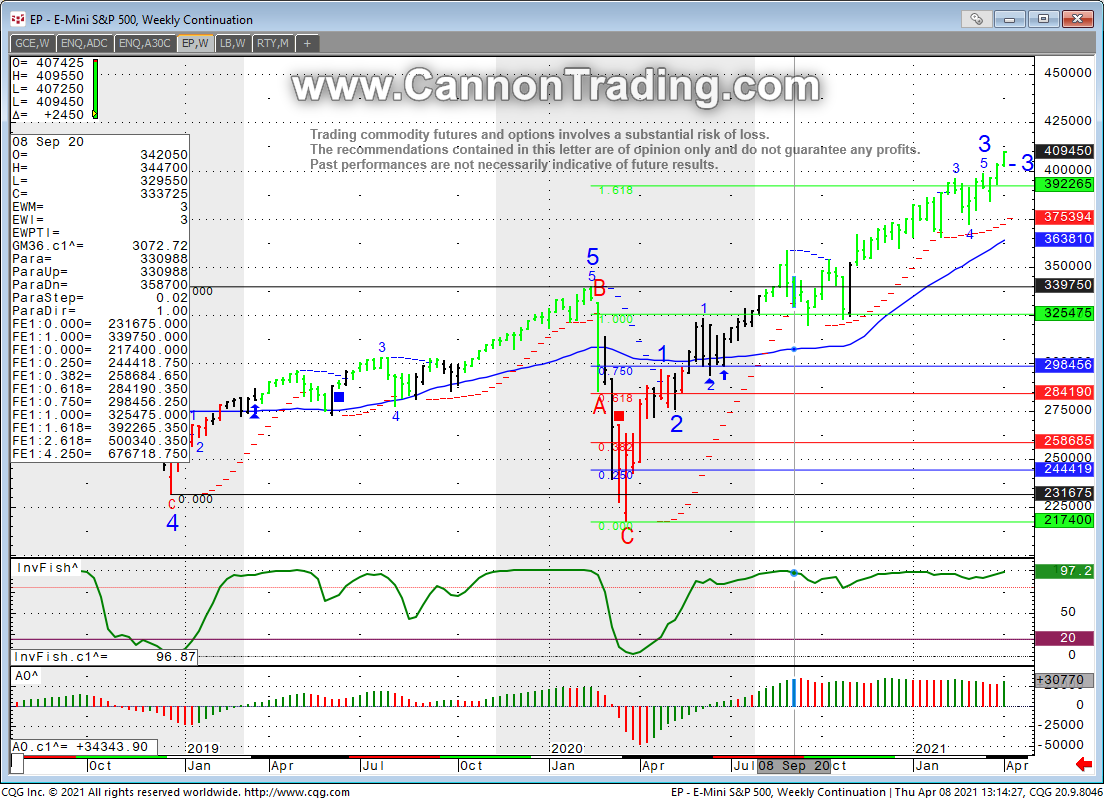
ES WEEKLY chart for your review. Click for larger image. New all time highs fueled by FED QE.
Next targets? Levels of support? will this past week slow price action continue or will the “speedy price action ” of weeks before return?
M S&P’s ( June mini SP 500)
4,101 OBJECTIVE has been met.
Market could have a retracement back
to 4075.00.
Next test area is 4145.00
No two Bull or Bear markets are alike. This pandemic is similar to 1918 (post WW1), which originated in China, unfortunately killing 50 million globally. The pent up demand led to the Roaring 20’s, which is the cycle we’re presently in. With the FED all in with unprecedented stimulus, we could see a 8-9% GDP number!
Q.E. is $120 billion a month, coupled
with the 3 stimulus packages and the new $2.2 trillion infrastructure in the pipeline. Also, the FED is allowing inflation to run hot, above their 2% target, using a weak US$, as its main catalyst. Lastly, the SHORT END may remain untouched for 2 years.
Eventually, the FED will lose control of the LONG END of the curve!
Future CAVEAT, is that we all know how the Roaring 20’s ended on Oct. 29, 1929.
Mini S&P ES Weekly Chart
Good Trading

Trading Futures, Options on Futures, and retail off-exchange foreign currency transactions involves substantial risk of loss and is not suitable for all investors.  You should carefully consider whether trading is suitable for you in light of your circumstances, knowledge, and financial resources. You may lose all or more of your initial investment. Opinions, market data, and recommendations are subject to change at any time when it comes to Futures Trading.


Futures Trading Levels

4-12-2021

f65e52f0 dcbf 4eda 836f 2f682f64548d


Weekly Levels

37d7c356 b311 4c3d bbce 1be38c1d9725

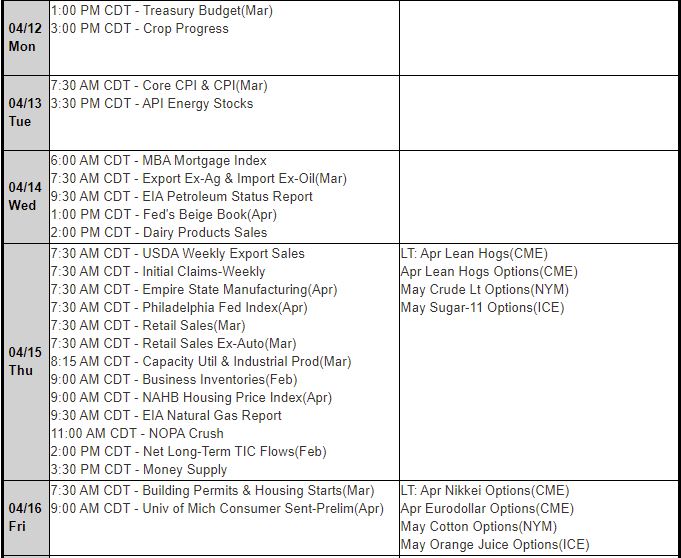
Reports, First Notice (FN), Last trading (LT) Days for the Week:

https://mrci.com

Date Reports/Expiration Notice Dates

MRCI Reports

This is not a solicitation of any order to buy or sell, but a current market view provided by Cannon Trading Inc. Any statement of facts herein contained are derived from sources believed to be reliable but are not guaranteed as to accuracy, nor they purport to be complete. No responsibility is assumed with respect to any such statement or with respect to any expression of opinion herein contained. Readers are urged to exercise their own judgment in trading

SP500 Makes an All Time High w/ Chart & Support and Resistance Levels 4.09.2021

_________________________________________________

Voted #1 Blog and #1 Brokerage Services on TraderPlanet for 2016!!  

_________________________________________________

Dear Traders,

Like us on FaceBook!
Get Real Time updates and market alerts on Twitter!
Get Real Time updates and more on our private FB group!
And just like that…..Sp500 Futures made an all-time high.
The stimulus by the FED is the driving force….
Below is what I PERSONALLY consider valuable insight every morning by our friend, Al Bicoff. This was posted this morning on our FB group at https://www.facebook.com/groups/1105191589938254 :
GOOD MORNING.
We discussed these scenarios last month. HISTORY can repeat itself.
No two Bull or Bear markets are alike. This pandemic is similar to 1918 (post WW1), which originated in China, unfortunately killing 50 million globally. The pent up demand led to the Roaring 20’s, which is the cycle we’re presently in. With the FED all in with unprecedented stimulus, we could see a 8-9% GDP number!
Q.E. is $120 billion a month, coupled
with the 3 stimulus packages and the new $2.2 trillion infrastructure in the pipeline. Also, the FED is allowing inflation to run hot, above their 2% target, using a weak US$, as its main catalyst. Lastly, the SHORT END may remain untouched for 2 years.
Eventually, the FED will lose control of the LONG END of the curve!
Future CAVEAT, is that we all know how the Roaring 20’s ended on Oct. 29, 1929.
M S&P’s objective is 4,101 until a close
below 4023.50 occurs.
M DOW 35,000
WEEKLY mini SP chart for your review below.
Sp500 Futures Mini S&P, ES Weekly Chart
To access a free trial to the ALGOS shown in the chart along with other tools? (Slanted arrows possible buy, pink squares = possible exit/ tighten stops) visit and sign up for a free trial for 21 days with real-time data.

Good Trading

Sp500 Futures, Options on Futures, and retail off-exchange foreign currency transactions involves substantial risk of loss and is not suitable for all investors.  You should carefully consider whether trading is suitable for you in light of your circumstances, knowledge, and financial resources. You may lose all or more of your initial investment. Opinions, market data, and recommendations are subject to change at any time when it comes to Futures Trading.


Futures Trading Levels

4-09-2021

3be103c5 f21e 4381 86ad 9dd391ecd20f

Economic Reports, source: 

 www.BetterTrader.co

b35371b4 ca45 4700 bbf1 2c8f9cd5e96b


This is not a solicitation of any order to buy or sell, but a current market view provided by Cannon Trading Inc. Any statement of facts here in contained are derived from sources believed to be reliable, but are not guaranteed as to accuracy, nor they purport to be complete. No responsibility is assumed with respect to any such statement or with respect to any expression of opinion herein contained. Readers are urged to exercise their own judgement in trading.