Choppy Markets Today, (Tomorrow?) Ahead of CPI + Futures Trading Levels for 04.09.2024

Get Real Time updates and more by joining our Private Facebook Group!
Subscribe to our YouTube Channel


C39


Markets Heat up MidWeek

by John Thorpe, Senior Broker


CPI Report Wednesday

The CPI report for March 2024 will be released by the Bureau of Labor Statistics on Monday at 7:30 a.m. CDT. As of February’s CPI report, annual inflation is 3.2%, or 3.8% excluding food and energy. That data compares with the FOMC’s annual inflation target of 2%.

What To Expect

These data set move the Equity, Bond, Metals and currency markets the most as the market drivers are directly related to what the FED will do next with Interest rates this summer. Provided inflation comes at a monthly rate close to 0.3% or lower for March, that should be sufficient for the FOMC to keep its plan to start cutting interest rates this summer. If the report shows a 0.4% monthly increase or greater, that would be a concern. It would suggest relatively high inflation readings seen in January, and to a lesser extent in February, are perhaps more of a trend. Here is your BLS CPI Data center https://www.bls.gov/cpi/

Monthly inflation at or below 0.2% would generally be considered positive news, perhaps giving more conviction to rate cutting plans. Still the CPI release is just one data point that the Fed will use to assess how inflation is trending. The FOMC will also keep a close eye on the jobs market, which so far has been strong enough to enable the Fed to be patient in considering interest rate cuts. A slowdown in job growth might matter for the Fed’s plans as much as upcoming inflation data releases.


96e42ebd 7d12 4d66 9991 767f68bdc10a


stars

e35cb555 9ff3 4f00 9fe8 0655b28fbd90

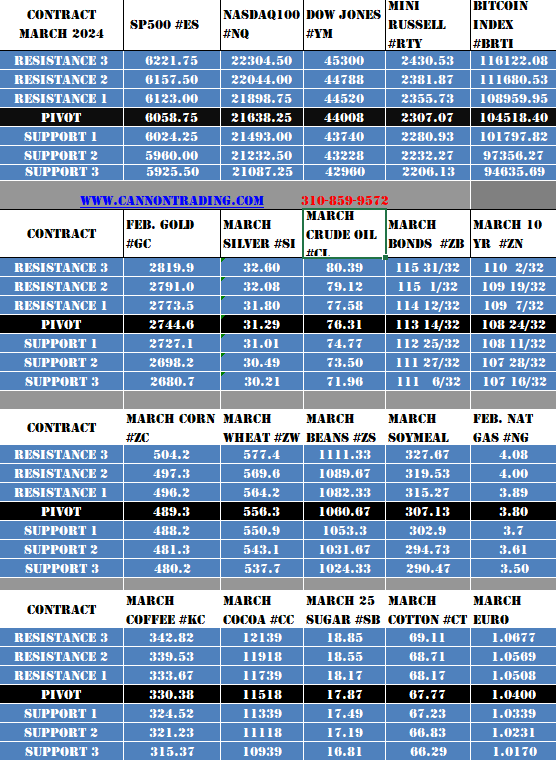
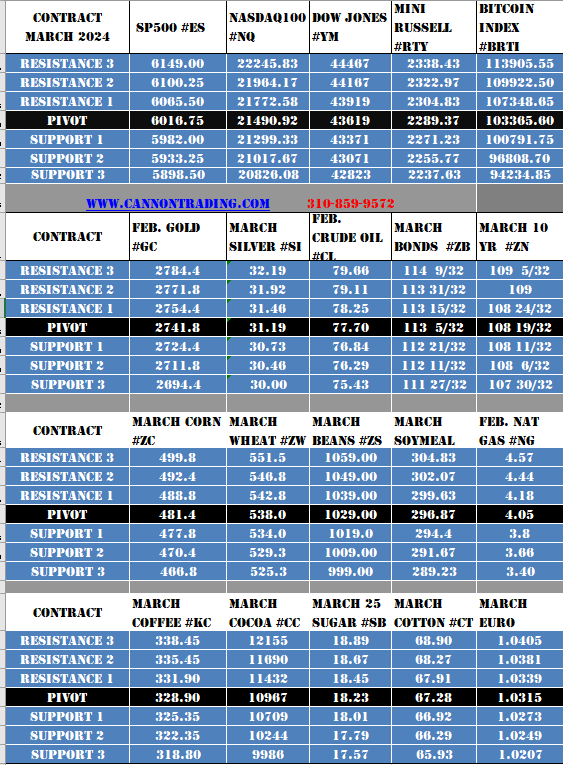
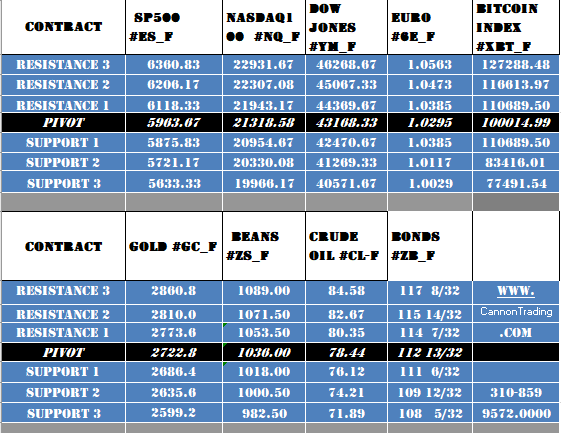
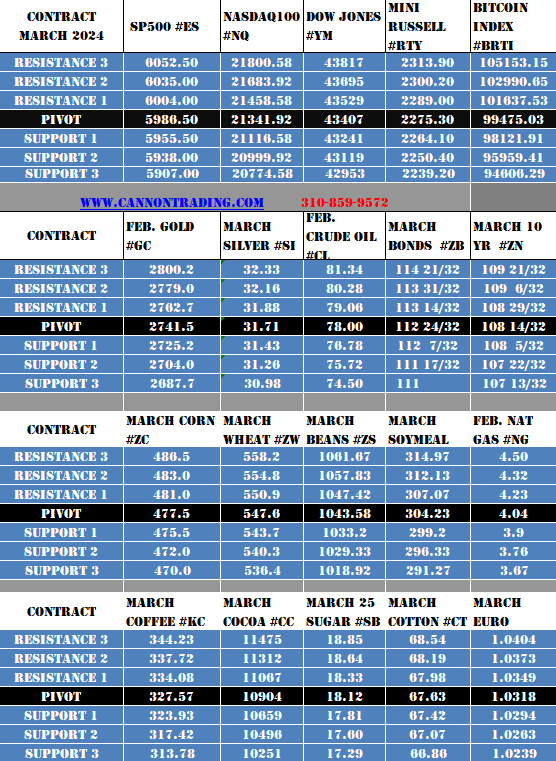
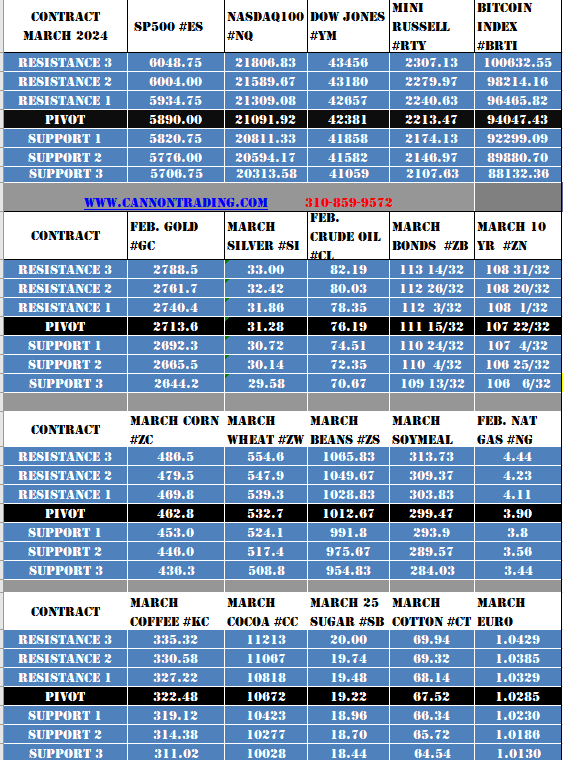
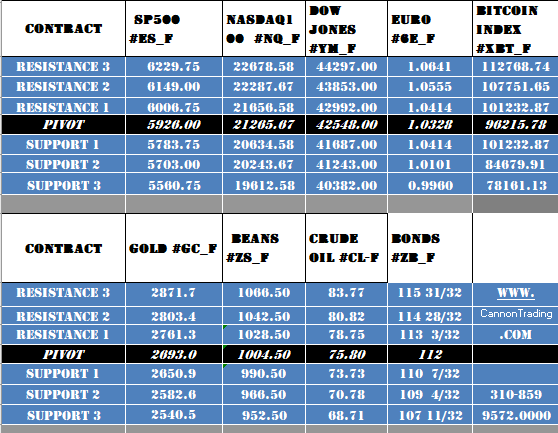
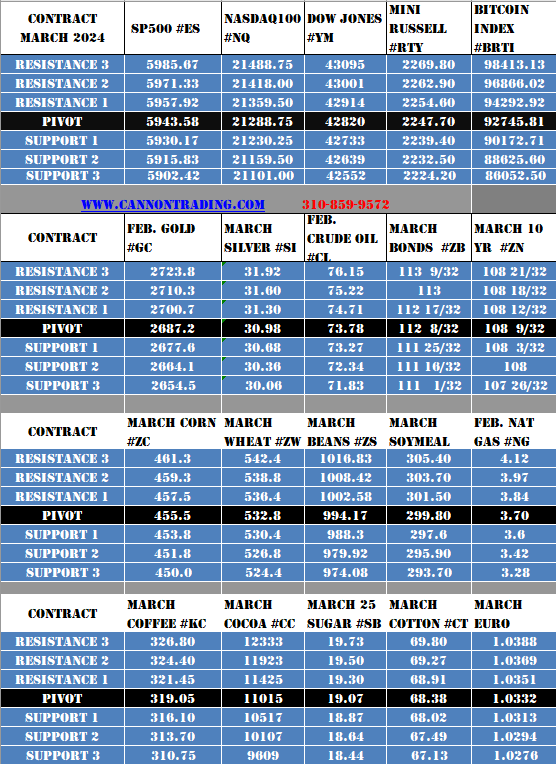
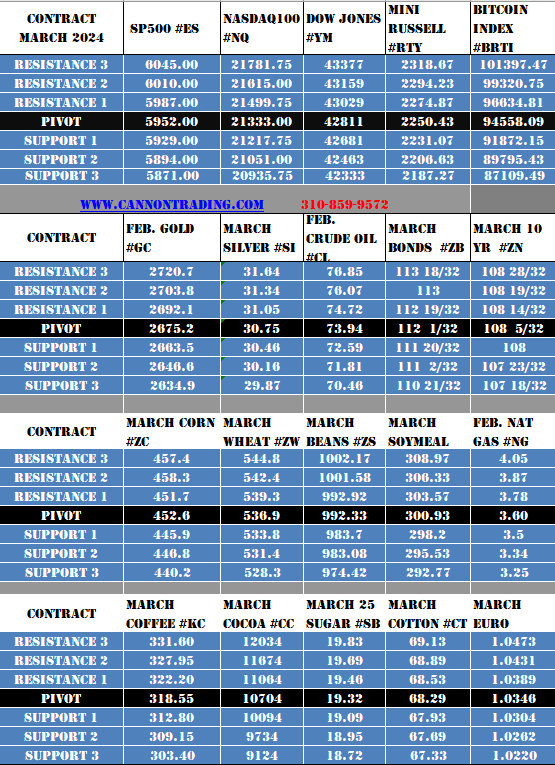
Daily Levels for April 9th, 2024

c247a741 517f 4a5e 9e22 58289021c011

thumbnail?url=http%3A%2F%2Fi.ytimg.com%2Fvi%2FJnHAMUGdNoM%2Fhqdefault

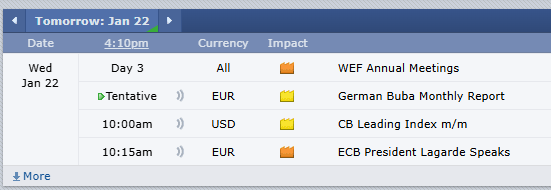
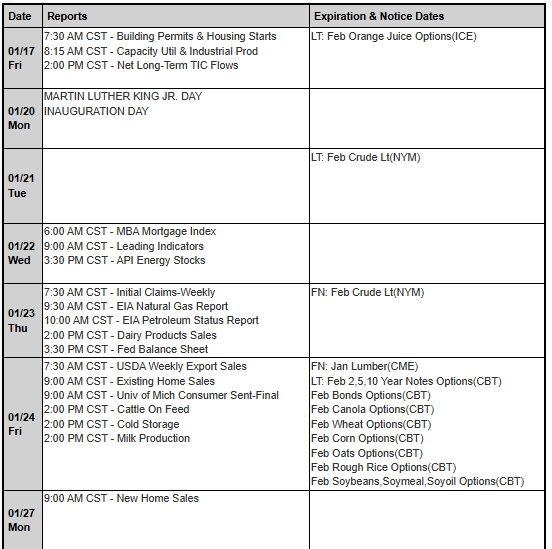
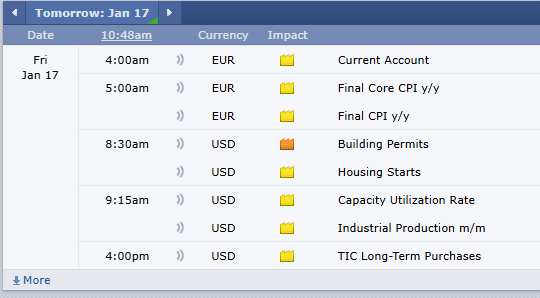
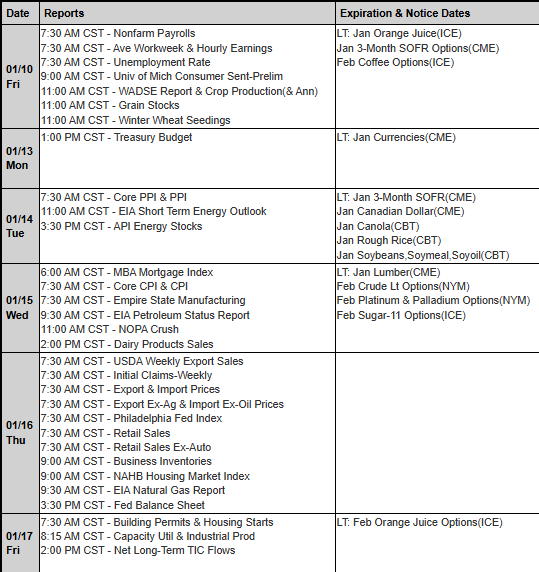
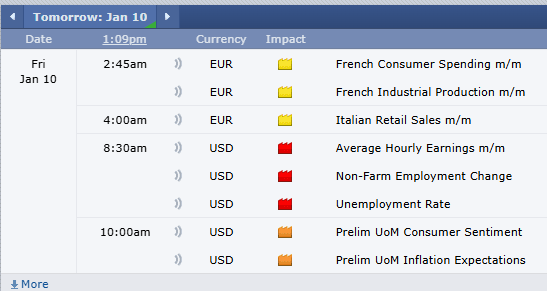
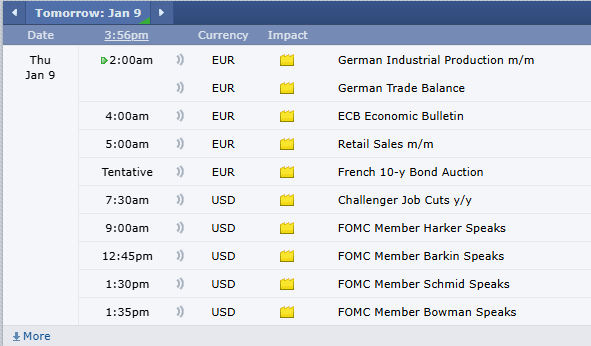
Economic Reports
provided by: ForexFactory.com
All times are Eastern Time ( New York)
d992cb25 b20f 4725 ad38 1fdde9ca456b

Improve Your Trading Skills

Get access to proprietary indicators and trading methods, consult with an experienced broker at 1-800-454-9572.

Explore trading methods. Register Here

3b644da2 2bee 4d39 8d98 5208a20bec39

* This is not a solicitation of any order to buy or sell, but a current market view provided by Cannon Trading Inc. Any statement of facts here in contained are derived from sources believed to be reliable, but are not guaranteed as to accuracy, nor they purport to be complete. No responsibility is assumed with respect to any such statement or with respect to any expression of opinion herein contained. Readers are urged to exercise their own judgement in trading.

NFP Tomorrow + Futures Trading Levels for 04.05.2024

Get Real Time updates and more by joining our Private Facebook Group!
Subscribe to our YouTube Channel


C37


  • NonFarm Payrolls, NFP one of the biggest data points every month tomorrow @ 7:30CDT
  • Expectations are 200K added ( the market pays attention to the revisions equally)
  • Manage your capital well, take on less risk than you would during normal time frames.
  • 4 FED Speakers tomorrow Beginning @ 7:30AM CDT.


May Copper chart for your review below.

49df7b82 c10f 4ad1 8b49 5d1c81f9a81e


stars

e35cb555 9ff3 4f00 9fe8 0655b28fbd90

Daily Levels for April 5th, 2024

8afc3dcb 7af1 4acc 8557 4d06cf22b2e9

thumbnail?url=http%3A%2F%2Fi.ytimg.com%2Fvi%2FJnHAMUGdNoM%2Fhqdefault

Economic Reports
provided by: ForexFactory.com
All times are Eastern Time ( New York)
20333e1d 9936 4e97 81f9 e3956dff7265

Improve Your Trading Skills

Get access to proprietary indicators and trading methods, consult with an experienced broker at 1-800-454-9572.

Explore trading methods. Register Here

3b644da2 2bee 4d39 8d98 5208a20bec39

* This is not a solicitation of any order to buy or sell, but a current market view provided by Cannon Trading Inc. Any statement of facts here in contained are derived from sources believed to be reliable, but are not guaranteed as to accuracy, nor they purport to be complete. No responsibility is assumed with respect to any such statement or with respect to any expression of opinion herein contained. Readers are urged to exercise their own judgement in trading.

First Notice, Last Trading Days + Futures Trading Levels for 04.04.2024

Get Real Time updates and more by joining our Private Facebook Group!
Subscribe to our YouTube Channel


C36


Below are the contracts which are entering First Notice or Last Trading Day for the upcoming month. Be advised, for contracts that are deliverable, it is requested that all LONG positions be exited two days prior to First Notice and ALL positions be exited the day prior to Last Trading Day. If you have any questions please contact the Trade Desk


bac7c593 9977 4089 a012 8c6fc8260c09

ee518d6e d05a 425d bb50 7dcce2603d76

US 30 yr Bonds chart for your review below.

45110c36 6cc1 437c a8db 0ee5f220aeb9

Plan your trade and trade your plan


stars

e35cb555 9ff3 4f00 9fe8 0655b28fbd90

Daily Levels for April 4th, 2024

1e70b16d 0700 446c aa12 4c3e5950cef1

thumbnail?url=http%3A%2F%2Fi.ytimg.com%2Fvi%2FJnHAMUGdNoM%2Fhqdefault

Economic Reports
provided by: ForexFactory.com
All times are Eastern Time ( New York)
d2511a9f 0c19 4191 b814 53f114d51427

Improve Your Trading Skills

Get access to proprietary indicators and trading methods, consult with an experienced broker at 1-800-454-9572.

Explore trading methods. Register Here

3b644da2 2bee 4d39 8d98 5208a20bec39

* This is not a solicitation of any order to buy or sell, but a current market view provided by Cannon Trading Inc. Any statement of facts here in contained are derived from sources believed to be reliable, but are not guaranteed as to accuracy, nor they purport to be complete. No responsibility is assumed with respect to any such statement or with respect to any expression of opinion herein contained. Readers are urged to exercise their own judgement in trading.

OPEC Meeting + Futures Trading Levels for April 3rd

Get Real Time updates and more by joining our Private Facebook Group!
Subscribe to our YouTube Channel


C36


OPEC Meeting tomorrow

  • OPEC+ JMMC meets on Wednesday at 1100 GMT
  • Producers earlier agreed to extend output cuts
  • Oil rallies to $89 a barrel, highest this year

LONDON, April 2 (Reuters) – An OPEC+ ministerial panel is unlikely to recommend any oil output policy changes at a meeting on Wednesday, five OPEC+ sources told Reuters, as oil prices hit their highest this year.

The Organization of the Petroleum Exporting Countries and allies led by Russia, known as OPEC+, will hold an online joint ministerial monitoring committee meeting (JMMC) on April 3 to review the market and members’ implementation of output cuts they have already agreed to extend.

Gold hit all time highs!

Gold chart for your review below.


9d030a51 bab9 46e6 89ea f013c8027406


Plan your trade and trade your plan


stars

e35cb555 9ff3 4f00 9fe8 0655b28fbd90

Daily Levels for April 3rd, 2024

be9e5c9c a5a5 4cac 9bfb aa780f8e5287

thumbnail?url=http%3A%2F%2Fi.ytimg.com%2Fvi%2FJnHAMUGdNoM%2Fhqdefault

Economic Reports
provided by: ForexFactory.com
All times are Eastern Time ( New York)
28be01ed 32e0 4782 9729 af04dbcb3640

Improve Your Trading Skills

Get access to proprietary indicators and trading methods, consult with an experienced broker at 1-800-454-9572.

Explore trading methods. Register Here

3b644da2 2bee 4d39 8d98 5208a20bec39

* This is not a solicitation of any order to buy or sell, but a current market view provided by Cannon Trading Inc. Any statement of facts here in contained are derived from sources believed to be reliable, but are not guaranteed as to accuracy, nor they purport to be complete. No responsibility is assumed with respect to any such statement or with respect to any expression of opinion herein contained. Readers are urged to exercise their own judgement in trading.

Markets are closed tomorrow! Futures Trading Levels for April 1st

Get Real Time updates and more by joining our Private Facebook Group!
Subscribe to our YouTube Channel


C34


Markets are Closed Tomorrow!


aa10efaf 79df 42c5 8a2c a369230fa306


Plan your trade and trade your plan


stars

e35cb555 9ff3 4f00 9fe8 0655b28fbd90

Daily Levels for March 28th, 2024

Levels 3.28

thumbnail?url=http%3A%2F%2Fi.ytimg.com%2Fvi%2FJnHAMUGdNoM%2Fhqdefault

Economic Reports
provided by: ForexFactory.com
All times are Eastern Time ( New York)
FF 3.28

Improve Your Trading Skills

Get access to proprietary indicators and trading methods, consult with an experienced broker at 1-800-454-9572.

Explore trading methods. Register Here

3b644da2 2bee 4d39 8d98 5208a20bec39

* This is not a solicitation of any order to buy or sell, but a current market view provided by Cannon Trading Inc. Any statement of facts here in contained are derived from sources believed to be reliable, but are not guaranteed as to accuracy, nor they purport to be complete. No responsibility is assumed with respect to any such statement or with respect to any expression of opinion herein contained. Readers are urged to exercise their own judgement in trading.

Weekly Hueber Report: Now is it time to worry? Trading Levels for March 27th

Get Real Time updates and more by joining our Private Facebook Group!
Subscribe to our YouTube Channel


C33


The Following is analysis from Dan Hueber. You can find his analysis on Our QT Market Trading platform


Weekly Hueber Report: Now is it time to worry?


According to the Federal l Reserve Bank of New York, household debt in the United States grew by $212 billion to reach $17.5 trillion in the fourth quarter of last year. The lion’s share of this debt is wrapped up in mortgages and home equity lines of credit, which grew $112 billion during the quarter and reached $12.25 trillion. Auto loans rose $12 billion to $1.61 trillion, and student loans were flat at around $1.6 trillion, but the most significant percentage growth came via credit cards, which jumped $50 billion to $1.13 trillion.


5a13d0b4 a6a5 48cc a290 65d90fbed22a

Do keep in mind that as the overall population continues to grow, it is only natural for debt to expand along with it. Still, when you add in the fact that savings went backward during that same period, it would appear that the American consumer is increasingly relying on debt to meet day-to-day needs and wants. I should point out that savings balances have not slipped to as low as they were during the second quarter of 2022 and remain relatively consistent with the period between 2010 and 2018. However, both the amount being tucked away and the personal savings rate have been trending lower again.

e03bcb42 a23c 4b1d 9194 571e57e3713e

There is one more telling chart that we need to throw into the mix—the delinquency rate on credit cards. While nowhere near the nearly 7% level witnessed during the Great Recession or even the averages seen throughout much of the 1990s, it has been climbing steadily for the past two years and has risen to the highest level since the second quarter of 2011.

6dfc3180 7d60 42c0 b005 7fa2df52ca85

Granted, not all of this news has been bleak, at least not if you are in the banking sector. Last year, they reported an estimated $92 billion in earnings, and this after taking into account funding costs and loan losses. This is more than double what they were earning from credit cards a decade ago. As the old proverb says, one man’s poison is another man’s pleasure. While there are a number of other elements that factor into this, it should come as no surprise that recent surveys find that 41% of Americans believe they are worse off than four years ago. In case you were wondering, 24% say they are better off, and 34% said they were about the same. That still leaves the majority of people thinking that at least they have been holding their own, but these debt trends would appear to suggest that number may shrink in the months ahead.

**The views expressed above are entirely those of the author.

DH


Plan your trade and trade your plan


stars

e35cb555 9ff3 4f00 9fe8 0655b28fbd90

Daily Levels for March 27th, 2024

53ed0cce e698 47a5 8126 45cb8fda23cd

b0ba1776 c0cd 4536 92c1 eef6595d7173

Economic Reports
provided by: ForexFactory.com
All times are Eastern Time ( New York)
6eaa8ebc d1a1 4b54 9f6f d28f636b6a04

Improve Your Trading Skills

Get access to proprietary indicators and trading methods, consult with an experienced broker at 1-800-454-9572.

Explore trading methods. Register Here

3b644da2 2bee 4d39 8d98 5208a20bec39

* This is not a solicitation of any order to buy or sell, but a current market view provided by Cannon Trading Inc. Any statement of facts here in contained are derived from sources believed to be reliable, but are not guaranteed as to accuracy, nor they purport to be complete. No responsibility is assumed with respect to any such statement or with respect to any expression of opinion herein contained. Readers are urged to exercise their own judgement in trading.

Weekly Newsletter: Understanding Margins, May Bean Meal Outlook and Automated NQ System

Get Real Time updates and more by joining our Private Facebook Group!
Subscribe to our YouTube Channel

C31

Cannon Futures Weekly Letter Issue # 1186

In this issue:
  •  Important Notices – Good Friday Trading Schedule
  • Trading Resource of the Week – Understanding Margins
  • Hot Market of the Week – May Bean Meal
  • Broker’s Trading System of the Week – NQ Intraday System
  • Trading Levels for Next Week
  • Trading Reports for Next Week


Important Notices –

  • 4 Day Trading week, All Mkts closed Good Friday (MKTS closed from Thursday afternoon until Sunday Afternoon)
  • 6 Data releases: New home sales, Durable Goods, Consumer Confidence, GDP (Q4 final), Jobless Claims, Chicago PMI
  • Grain traders! Big Prospective plantings report Thursday Morning.
  • Night Traders, WATCHOUT for volatility Wednesday and Sunday. Fed Speaker Waller: Econ. Outlook 6PM EDT. Jerome Powell Friday Morning 11:30 EDT @SF Monetary Policy Conference.


4ff4fc7b 00fb 48ea a8e2 eec4c4609c4b


Trading Resource of the Week : Understanding Margins by CMEgroup.com

Understanding Margin

Securities margin is the money you borrow as a partial down payment, up to 50% of the purchase price, to buy and own a stock, bond, or ETF. This practice is often referred to as buying on margin.
Futures margin is the amount of money that you must deposit and keep on hand with your broker when you open a futures position. It is not a down payment and you do not own the underlying commodity.
Futures margin generally represents a smaller percentage of the notional value of the contract, typically 3-12% per futures contract as opposed to up to 50% of the face value of securities purchased on margin.

Margins Move with the Markets

When markets are changing rapidly and daily price moves become more volatile, market conditions and the clearinghouses’ margin methodology may result in higher margin requirements to account for increased risk.
When market conditions and the margin methodology warrant, margin requirements may be reduced.

Types of Futures Margin

Initial margin is the amount of funds required by CME Clearing to initiate a futures position. While CME Clearing sets the margin amount, your broker may be required to collect additional funds for deposit.
Maintenance margin is the minimum amount that must be maintained at any given time in your account.
If the funds in your account drop below the maintenance margin level, a few things can happen:
  • You may receive a margin call where you will be required to add more funds immediately to bring the account back up to the initial margin level.
  • If you do not or can not meet the margin call, you may be able to reduce your position in accordance with the amount of funds remaining in your account.
  • Your position may be liquidated automatically once it drops below the maintenance margin level.

Summary

Futures margin is the amount of money that you must deposit and keep on hand with your broker when you open a futures position. It is not a down payment, and you do not own the underlying commodity.
The term margin is used across multiple financial markets. However, there is difference between securities margins and futures margins. Understanding these differences is essential, prior to trading futures contracts.


stars

3b644da2 2bee 4d39 8d98 5208a20bec39


  • Hot Market of the Week – May Bean Meal
Hot market of the week is provided by QT Market Center, A Swiss army knife charting package that’s not just for Hedgers, Cooperatives and Farmers alike but also for Spread traders, Swing traders and shorter time frame application for intraday traders with a unique proprietary indicator that can be applied to your specific trading needs.
May Bean Meal
May meal satisfied its first upside PriceCount objective and is correcting lower. At this point, IF the chart can resume its rally with new sustained highs, the second count would project a possible run to the 356.5 area.
PriceCounts – Not about where we’ve been , but where we might be going next!
9b3675bf 04d6 4b4f 9b5a c9ae82c43df2
The PriceCount study is a tool that can help to project the distance of a move in price. The counts are not intended to be an ‘exact’ science but rather offer a target area for the four objectives which are based off the first leg of a move with each subsequent count having a smaller percentage of being achieved. It is normal for the chart to react by correcting or consolidating at an objective and then either resuming its move or reversing trend. Best utilized in conjunction with other technical tools, PriceCounts offer one more way to analyze charts and help to manage your positions and risk. Learn more at www.qtchartoftheday.com
Trading in futures, options, securities, derivatives or OTC products entails significant risks which must be understood prior to trading and may not be appropriate for all investors. Past performance of actual trades or strategies is not necessarily indicative of future results.
  • Broker’s Trading System of the Week

With algorithmic trading systems becoming more prevalent in portfolio diversification, the following system has been selected as the broker’s choice for this month.
PRODUCT
Mini NASDAQ 100
SYSTEM TYPE
Intraday
COST
USD 55 / monthly
Recommended Cannon Trading Starting Capital
$20,000
f7389f2b 7178 4e28 83a0 2ee3eb7b58d4
The performance shown above is hypothetical in that the chart represents returns in a model account. The model account rises or falls by the average single contract profit and loss achieved by clients trading actual money pursuant to the listed system’s trading signals on the appropriate dates (client fills), or if no actual client profit or loss available – by the hypothetical single contract profit and loss of trades generated by the system’s trading signals on that day in real time (real‐time) less slippage, or if no real time profit or loss available – by the hypothetical single contract profit and loss of trades generated by running the system logic backwards on back adjusted data. Please read full disclaimer HERE.
Would you like to receive daily support & resistance levels?
Yes
S
No
S


Daily Levels for March 25th 2024

cff985a6 cddb 48ec 9cf9 b2df3dc2ee88

Trading Reports for Next Week

ddee5173 eaeb 4db2 9b96 7687c49cc099
d259df9c bf07 4429 9fa8 d12b53c37804
First Notice (FN), Last trading (LT) Days for the Week:
1ee7c896 4991 4ebc bb72 d924270bf921

Improve Your Trading Skills

Get access to proprietary indicators and trading methods, consult with an experienced broker at 1-800-454-9572.

Explore trading methods. Register Here

* This is not a solicitation of any order to buy or sell, but a current market view provided by Cannon Trading Inc. Any statement of facts here in contained are derived from sources believed to be reliable, but are not guaranteed as to accuracy, nor they purport to be complete. No responsibility is assumed with respect to any such statement or with respect to any expression of opinion herein contained. Readers are urged to exercise their own judgement in trading.

Weekly Newsletter: Understanding Price Banding, May Bean Oil Outlook and Automated Gold System

Get Real Time updates and more by joining our Private Facebook Group!
Subscribe to our YouTube Channel

C27

Cannon Futures Weekly Letter Issue # 1186

In this issue:
  •  Important Notices – FOMC Next Week
  • Trading Resource of the Week – Understanding Price Limits and Banding
  • Hot Market of the Week – May Bean Oil
  • Broker’s Trading System of the Week – Gold Swing System
  • Trading Levels for Next Week
  • Trading Reports for Next Week


Important Notices –

  • FOMC Meeting next week. Announcement on Wednesday.
  • Light data most of the week. Housing sales
  • Very few earnings
  • June is front month for indices, currencies and financials.: M = June
  • USA is on daylight savings time – most international countries have NOT changed yet.


Trading Resource of the Week : What are Price Limits and Price Banding? by CMEgroup.com

As a trader, you want to know that there are mechanisms in place to ensure an orderly market. A regulated marketplace like CME Group provides this order by setting price limits and price banding.
Price Limits
Price limits are the maximum price range permitted for a futures contract in each trading session. These price limits are measured in ticks and vary from product to product. When markets hit the price limit, different actions occur depending on the product being traded. Some markets may temporarily halt until price limits can be expanded or trading may be stopped for the day based on regulatory rules. Different futures contracts will have different price limit rules; i.e. Equity Index futures have different rules than Agricultural futures.
Example
Equity Indexes futures have a three level expansion: 7%, 13% and 20% to the downside, and a 7% limit up and down in overnight trading.
When price reaches any of those levels the market will go limit up or limit down.
Calculating Price Limits
Price limits are re-calculated daily and remain in effect for all trading days except in certain physically-deliverable markets, where price limits are lifted prior to expiration so that futures prices are not prevented from converging on prices for the underlying commodity.
Typically, Agricultural futures will go limit up or down most often compared to Equity Index futures which very rarely if ever go limit up or down. When trading a specific product, it is important to be aware of price limits and the mechanisms that occur when limits are hit. Traders also know that it is possible for limits to be reached for more than one session in a row, however the expansion of limit thresholds over the last few years have reduced this occurrence.
Price Banding
Price banding is a similar mechanism which subjects all orders to price validation and rejects orders outside the given band to maintain orderly markets. Bands are calculated dynamically for each product based on the last price, plus or minus a fixed band value. Thus, if markets quickly move in one direction, the price bands dynamically adjust to accommodate new trading ranges.
Conclusion
The rules for each market can be found on cmegroup.com.
It is important to note that traders can place trades outside the daily price limits. These trades will be executed when price limits and price bands move within the specified range. So, traders still have the ability to place good-til-canceled or good-til-date orders inside and outside daily price limits.
In the last few years there are fewer and fewer times that markets will actually go limit up or down, but it is important to be aware of these pricing rules when you trade.
efa302e7 662d 4483 85eb 5655e4b45680


stars

3b644da2 2bee 4d39 8d98 5208a20bec39


  • Hot Market of the Week – May Bean Oil
Hot market of the week is provided by QT Market Center, A Swiss army knife charting package that’s not just for Hedgers, Cooperatives and Farmers alike but also for Spread traders, Swing traders and shorter time frame application for intraday traders with a unique proprietary indicator that can be applied to your specific trading needs.
May Bean Oil
The rally in May soybean oil accelerated to its second upside PriceCount objective and now the chart is correcting. At this point, IF you can resume the rally with new sustained highs, the third count would project a possible run to the 50.87 area.
PriceCounts – Not about where we’ve been , but where we might be going next!
5bd46875 4f13 4f46 8290 888342486818
The PriceCount study is a tool that can help to project the distance of a move in price. The counts are not intended to be an ‘exact’ science but rather offer a target area for the four objectives which are based off the first leg of a move with each subsequent count having a smaller percentage of being achieved. It is normal for the chart to react by correcting or consolidating at an objective and then either resuming its move or reversing trend. Best utilized in conjunction with other technical tools, PriceCounts offer one more way to analyze charts and help to manage your positions and risk. Learn more at www.qtchartoftheday.com
Trading in futures, options, securities, derivatives or OTC products entails significant risks which must be understood prior to trading and may not be appropriate for all investors. Past performance of actual trades or strategies is not necessarily indicative of future results.
  • Broker’s Trading System of the Week

With algorithmic trading systems becoming more prevalent in portfolio diversification, the following system has been selected as the broker’s choice for this month.
Spartan Gold
PRODUCT
SYSTEM TYPE
Swing
COST
USD 75 / monthly
Recommended Cannon Trading Starting Capital
$20,000
846f5ed4 d467 4de2 9c1d 75acf0c4f4af
The performance shown above is hypothetical in that the chart represents returns in a model account. The model account rises or falls by the average single contract profit and loss achieved by clients trading actual money pursuant to the listed system’s trading signals on the appropriate dates (client fills), or if no actual client profit or loss available – by the hypothetical single contract profit and loss of trades generated by the system’s trading signals on that day in real time (real‐time) less slippage, or if no real time profit or loss available – by the hypothetical single contract profit and loss of trades generated by running the system logic backwards on back adjusted data. Please read full disclaimer HERE.
Would you like to receive daily support & resistance levels?
Yes
S
No
S


Daily Levels for March 18th 2024

b6a2bf3a a499 4edd 8d8e e4d3d22769b4

Trading Reports for Next Week

58d4627d b4e3 4117 a10c 1ddf826463a9
First Notice (FN), Last trading (LT) Days for the Week:

Improve Your Trading Skills

Get access to proprietary indicators and trading methods, consult with an experienced broker at 1-800-454-9572.

Explore trading methods. Register Here

871e501d 3a1d 4e83 8ee9 a2be76e7992f

* This is not a solicitation of any order to buy or sell, but a current market view provided by Cannon Trading Inc. Any statement of facts here in contained are derived from sources believed to be reliable, but are not guaranteed as to accuracy, nor they purport to be complete. No responsibility is assumed with respect to any such statement or with respect to any expression of opinion herein contained. Readers are urged to exercise their own judgement in trading.

Rollover, CPI & Futures Trading Levels for 03.12.24

Get Real Time updates and more by joining our Private Facebook Group!
Subscribe to our YouTube Channel


C3 1


CPI Tomorrow – Trade June ES/NQ/YM and MICROS

by John Thorpe, Senior Broker


For all of you index traders, you may have noticed the shrinking Open Interest and Volume in the March contracts. It’s that time when volume shifts to the next quarterly expiration contract. June! the symbol is M.

March volume will be drying up quickly, don’t get stuck Friday morning with a March contract at the crack of dawn when the carousel stops. Start trading the June contract today!

According to Bloomberg, the S&P 500 has averaged an 0.8% move on CPI days over the past six months

Today, stocks are sideways, the dollar and gold are both up marginally as investors nervously await tomorrows 7:30 a.m. CDT Consumer Price Index release.

Last Month, on Feb 13th stocks slid sharply following the release and Treasury yields surged higher when a surprise CPI number, an Increase of 0.3% in January, crossed the newswires. Housing costs accounted for much of the price rise.

Overall prices are expected to rise 0.4% percent after increasing 0.3% percent in January. Annual rates, which in January were 3.1% percent overall and 3.9% percent for the core, are expected at 3.1% and 3.7% percent respectively. Per econoday.


Plan your trade and trade your plan


Watch video below on how to rollover from March to June contracts if you are a stock index trader on our E-Futures Platform!


thumbnail?url=http%3A%2F%2Fi.vimeocdn


37d7a522 9491 476e bccd 5d86442eda21


stars

e35cb555 9ff3 4f00 9fe8 0655b28fbd90

Daily Levels for March 12th, 2024

700b4a89 9678 42c2 b57f 894fc90822f3

b0ba1776 c0cd 4536 92c1 eef6595d7173

Economic Reports
provided by: ForexFactory.com
All times are Eastern Time ( New York)
1c9e26e4 46da 486b bf63 f4f09f2959a4

Improve Your Trading Skills

Get access to proprietary indicators and trading methods, consult with an experienced broker at 1-800-454-9572.

Explore trading methods. Register Here

3b644da2 2bee 4d39 8d98 5208a20bec39

* This is not a solicitation of any order to buy or sell, but a current market view provided by Cannon Trading Inc. Any statement of facts here in contained are derived from sources believed to be reliable, but are not guaranteed as to accuracy, nor they purport to be complete. No responsibility is assumed with respect to any such statement or with respect to any expression of opinion herein contained. Readers are urged to exercise their own judgement in trading.

Bitcoin Flirting with All time highs, PCE + Futures Trading Levels for 02.29.24

Get Real Time updates and more by joining our Private Facebook Group!
Subscribe to our YouTube Channel


C18


PCE, Bitcoin and More

By Mark O’Brien, Senior Broker


Heads up: 

Keep an eye out tomorrow (7:30 A.M., Central Time) for the release of the Fed’s preferred U.S. inflation gauge: the PCE Personal Consumption & Expenditures Price Index.  The consensus is that the January core PCE deflator will ease to 2.8% year-over-year from the 2.9% reading December.

General: 

By and large, the outlook for the global economy is improving.  In China, the business storm clouds are at least not bucketing down on the county’s overall fiscal house.  Report after economic report released in the U.S. continue to validate forecasts of a future “soft landing,” or better – plain ol’ get up and go.  To that end, A.I. euphoria dominates the conversation about what’s driving things.  Even the disappointment surrounding the Fed’s patience in deciding when interest rates should be lowered hasn’t disturbed the current frame of mind.  Keep an eye out for commodities sitting on major lows, such as corn and soybeans.  Even with forecasts for a large South American harvest and a stage set for a strong crop year in the U.S., global growth begets global demand and “bargain price” commodities may be ready to mount rallies.

Crypto: 

Bitcoin’s value has been on an impressive rise over the past month, and CME Bitcoin futures (“Full-size”-5-Bitcoin contract, 1/50-Micro Bitcoin contract) have lead the way, with the March Micro Bitcoin contract hitting $65,000 during morning trading today, well above the $57,000 range highs posted in Nov. 2021.  Open interest for the full-size contract came in at a nominal value of $7.77 billion, which is nearly a third of the market share for all Bitcoin market derivatives – more than Binance ($6.1 billion); more than Bybit ($4.1 billion).  These values surpassed past records set in both 2021 and 2017.

At present, the open interest figures for bitcoin futures have reached an all-time high of $24.44 billion as of Feb. 27, 2024.


09dcdc16 722c 4f1a 974c ec5ddf9b6452


Energy: 

Did you know the U.S. is currently producing around 13.3M barrels of crude per day, which is way more than any country on the globe, including Saudi Arabia at ±8.9M barrels per day (as of Dec. ’23). The output growth has helped tame gas prices and, perhaps more importantly, undermined the influence of OPEC and Russia following the invasion of Ukraine in 2022.


Producers also know that while times are good, demand can come down or eventually plateau, especially with the U.S. currently exporting more oil than nearly every member of OPEC. Remember the 2014-16 downturn, which hammered the industry and was largely driven by a supply glut.


Plan your trade and trade your plan


stars

e35cb555 9ff3 4f00 9fe8 0655b28fbd90

Daily Levels for February 29th, 2024

00826e34 c2e2 46f9 9821 9e9163ae1a87

b0ba1776 c0cd 4536 92c1 eef6595d7173

Economic Reports
provided by: ForexFactory.com
All times are Eastern Time ( New York)
5aa7bd3f a838 49fc 8c45 730bc5c025f6

Improve Your Trading Skills

Get access to proprietary indicators and trading methods, consult with an experienced broker at 1-800-454-9572.

Explore trading methods. Register Here

3b644da2 2bee 4d39 8d98 5208a20bec39

* This is not a solicitation of any order to buy or sell, but a current market view provided by Cannon Trading Inc. Any statement of facts here in contained are derived from sources believed to be reliable, but are not guaranteed as to accuracy, nor they purport to be complete. No responsibility is assumed with respect to any such statement or with respect to any expression of opinion herein contained. Readers are urged to exercise their own judgement in trading.