Weekly Futures Silver Chart & Trading Level 6.07.2019

____________________________________________________________________

Voted #1 Blog and #1 Brokerage Services on TraderPlanet for 2016!!  

____________________________________________________________________

Dear Traders,

Like us on FaceBook!
Get Real Time updates and market alerts on Twitter!
Is the silver market finally waking up?
A look at weekly chart below.
Are you tired of day-trading and getting stopped out?
  1. As a hedge, no need for stops
  2. As a pure speculation. A relatively inexpensive way to speculate on market direction in a time frame that can be for minutes, hours or a few days without the need to use stops.
Briefly, the definition of an option contract from the National Futures Association is: An investment vehicle which gives the option buyer the right—but not the obligation—to buy or sell a particular futures contract at a stated price at the specified expiration date. There are two separate and distinct types of options: calls and puts. These weekly options are European Style, Exercisable to the nearest futures contract at 3pm Central time on Friday. If in the money by any amount, the exercise is automatic.
d5829c2a 4fbe 4f67 8a1e 79afe357f03a
bdf6db09 7692 48a4 8450 9a8d7d5f2d31

Good Trading

Trading Futures, Options on Futures, and retail off-exchange foreign currency transactions involves substantial risk of loss and is not suitable for all investors.  You should carefully consider whether trading is suitable for you in light of your circumstances, knowledge, and financial resources. You may lose all or more of your initial investment. Opinions, market data, and recommendations are subject to change at any time.


Futures Trading Levels

06-07-2019

705b08f8 8d23 4684 8805 fcceba0b740f


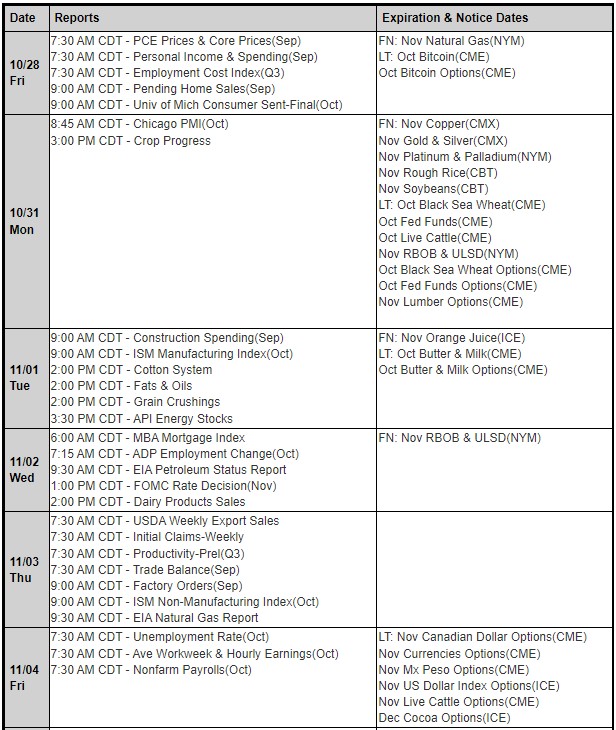
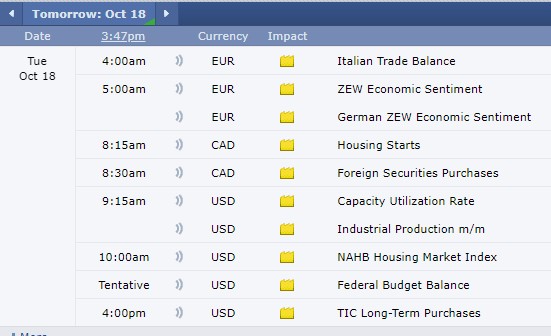
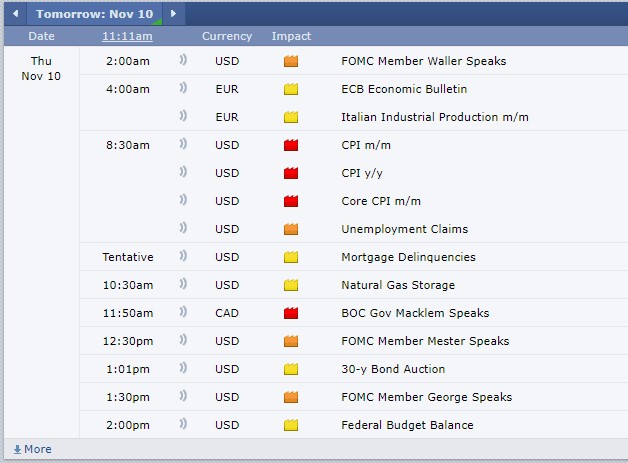
Economic Reports, source: 

bettertrader.co

727afdd1 3cef 4043 aac5 914212963140

This is not a solicitation of any order to buy or sell, but a current market view provided by Cannon Trading Inc. Any statement of facts here in contained are derived from sources believed to be reliable, but are not guaranteed as to accuracy, nor they purport to be complete. No responsibility is assumed with respect to any such statement or with respect to any expression of opinion herein contained. Readers are urged to exercise their own judgement in trading.

June Crop Outlook & Futures Levels 6-04-2019

____________________________________________________________________

Voted #1 Blog and #1 Brokerage Services on TraderPlanet for 2016!!  

____________________________________________________________________

Dear Traders,

Like us on FaceBook!
Get Real Time updates and market alerts on Twitter!
Market Movers Video
June Crop Report Market Outlook
Will weather conditions and resulting planting delays create a historic month for the corn market?
In this video, Dave Hightower, Founding Principal of The Hightower Report, and Dan Basse, President of AgResource Company, discuss how mother nature may impact the upcoming crop season.
ce0f5864 fe35 40f2 9314 60d4b6144bd5
bdf6db09 7692 48a4 8450 9a8d7d5f2d31

Good Trading

Trading Futures, Options on Futures, and retail off-exchange foreign currency transactions involves substantial risk of loss and is not suitable for all investors.  You should carefully consider whether trading is suitable for you in light of your circumstances, knowledge, and financial resources. You may lose all or more of your initial investment. Opinions, market data, and recommendations are subject to change at any time.


Futures Trading Levels

06-05-2019


c0687f5d 9993 4d06 9db8 8cccca401b0e


Economic Reports, source: 

bettertrader.co

3b0501b5 8fac 49da 854b 339ae7180fb2

This is not a solicitation of any order to buy or sell, but a current market view provided by Cannon Trading Inc. Any statement of facts here in contained are derived from sources believed to be reliable, but are not guaranteed as to accuracy, nor they purport to be complete. No responsibility is assumed with respect to any such statement or with respect to any expression of opinion herein contained. Readers are urged to exercise their own judgement in trading.
Trading Videos+ Trading Levels for June 4th

______________________________________________________________

Voted #1 Blog and #1 Brokerage Services on TraderPlanet for 2016!!  

____________________________________________________________________

Dear Traders,

Like us on FaceBook!
Get Real Time updates and market alerts on Twitter!
Trading 101: Trading videos on bollinger bands, Parabolics, Trading levels, Range Bars and more!
Watch the latest trading videos we have posted and shared with our clients!
In this week’s newsletter we are sharing two videos, each a few minutes long. The videos discuss practical tips for trading and sharing our experience with you
1. Using bollinger Bands as a possible tool for exiting trades
2. One way you can use the Parabolics study ( also known as PSAR) to manage current positions, possibly as a trailing stop
3. Different ways traders can utilize support and resistance levels in their trading.
4. Entering trades on a stop, using “price confirmation”.
5. Utilizing Range Bar charts for shorter term trading as a way to try and filter out some noise.
logo
stars

Good Trading

Trading Futures, Options on Futures, and retail off-exchange foreign currency transactions involves substantial risk of loss and is not suitable for all investors.  You should carefully consider whether trading is suitable for you in light of your circumstances, knowledge, and financial resources. You may lose all or more of your initial investment. Opinions, market data, and recommendations are subject to change at any time.


Futures Trading Levels

06-03-2019

c0cd9d79 f227 438b 9abe 909d01d157d5


Economic Reports, source: 

bettertrader.co

S
31ebd27e bd58 4a19 ba72 df1d71fa6fd0


This is not a solicitation of any order to buy or sell, but a current market view provided by Cannon Trading Inc. Any statement of facts here in contained are derived from sources believed to be reliable, but are not guaranteed as to accuracy, nor they purport to be complete. No responsibility is assumed with respect to any such statement or with respect to any expression of opinion herein contained. Readers are urged to exercise their own judgement in trading.

Crude Oil Futures Trading Updates for February 2019

Crude Oil Futures Trading Updates for February 2019

Crude oil futures experienced one of the strongest sell offs to finish 2018. The market sold from the mid 70’s into the mid 40’s in a matter of 7 weeks.

See daily chart below:

CrudeOilChart21319


There were many reasons for the sell off. US China trade talks or lack off, OPEC production, US $ strength and much more but all this is old news at this point and the main focus of futures traders going forward is ”what next?” Before I try to answer that, lets take a look at some key factors that are general in nature to futures trading and crude oil futures trading:

Crude Oil is part of the energy sector along with “it’s” brothers “RBOB – Unleaded gas” and heating oil and cousin, natural gas. All traded on the NYMEX/GLOBEX exchange.

Crude Oil Futures Specs
Hours: 5:00 PM to 4:00 PM next day PM Central Time
Margins: $3410 initial, $3100 Maint. ( as of the date of this newsletter)
Point Value: full point = $1000 ( Example: 71.80 to 72.80 ). Min fluctuation is 0.1 = $10 ( Example: 71.80 to 71.81)
Settlement: Physical, deliverable commodity

Months: Monthly cycle, All Months

Weekly Options: YES
Crude Oil is one of my favorite markets for Day Trading because of the intraday volatility and movements. Be careful, these factors can work against you or in your favor.

Some of the basic fundamentals to keep in mind when you are considering a trade in the crude oil as well as other energies

  1. Longer term view of current market prices
  2.  Dates and times of important reports. Namely, Tuesday afternoon report (API) and the DOE report on Wednesday mornings at 10:30 Am EST
  3. Weather and Seasonality
  4. Correlation to US Dollar prices
  5. Inflationary prospects
  6. Geopolitical Stability
  7. U.S. Fiscal and Monetary Stability

Keep in mind that the GLOBEX/NYMEX also offers the mini Crude oil contract which is half the size and may be a good alternative for smaller/ begginer traders.

MINI Crude Oil Futures Specs
Hours: 5:00 PM to 4:00 PM next day PM Central Time
Margins: $1705 initial, $1550 Maint. ( as of the date of this newsletter)
Point Value: full point = $500 ( Example: 62.80 to 63.80 ). Min fluctuation is 0.25 = $12.5 ( Example: 61.80 to 61.825)
Settlement: Cash Settled commodity one day prior to the Big Contract

Months: Monthly cycle, All Months

So just like when you are trading any commodity or futures contract, one has to ask themselves the following questions in my opinion:

  • What time frame are you trading / looking at? Seconds and minutes? Hours and days or maybe even weeks and months? The answer can definitely impact the type of strategy you will use
  • Do you have a view of the market? Is it going higher? Going lower? Range bound? Is there a trend?
  • What is your personal preference? Risk capital? How much time do you have for following the markets?
  • Are you experienced enough to take a go at it on your own or would you like to chat/ discuss, dissect the markets with a commodity broker, a series 3 licensed futures broker?

If your goal is to scalp and day trade crude oil futures, then take a look at what I consider a timeless piece I wrote a few years back on how to utilize fear and greed to day-trade crude oil futures.

This article has some chart examples and specific trading set ups using crude oil futures trading: Crude Oil Day Trading

Now back to the “million dollar question” – What is next for Crude Oil Futures in the next few weeks?

In order to answer that I will look at the daily chart above and then take a look at the weekly chart below:

CrudeOilChart21319weekly

Based on the fact that we had a major sell off that stopped on support levels, the fact that we are bouncing since then and the opinion I hold that crude oil longer term pressure is still down, my current view for this market is that we will see expanded range bound trading. I am looking for the market to trade between $48 and $59 ( hence the word expanded) over the next few weeks and perhaps more BEFORE it may attempt to take another stab at the down side.

“Well, what good is that you may say to yourself…..” If I am right and you are willing to speculate with risk capital, then this information can be valuable.

My preferred method would be to try and sell call options spread ( vertical call spreads) when the market rallies and sell vertical put spreads when the market sells off. Selling options is a risky strategy!! It is not for new commers and you can learn much more here.

The main theory behind selling the calls and the puts is to take advantage of the time decay of options.

As many of us know, geo political events affect the markets in general and crude oil futures in specific. No one can tell what news, wars, events will take place and that is obviously the unknown factor.

I tell my clients many times on different occasions that entering a trade is only the first part of the equation, the main and even more important part is: how to manage the trade? Where do I exit if I am correct? Where should I exit if I am wrong? Should I use multiple contracts? How much am I willing to risk on the trade?

Many ways to trade any market, many ways to lose money in any market and only very few ways to lock in gains – this one is not different. If you need help creating a trading plan, visit our broker assist services.

Disclaimer – Trading Futures, Options on Futures, and retail off-exchange foreign currency transactions involves substantial risk of loss and is not suitable for all investors. Past performance is not indicative of future results. You should carefully consider whether trading is suitable for you in light of your circumstances, knowledge, and financial resources. You may lose all or more of your initial investment. Opinions, market data, and recommendations are subject to change at any time.

Futures eBook & Trading Levels for 8.17.2018

____________________________________________________________________

Voted #1 Blog and #1 Brokerage Services on TraderPlanet for 2016!!  

____________________________________________________________________

Dear Traders,
Like us on FaceBook!
Get Real Time updates and market alerts on Twitter!
image005
Cannon Trading’s eBook! Written by our very own staff of brokers, this eBook is designed as a guide to the commodities market for both beginners and veterans alike. Inside you can find:
  • A plan with steps for success
  • The top mistakes traders make daily
  • How to handle the market noise
  • And much more!
The futures industry is complex and risky, which is why you need someone to be forthright with you….

Futures Forthright eBook – FREE INSTANT DOWNLOAD

Good Trading!
Trading Futures, Options on Futures, and retail off-exchange foreign currency transactions involves substantial risk of loss and is not suitable for all investors.  You should carefully consider whether trading is suitable for you in light of your circumstances, knowledge, and financial resources. You may lose all or more of your initial investment. Opinions, market data, and recommendations are subject to change at any time.

Futures Trading Levels

08.17.2018

Trustpilot Logo
Trustpilot Stars
TrustScore

Futures Trading Levels For Aug. 17th
Contract September 2018  SP500 #ES_F Nasdaq100  #NQ_F Dow Jones  #YM_F Mini Russell #RTY_F BitCoin Index #XBT_F
Resistance 3 2892.08 7499.50 26206 1719.00 6778.73
Resistance 2 2871.92 7467.00 25907 1706.00 6628.49
Resistance 1 2857.83 7428.25 25745 1697.00 6515.45
Pivot 2837.67 7395.75 25446 1684.00 6365.21
Support 1 2823.58 7357.00 25284 1675.00 6252.17
Support 2 2803.42 7324.50 24985 1662.00 6101.93
Support 3 2789.33 7285.75 24823 1653.00 5988.89
Contract December Gold #GC_F Sept. Silver #SI-F Sept. Crude Oil #CL-F Sept.  Bonds  #ZB_F Sept.  Euro #6E_F
Resistance 3 1212.6 15.38 66.93 145 12/32 1.1507
Resistance 2 1200.8 15.10 66.22 145  1/32 1.1470
Resistance 1 1190.7 14.87 65.84 144 26/32 1.1434
Pivot 1178.9 14.59 65.13 144 15/32 1.1397
Support 1 1168.8 14.36 64.75 144  8/32 1.1360
Support 2 1157.0 14.08 64.04 143 29/32 1.1323
Support 3 1146.9 13.85 63.66 143 22/32 1.1287
Contract Dec.  Corn #ZC_F Sept. Wheat #ZW_F Nov. Beans #ZS_F Dec. SoyMeal #ZM_F Sept. Nat Gas #NG_F
Resistance 3 384.5 576.8 916.17 346.43 3.00
Resistance 2 383.3 572.2 907.83 342.27 2.97
Resistance 1 381.5 567.1 902.42 339.63 2.94
Pivot 380.3 562.4 894.08 335.47 2.92
Support 1 378.5 557.3 888.7 332.8 2.9
Support 2 377.3 552.7 880.33 328.67 2.86
Support 3 375.5 547.6 874.92 326.03 2.83

Economic Reports,  source:


Economic Reports, source

https://app.bettertrader.com


a2858758 9387 4642 b780 7921e7a4accb


This is not a solicitation of any order to buy or sell, but a current market view provided by Cannon Trading Inc. Any statement of facts here in contained are derived from sources believed to be reliable, but are not guaranteed as to accuracy, nor they purport to be complete. No responsibility is assumed with respect to any such statement or with respect to any expression of opinion herein contained. Readers are urged to exercise their own judgement in trading.
Gold weekly chart +Support & Resistance Levels 6.21.2018

____________________________________________________________________

Voted #1 Blog and #1 Brokerage Services on TraderPlanet for 2016!!  

____________________________________________________________________

Dear Traders,

Follow us on Twitter and receive real time trade updates, market developments and breaking news!!
Gold WEEKLY chart for your review below.
This Sunday night I got the first weekly sell signal since the end of 2017. You can see the little red arrow along with the current bar marked in red. Just because a signal happened, does not mean we will see a sell off but for me personally it is a good probability that the pressure is stronger to the downside. I like some of the option plays one can do using vertical put spreads.
c2bdd324 236d 47a6 9507 0e70710e478b
The chart above includes some proprietary studies/ALGOS.
These ALGOS along with a 15 minutes one on one session is available for a free trial.

To sign up and more info visit: https://www.cannontrading.com/tools/intraday-futures-trading-signals 

Good Trading

Trading Futures, Options on Futures, and retail off-exchange foreign currency transactions involves substantial risk of loss and is not suitable for all investors.  You should carefully consider whether trading is suitable for you in light of your circumstances, knowledge, and financial resources. You may lose all or more of your initial investment. Opinions, market data, and recommendations are subject to change at any time.

Futures Trading Levels

06-21-2018

Contract September 2018  SP500 #ES_F Nasdaq100  #NQ_F Dow Jones  #YM_F Mini Russell #RTY_F BitCoin Index #XBT_F
Resistance 3 2801.25 7461.33 25029 1737.83 7109.66
Resistance 2 2789.75 7398.92 24944 1725.87 6961.28
Resistance 1 2780.25 7351.58 24803 1718.83 6857.81
Pivot 2768.75 7289.17 24718 1706.87 6709.43
Support 1 2759.25 7241.83 24577 1699.83 6605.96
Support 2 2747.75 7179.42 24492 1687.87 6457.58
Support 3 2738.25 7132.08 24351 1680.83 6354.11
Contract August Gold #GC_F July Silver #SI-F Aug. Crude Oil #CL-F Sept.  Bonds  #ZB_F Sept.  Euro #6E_F
Resistance 3 1284.9 16.48 67.89 144 27/32 1.1749
Resistance 2 1281.7 16.43 67.12 144 19/32 1.1713
Resistance 1 1276.7 16.36 66.33 143 31/32 1.1685
Pivot 1273.5 16.31 65.56 143 23/32 1.1649
Support 1 1268.5 16.24 64.77 143  3/32 1.1622
Support 2 1265.3 16.19 64.00 142 27/32 1.1586
Support 3 1260.3 16.12 63.21 142  7/32 1.1558
Contract July  Corn #ZC_F July Wheat #ZW_F July Beans #ZS_F July SoyMeal #ZM_F July Nat Gas #NG_F
Resistance 3 367.0 509.2 917.00 348.10 3.04
Resistance 2 361.8 499.6 906.50 343.00 3.01
Resistance 1 358.0 493.9 898.00 338.10 2.98
Pivot 352.8 484.3 887.50 333.00 2.95
Support 1 349.0 478.7 879.0 328.1 2.9
Support 2 343.8 469.1 868.50 323.00 2.89
Support 3 340.0 463.4 860.00 318.10 2.87

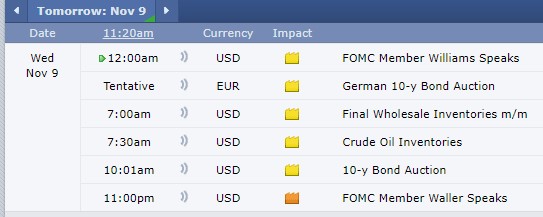
Economic Reports, source: 

http://app.bettertrader.co 


f9f245ad c1d4 435d 8460 6a55b5e3db2e

This is not a solicitation of any order to buy or sell, but a current market view provided by Cannon Trading Inc. Any statement of facts here in contained are derived from sources believed to be reliable, but are not guaranteed as to accuracy, nor they purport to be complete. No responsibility is assumed with respect to any such statement or with respect to any expression of opinion herein contained. Readers are urged to exercise their own judgement in trading.

Trading Crude Oil Futures

Tips for day trading NYMEX crude oil futures

By Ilan Levy-Mayer, VP Cannon Trading Co, Inc.

When it comes to day trading futures contracts, crude oil futures are assumed one of the leading positions as far as trading volume.


During the month of May 2018,  crude oil futures averaged around 1 Million contracts traded per day! That actually surpasses contracts like the ten-year notes, mini SP, mini Nasdaq and others who have traditionally been leaders’ in terms of volume.


Part of the growth in crude oil futures is attributed to day trader participation. Day traders, by definition, will enter and exit their positions during the same trading day. This adds volume to the market traded.


Some of the tips I am sharing below can be applied to most futures contracts as well as other financial products that are traded like stocks, forex, bonds and others. Some of the advice I am sharing is very specific to the crude oil futures trading field.


  1. Know the product you are trading:


  1. Just like a trader who trades a stock like Facebook knows what Facebook does, when its earning reports are due and other factors, so does a crude oil futures day trader needs to know a few facts about crude oil:


  • Contract Size: Crude Oil Futures consist of 1,000 barrels. For the trader this means that each full $1 move in crude futures = $1,000 against you or in your favor.


For example:  A move from 72.10 to 73.10 = $1,000 and a move from 72.10 to 72.11 = $10 (the minimum fluctuation size or the tick size). Be aware that the CME also offers the mini crude contract,  which is half the size.


  • Trading Hours: Crude oil futures trade on the Globex terminal between the hours of 5:00 PM CST the DAY BEFORE to 4:00 PM CST the following day. Which means 23 hours of straight trading. It is important to know that most of the volume will trade between the hours of 8:00 AM CST and 1:30 PM CST, as these hours correspond to the “pit session” of the old trading floor.


Another key aspect to remember is that crude oil is a deliverable commodity and the “front month” will change every 30 days or so. For example: since May 22nd 2018 we have been trading July crude oil.


  • Reports: There are more than a few reports that will affect crude oil future prices indirectly. These include monthly unemployment, the FOMC rate decision, and a few others.


However, there are two major reports that move crude oil futures and its by-products (unleaded gasoline and heating oil) sharply: The API report, which comes out at 3:30 PM CST every Tuesday, and the DOE (Dept. of Energy) inventory numbers, which come out almost every Wednesday at 9:30AM CST.


Take a look at this one-minute chart from Wednesday, May 16th right around the report time below to understand the volatility involved.

chart1

As you can see above, the market made a move of $700 per ONE contract in a matter of minutes, perhaps even seconds! That type of risk and opportunity is one of the factors attracting day-traders into the crude oil market.


  • Geo Political Events: Middle East tensions, the Iran nuclear deal, tensions between Iraq and its neighbors…these are all examples of events that affect crude oil prices. Not to mention OPEC meetings!


  1. Trading Personality:


In my opinion crude oil (like many other markets) will have one of the following 3 modes: trending, two-sided volatility, or Choppy/quiet/range bound trading.


My experience is that crude will more often fall into the first 2 categories:  strong trend or two-sided volatility.  This leads me to my next point below, different trading set-ups.


  1. Trading Set-Ups:


My preferred methods for trading crude are either breakout concept in an attempt to catch a strong move up or down once the market broke some key support or resistance levels, AND/OR counter trend methods to take advantage of when the market is oversold or overbought. Crude does seem to bring more fear and greed out of traders. So looking at RSI levels, for example, and using moving averages ON the RSI to try and get a feel for market reversals are methods worth exploring.


  1. Keep a journal:


Like with any other trading, keep a journal. Take notes on how the market reacted to certain reports, how the markets traded during certain times of the day, and action you took and emotions you had that either helped or hurt you while trading. These notes will help you going forward.


In summary, crude oil futures volume has increased significantly these past few years. The crude oil futures offer traders certain dynamics that other markets may not at certain times. Volatility, fear and greed are key traits for this market. Remember that trading crude oil futures specifically and futures and options in general carries a large degree of risk and is not suitable for all investors. Make sure you consult with a series 3 broker if you never traded this market before. As always, I wish you Good Trading!


Important: Trading commodity futures and options involves a substantial risk of loss.

The recommendations contained in this letter are of opinion only and do not guarantee any profits.

There is not an actual account trading these recommendations.

Past performances are not necessarily indicative of future results.

Day Trading Comex Gold Futures – Contrary to Conventional Wisdom

Day Trading Comex Gold Futures

(Contrary to Conventional Wisdom)


By: John Thorpe, Cannon Trading Senior Broker

Markets are forward looking. Today’s price is as much a reflection of yesterday’s fears, needs , wants and desires as the current reaction to a political leader rattling sabers, or the effect that a surprise Government Report  will have on the prices of a security or commodity.

Contrary to conventional wisdom, Day Traders tend to be well educated and well capitalized.

Risk takers, by any other name, Wildcat oil drillers? Computer geeks working out of their parent’s garage? Mom and Pop managing their hard earned 401k’s; The Day trading approach is not very different from any other investing approach, with one major distinction from other risk takers who operate on a much greater time horizon.  As a day trader, you open an investment and close an investment between sunup and sundown and often many times during a market session.  One of the greatest risks that day traders must avoid is gauging their success or failure within that same sunup to sundown time frame. I like to call this a fiction trap. A fiction trap occurs when the day trader believes that once he has a good day trading, his subsequent days will always yield the same results. The fiction trap results in unrealistic expectations for success.  The Market, like the ocean current, is sometimes similar in repetition, but rarely identical in motion. When risk takers begin the process of assessing a strategy, they do it with the long view in mind.

By taking a longer view of returns, like all other risk takers, you can avoid the fiction trap of unrealistic expectations by incorporating the Rule of 72 into your long-range plans. The Rule of 72 is a formula that tells you how quickly (given a rate of return) it will take for your account size to double. Although your account size can double in one day trading futures, it is rare to hold on to those gains. The Rule of 72 forces you to be patient, emotionally subdued, and in line with long-term goals.

As with any risk taking, timing is key. A day trader needs to become:  a scientist, a student of the discipline, a tester, a collector of data, and an executer of plans.

With any project, the scientist keeps good notes and uses the microscope (technical indicators, charts, et al.) to determine the intersections of volume, price. This approach yields more accurate results than a random approach, such as throwing darts at the WSJ securities settlement page to find the correct asset and the correct position. Doing the homework and creating a practical plan should lead to positive results.

I like day trading in the Futures markets because with no more effort than buying a position, you can just as easily sell to open a new position.  In other words, if you have ever sold a stock or ETF short, you know you can short the asset by requesting from the stock loan department shares of a stock to borrow so you can short it.  Now patiently for an uptick to assume your position. This can be a time-wasting exercise when split-second decision making is required.  For this reason and this reason alone, day trading futures makes far greater sense than day trading stocks or ETF’s.


What I want to accomplish with you in this draft is to lay out a blueprint for day trading the NY Comex 100 oz. Gold futures contract, traded electronically through Globex.


 Factors Affecting Gold Prices

As part of the road map to the price discovery process, be aware of the London fixing times, or ocean currents, then can determine our Comex Gold prices. You can find charts and data points available like the one below from the U.S. St Louis Fed

https://fred.stlouisfed.org/series/GOLDAMGBD228NLBM

You may find, upon research, that you have an identifiable price pattern around these times in the Comex market equivalents. Allow your research to guide you. These prices from London represent settlement prices for the fabricators, miners, hedgers and speculators from which they close their daily business dealings.  These fixings are as variable as the US Market prices are for gold. The US Market pays attention to the London market, and although not fungible, they are interchangeable in price discovery. London watches Comex and Comex watches London. The auctions are run at 10:30am and 3:00pm London Time for gold and 12:00pm London time for silver. The final auction prices are published to the market as the LBMA Gold Price AM, The LBMA Gold Price PM and the LBMA Silver Price Benchmarks.

Scarcity or the perception of scarcity and lack thereof drives market sentiment.

Markets are forward looking. Today’s   price is as much a reflection of yesterday’s fears as anything else. So we need to anticipate market price impact from Governmental reports, increases and decreases in potential supply or demand,

Central banks have quite a bit to do with the value of the “Yellow Metal” based on how they perceive the underlying economy’s strengths and weaknesses and whether they print money or not, by increasing or decreasing the velocity of the sovereign nations’ cash supply.  When a Central bank adjusts the Nation’s supply of dollars of their native currency, Gold will typically behave reciprocally: More dollars in circulation, value of gold increases, fewer dollars in circulation, the value of gold decreases.

During large chunks of the 20th century, the world’s central banks were net suppliers of gold. After spending their early history accumulating gold to back up national currencies, central banks sold more gold than they purchased after the U.S. dollar became the de facto world reserve currency under the Bretton Woods Agreement.

In recent years, however, the trend has changed. Central banks have become net demanders of gold, which puts upward pressure on both production and retail costs. As some sovereign currency markets are in a constant to variable state of flux and turmoil due to political upheaval or disequilibrium in their balance of trade and payments, investors residing in these countries buy gold to use as a safe haven asset to offset the risk of holding their assets in their sovereign currency.

As with any worthwhile endeavor, a true student of any process understands addtional  research should be done to thoroughly understand the potential  risks and rewards from either day trading or position trading, or with equal vigor, engaging in short term or longer term investing of any kind.

As Greek philosopher Aristotle thoughtfully observed and written for us to learn from over 2000 years ago,  “Bring your desires down to your present means. Increase them only when your increased means permit.”

Pic3

What Aristotle was saying (as it applies to investing) is to use risk capital only. Risk capital is capital that, if lost in the pursuit of reward, will not impact negatively your ability to take care financially of any of your current obligations, nor will it negatively impact your current lifestyle. This statement is also true for day traders to focus on the risk they are taking on in their own accounts. Just because you had a few good days trading doesn’t necessarily mean you should put more of your account at risk and increase the size of your trades exponentially. This happens all too often and turns successful day traders into unsuccessful traders in the intermediate term, and in many cases these traders end their trading because what was once a growing account with a tempered approach becomes one great big washout.

  1. No distractions, clear the table, shut the door, unplug your devices-FOCUS
  2. Perspective- where has the market been ( long term and intermediate term charts and try to identify the reason for large price moves in either direction
  3. Just because the market is open 23 hours, don’t try to physically trade the market for 23 hours, your money will burn out faster than you will. A quote I like is “the Market can remain irrational for longer than I can be solvent”
  4. Define your daytrading timeframe. (for example: 8am-10am, 2pm-4 pm), set it, and stick to it for at least 30 trading days. Markets have the tendency to behave similarly day in and day out during the same time frames. Remember, like currents in an ocean, markets are sometimes similar in repetition, but rarely identical in motion.
  5. Research – Know the market you are trading. Research it, understand what makes it move. Who the players are in the cash market.
  6. Stay informed – Know the recent daily dollar volatility of the market you are trading. I like to take the past 30 to 45 days for the Aug  Comex 100oz Gold contract. For example, I recently used 30 trading days and arrived at $1220.00. I took the distance between the high and low of each full day, totaled them, added 30 data points together for an average daily range and multiplied that by the value of a tick in the gold  ($10.00)
  7. With my trading platform I have the ability to adjust the time frame to include only the time I  have set aside to view the market. In my research I  will also have a full daily chart

Pic4

a weekly chart

Pic5

And a monthly chart

Pic6

of August Comex Gold  which will show me the critical areas of technical support that I can apply intraday to my abbreviated chart.

Pic7

Why is dollar volatility Important? (see above) – You can manage your expectations here; you now know you shouldn’t expect to make 2,000.00 on a single trade and you can better gauge how many contracts, and how much risk you can take, on each trade. You now have a template of recent activity to better judge expected volatility without having to utilize an expensive add-on or chart indicator.

8) Call – Please speak with your broker on the phone to determine the appropriate amount of risk capital you need to trade your plan in the Gold Futures Market.

The Comex Gold Contract trades in Chicago through a registered Broker. www.cannontrading.com

Gold Contract specs are as follows:

Quoted in Dollars and Cents per Troy OZ.

Minimum price fluctuation: $0.10 per troy oz.

Symbol GC or GGC

Initial margin requirement: $3,410.00

Maintenance requirement: $3,100.00

Hours traded: 6pm EST Sunday, through to Friday at 5pm EST with an hour break each day between 5pm and 6 pm EST

As always, lean on your broker for guidance, call him or her and discuss what your risk tolerance levels are. Where to use stop loss orders or options to hedge your trading plan to ensure you leave yourself with a fighting chance.

Disclaimer: Trading commodity futures and options involves a substantial risk of loss.

The recommendations contained in this letter are of opinion only and do not guarantee any profits.

There is not an actual account trading these recommendations.

Past performances are not necessarily indicative of future results.


Which Market Should I (day) Trade? + Support & Resistance Levels 5.21.2018.. #ZW_F #ES_F #NQ_F #RTY_F #SI_F #GC_F #CL_F

____________________________________________________________________

Voted #1 Blog and #1 Brokerage Services on TraderPlanet for 2016!!  

____________________________________________________________________

Dear Traders,
Which Market Should I be (day) Trading?
1. Know and follow more than one market. I think one should have familiarity and follow about 5 different markets ( or more depending account size and time) in general.
2. Understand what type of market conditions you trade better in? Volatile? “dead”, choppy or perhaps trending?
3. Have a view of these markets from longer term outlook and behavior.
4. Trade the markets that fit your strengths.
 
Example: If I am following gold, crude, bonds, mini nasdaq and mini SP for educational purposes….If I know that I trade better in markets that have larger intraday swings and volatility than lets say trending markets or “quiet markets” I would be focusing on the mini NASDAQ as my primary market now days as it is the one fitting my profile the best.
 
If “choppy” markets suits my trading style better, I would probably look at gold as of recently.
 
This will change as markets go through different cycles, from lower volatility to higher volatility. Trending to choppy etc. 
 
Etc. etc. etc. 

If you like to set up a time and chat with a licensed series 3 broker, please contact us.

Continue reading “Which Market Should I (day) Trade? + Support & Resistance Levels 5.21.2018.. #ZW_F #ES_F #NQ_F #RTY_F #SI_F #GC_F #CL_F”

Day Trading Crude Oil Futures & Levels 4-18-2018

____________________________________________________________________

Voted #1 Blog and #1 Brokerage Services on  TraderPlanet   for 2016!!

____________________________________________________________________

Dear Traders,

With the energy numbers coming out tomorrow, which impact crude oil quite a bit, I thought it would be a good time to share this article I wrote once again:

Crude Oil Futures volatility offers a “different market personality” than stock index futures. Here is some of the things you need to know about day trading crude oil futures:
By: Ilan Levy-Mayer, Cannon Trading Commodities Broker & VP

Crude Oil is one of MY favorite futures market for day trading. Before I dive in and share with you how the volatility in crude oil fits my risk tolerance for day trading and provide a couple of chart examples, we should review some of the specifications of Crude Oil Futures.

Crude Oil Futures have monthly expiration. So each month we trade a different contract month, so one needs to know when is the first notice day and last trading day for crude oil futures in order to always make sure we are trading the proper month with the most liquidity and avoid any chance of getting into delivery situation.

Continue reading “Day Trading Crude Oil Futures & Levels 4-18-2018”