
Different Markets for Day Trading, March Bitcoin

|
|
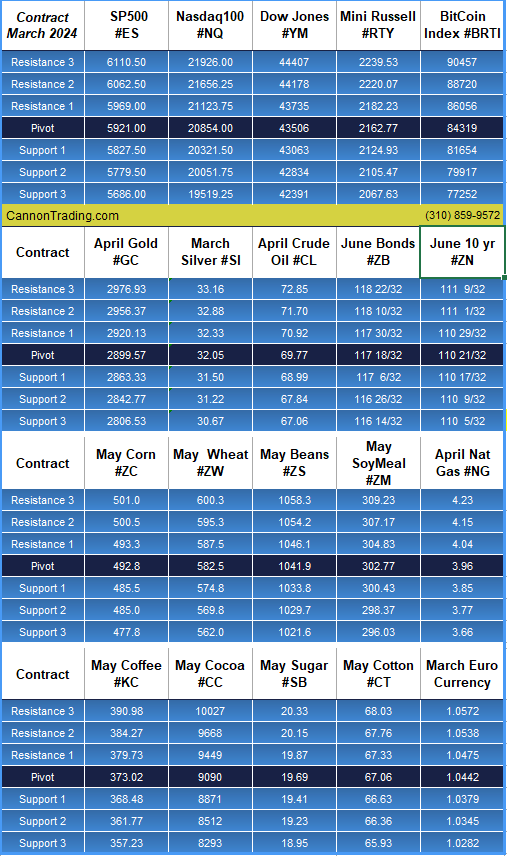
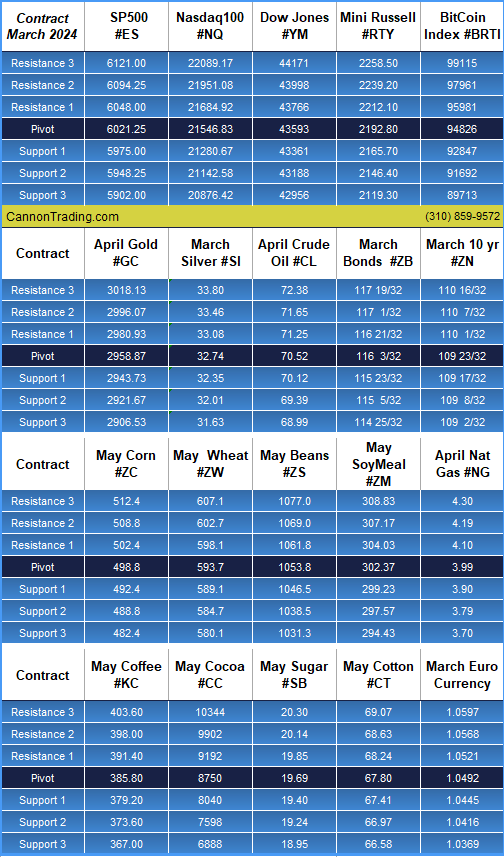
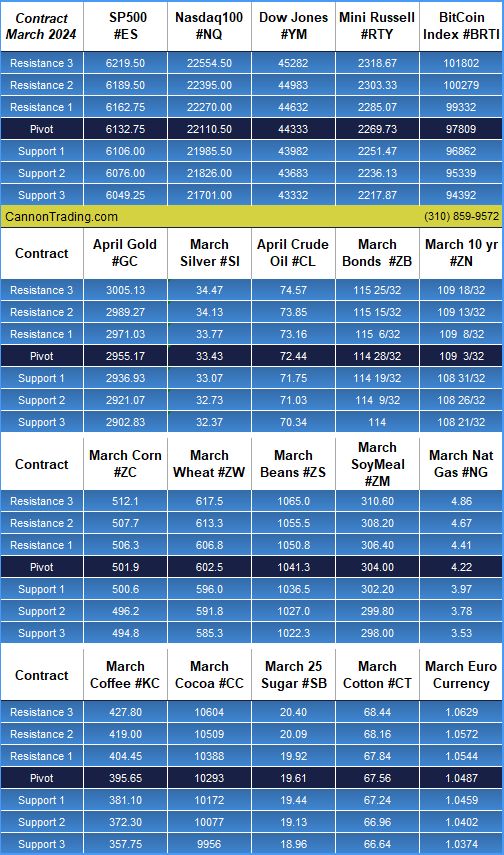
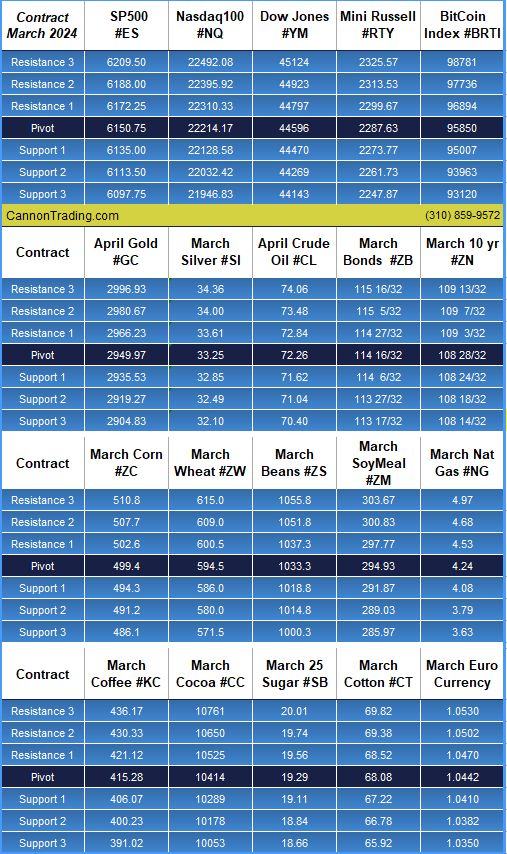
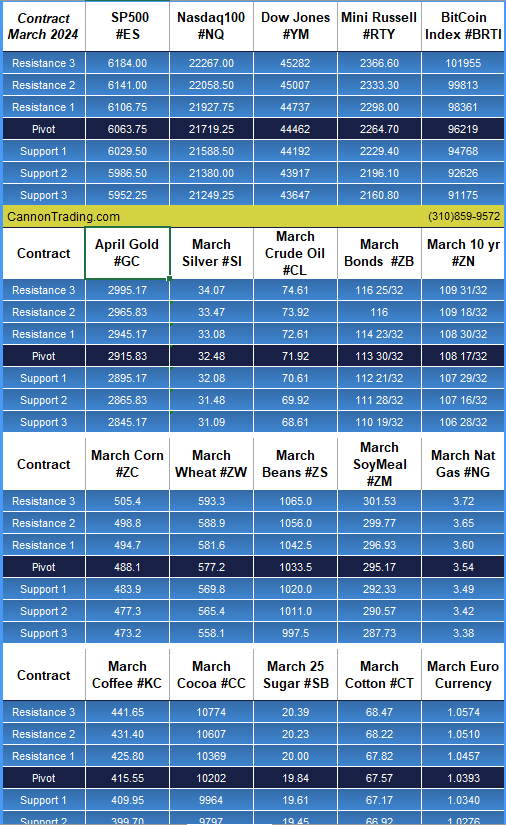
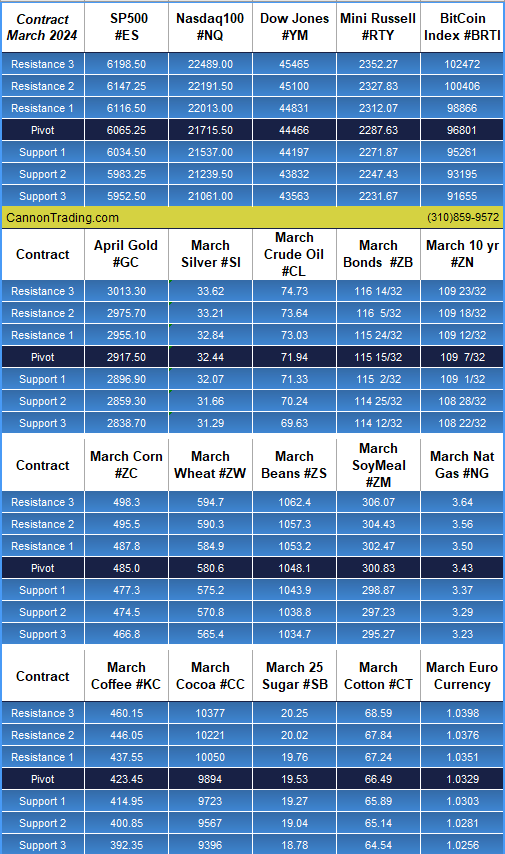
Daily Levels for February 28th, 2025

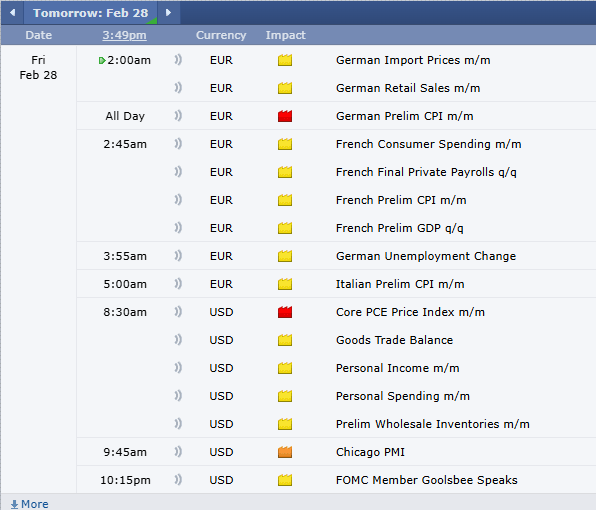
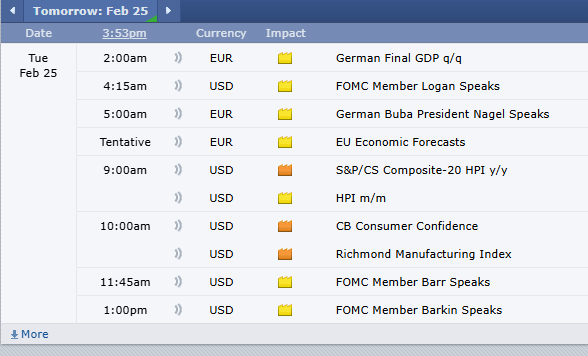
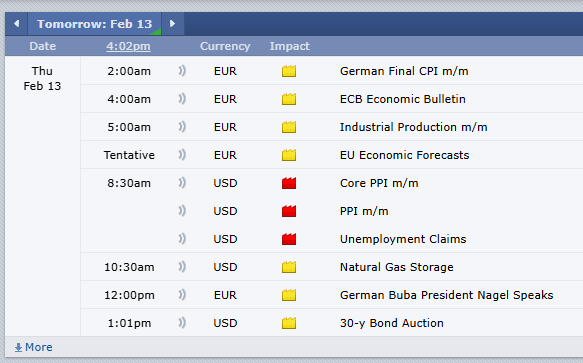
Economic Reports
provided by: ForexFactory.com
All times are Eastern Time (New York)
|
||||||||||||||||||||||||||||
|
||||||||||||||||||||||||||||
|


|
|


provided by: ForexFactory.com
All times are Eastern Time (New York)

|
||||||||||||||||||||||||||||
|
||||||||||||||||||||||||||||
|


|
|
provided by: ForexFactory.com
All times are Eastern Time ( New York)
|
||||||||||||||||||||||||||||
|
||||||||||||||||||||||||||||
|


|
|
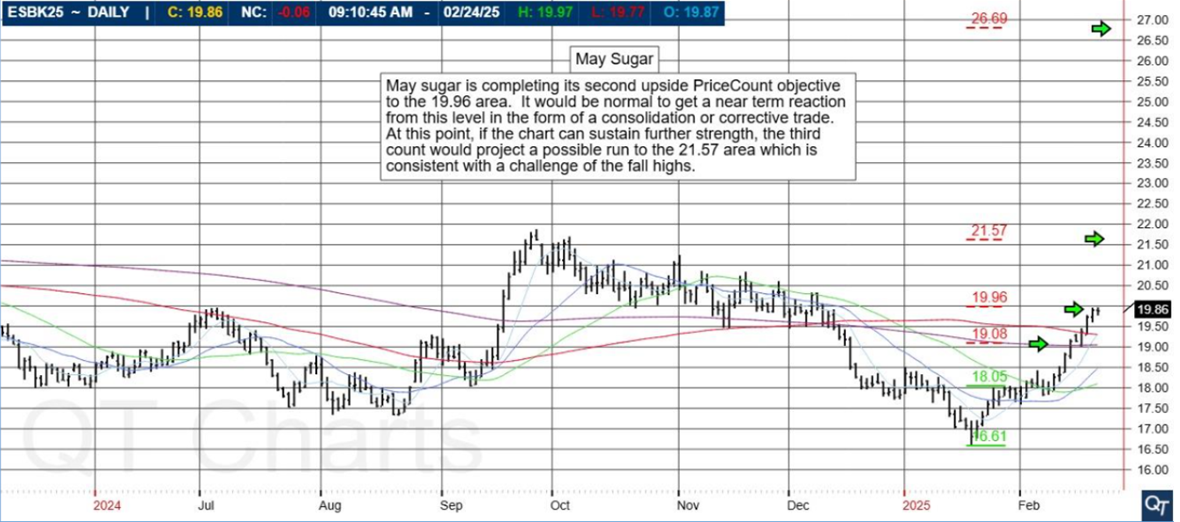
May Sugar Chart for your review below!
May sugar is completing its second upside PriceCount objective to the 19.96 area. It would be normal to get a near term reaction from this level in the form of a consolidation or corrective trade. At this point, if the chart can sustain further strength, the third count would project a possible run to the 21.57 area which is consistent with a challenge of the fall highs.


provided by: ForexFactory.com
All times are Eastern Time (New York)

|
||||||||||||||||||||||||||||
|
||||||||||||||||||||||||||||
|


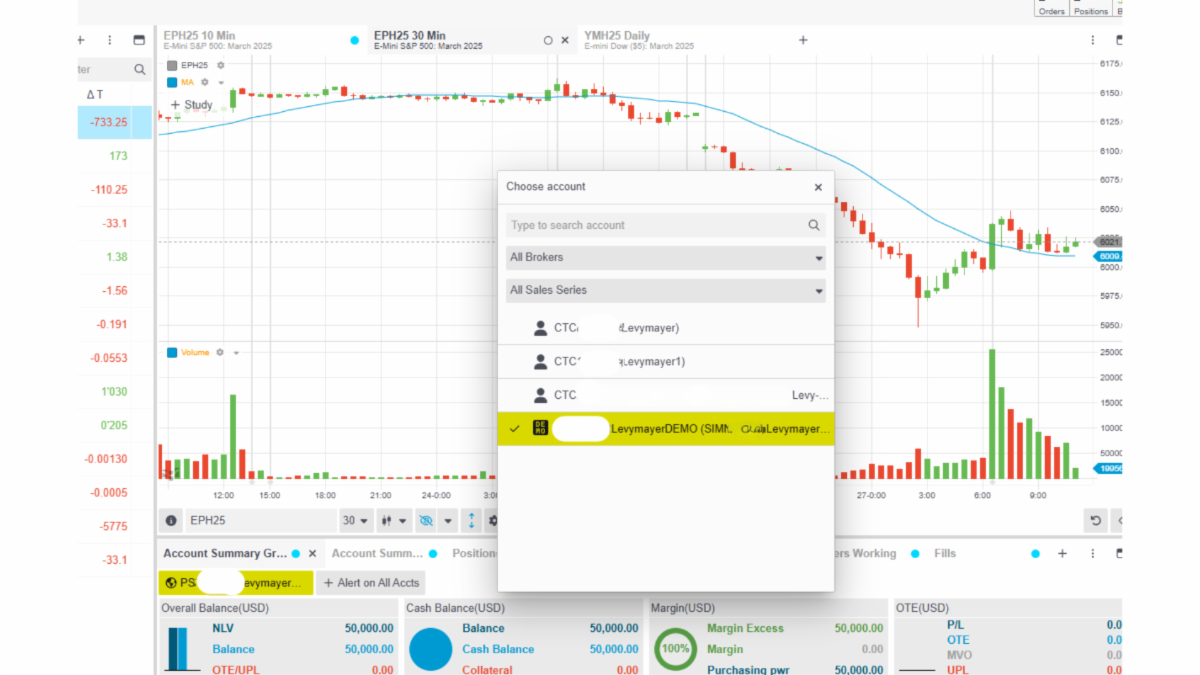
This permanent demo is available to all clients using the StoneX futures ( CQG desktop) platform as long as you have a balance.
If you live account is subscribed to live data, your demo will also have live data.
Demo data will run off the market data subscriptions you have.
See example below:
Login to your live trading account: https://m.cqg.com/stonexfutures
In the upper right corner, you should be able to click on your account number and select the demo account, which will be highlighted in yellow.
|
|

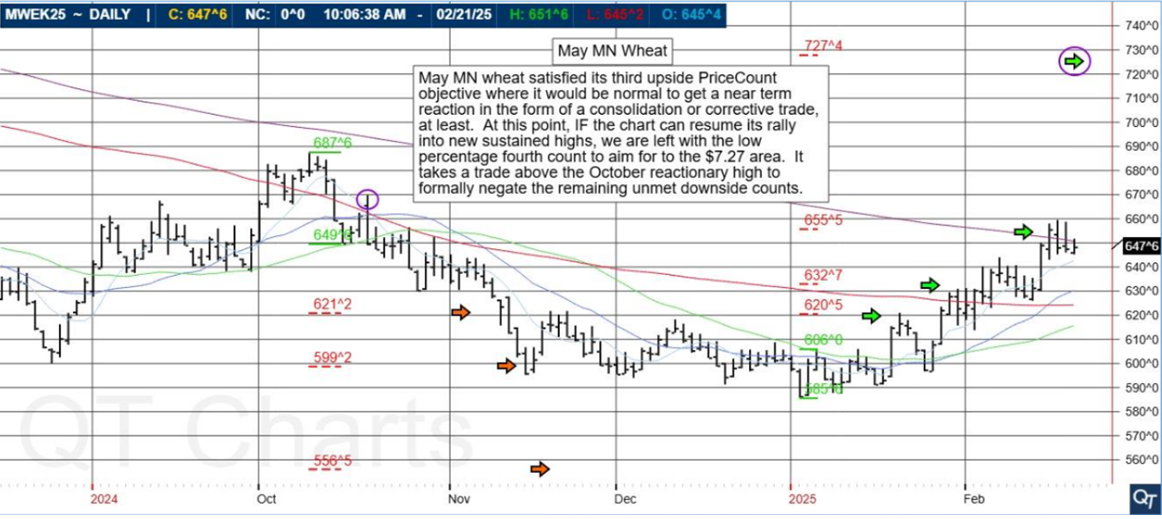
Hot market of the week is provided by QT Market Center, A Swiss army knife charting package that’s not just for Hedgers, Cooperatives and Farmers alike but also for Spread traders, Swing traders and shorter time frame application for intraday traders with a unique proprietary indicator that can be applied to your specific trading needs.
May MN wheat satisfied its third upside PriceCount objective where it would be normal to get a near term reaction in the form of a consolidation or corrective trade, at least. At this point, IF the chart can resume its rally into new sustained highs, we are left with the low percentage fourth count to aim for to the $7.27 area. It takes a trade above the October reactionary high to formally negate the remaining unmet downside counts. That’s May MN Wheat!
PriceCounts – Not about where we’ve been, but where we might be going next!
|
|
|
|
|
|
||||||||||||||||||||||||||||
|
||||||||||||||||||||||||||||
|


It has been a volatile short trading week post President’s Day long weekend.
Wild swings across the board with softs and metals leading the way.
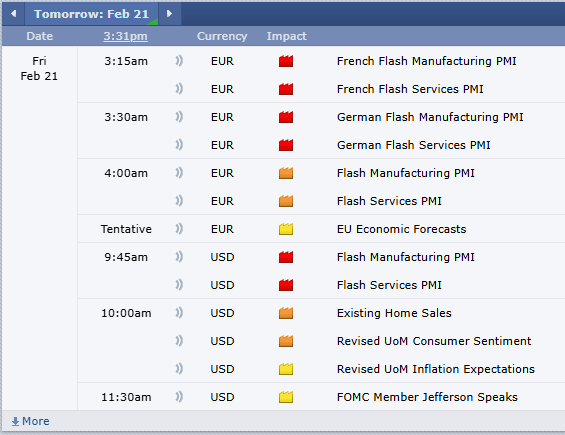
Tomorrow we have new home sales, flash PMI and University of Michigan reports which will be watched closely for the inflation outlook.
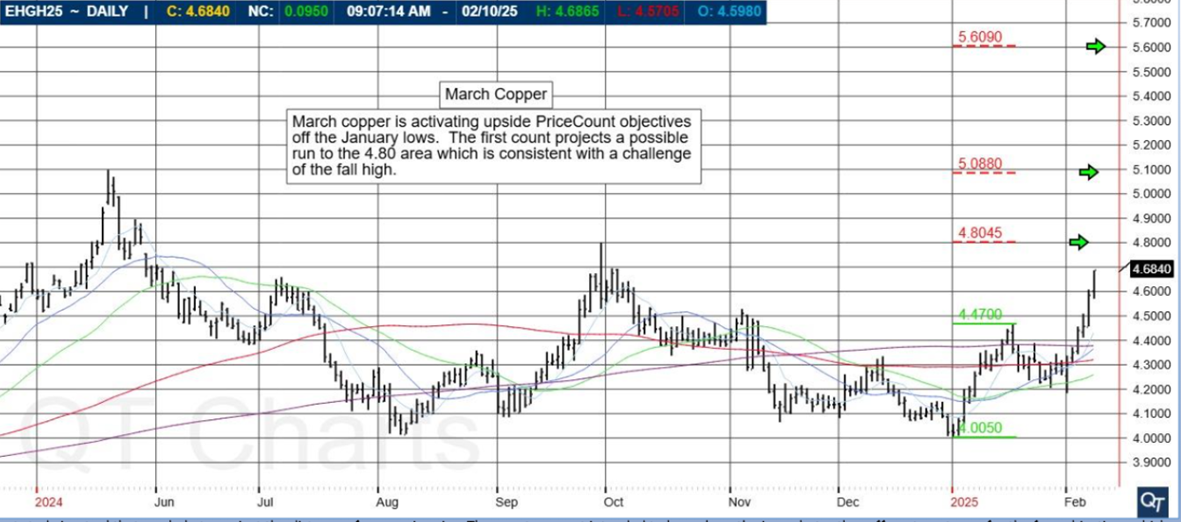
Watch both natural gas and copper as these markets are establishing a tend to the upside.
| Would you like to get real
time news and markets outlook via videos updates daily? Simply visit us on our market research section. FREE to clients and prospects! |
| Daily Updates & Market Research |


provided by: ForexFactory.com
All times are Eastern Time (New York)
|
||||||||||||||||||||||||||||
|
||||||||||||||||||||||||||||
|


Bullet Points, Highlights, Announcements
Indexes:
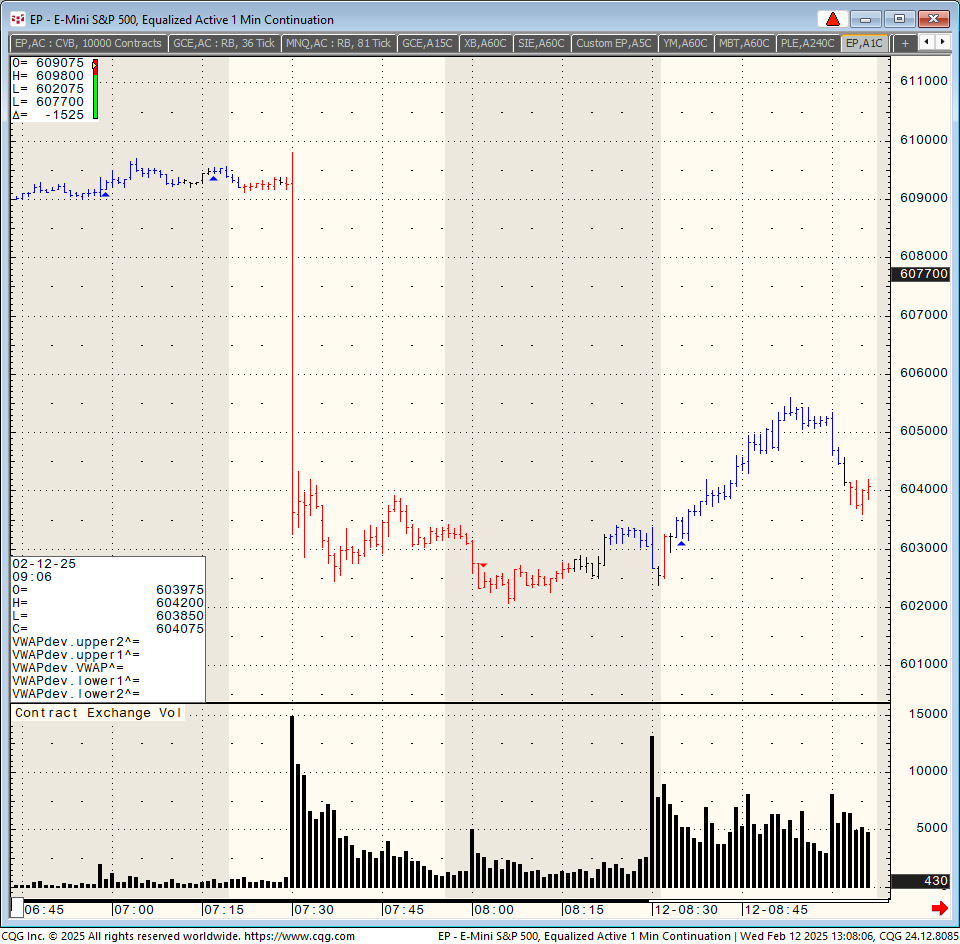
The March E-mini S&P 500 traded within striking distance of its life-of-contract high posted back on Dec. 4th and 6th (6164.00) breaching that price intraday with a 6166.50 print and closing today at 6163.00
Energy:
Oil prices rose on Wednesday, extending gains to a third-consecutive session amid growing supply worries.
March futures for West Texas Intermediate Crude traded briefly above $73.00 per barrel, a ±75 intraday increase and trading up ± 46 cents per barrel at ±$72.31.
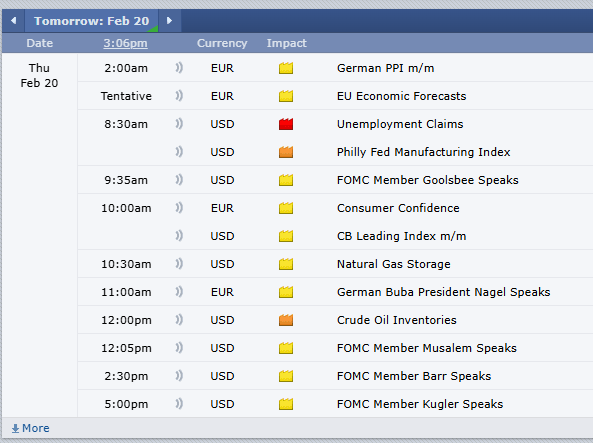
If you missed it, EIA Energy Stocks were NOT released today, as is usual. Due to the Presidents’ Day holiday, the report will be release tomorrow, 30 minutes after the EIA Gas Stocks report: 7:30 A.M., Central Time (gas), 8:00 A.M. (energy).
Metals:
Gold prices wavered near unchanged at this blog’s submission after trading ±$15 above and below yesterday’s settlement and near its all-time highs near $2,950 per ounce.
Fueling safe-haven demand for the precious metal, the Trump administration plans to impose tariffs of around 25% on U.S. bound autos and auto-building components, semiconductors and pharmaceuticals as early as April 2.
April gold futures have gained about 12% so far this year, with analysts expecting higher prices in a trade war. On Monday, Goldman Sachs raised its year-end 2025 gold price forecast to $3,100 per ounce.

provided by: ForexFactory.com
All times are Eastern Time (New York)
|
||||||||||||||||||||||||||||
|
||||||||||||||||||||||||||||
|
The corn futures contract remains one of the most actively traded agricultural commodities in the futures markets. As global demand for corn continues to rise due to its essential role in food production, animal feed, and ethanol production, futures traders seeking profitable opportunities often turn to corn futures as a key component of their portfolio.
Extreme weather conditions are expected to continue affecting global corn production. Unpredictable droughts and flooding could lead to significant price swings in corn futures contracts.
The global push for renewable energy sources will likely keep ethanol demand high, increasing the need for corn as a primary biofuel ingredient.
Fertilizer and transportation costs have been climbing, impacting production expenses and potentially pushing corn prices higher in 2025.
The U.S.-China trade relationship remains a key factor. Tariffs or trade barriers could significantly impact corn exports and futures prices.
Historically, corn futures contracts have shown cyclical patterns influenced by weather conditions, government policies, and technological advancements in agriculture. The 2012 drought, for example, caused record-high prices, while increased yields in the following years led to price stabilization. Other crop futures contracts, such as wheat and soybeans, have followed similar trends, often correlating with corn prices due to their shared agricultural and economic factors.
For traders looking to engage in futures contract trading, selecting a reputable futures trading broker is essential. Cannon Trading Company stands out for several reasons:
The corn futures contract presents numerous opportunities for profit in 2025. By staying informed on market trends, monitoring key reports, and partnering with a reputable futures trading broker like Cannon Trading Company, traders can navigate the complexities of futures contract trading with confidence.
For more information, click here.
Ready to start trading futures? Call us at 1(800)454-9572 – Int’l (310)859-9572 (International), or email info@cannontrading.com to speak with one of our experienced, Series-3 licensed futures brokers and begin your futures trading journey with Cannon Trading Company today.
Disclaimer: Trading Futures, Options on Futures, and retail off-exchange foreign currency transactions involve substantial risk of loss and are not suitable for all investors. Past performance is not indicative of future results. Carefully consider if trading is suitable for you in light of your circumstances, knowledge, and financial resources. You may lose all or more of your initial investment. Opinions, market data, and recommendations are subject to change at any time.
Important: Trading commodity futures and options involves a substantial risk of loss. The recommendations contained in this article are opinions only and do not guarantee any profits. This article is for educational purposes. Past performances are not necessarily indicative of future results.
This article has been generated with the help of AI Technology and modified for accuracy and compliance.
Follow us on all socials: @cannontrading
Gold futures have long been a cornerstone of the commodities market, providing traders with opportunities to hedge against inflation, speculate on price movements, and diversify their portfolios. As we move into 2025, the landscape of gold futures trading continues to evolve due to economic trends, geopolitical events, and shifts in monetary policy. Whether you are an experienced futures trader or a newcomer looking to explore futures contract trading, understanding the key elements of the market is crucial.
This guide will cover:
10 Tips for Trading Gold Futures in 2025
To succeed in trading futures, it is essential to grasp the fundamental factors that drive gold futures prices. These include:
Gold often moves inversely to the U.S. dollar. A strong dollar typically puts downward pressure on gold futures prices, while a weaker dollar can push prices higher. Monitoring the DXY can provide critical insights for futures gold traders.
The Federal Reserve’s decisions on interest rates have a direct impact on gold futures trading. Lower interest rates make gold more attractive as a non-yielding asset, driving up demand. Traders should follow Fed announcements and adjust their futures trading strategies accordingly.
Inflation is one of the strongest catalysts for gold futures price movements. Traders should monitor reports such as:
Gold has historically followed seasonal patterns. For example, demand tends to rise in the fall and winter due to increased jewelry purchases and economic uncertainty. Recognizing these patterns can improve trading futures strategies.
Successful futures traders rely on technical indicators to determine when to enter or exit a gold futures contract. Key indicators include:
Risk management is critical in futures trading. Traders should use stop-loss orders to protect their positions from excessive losses in volatile markets.
Trading a gold futures contract requires margin, which can fluctuate based on market volatility. Understanding margin requirements from a futures trading broker like Cannon Trading Company ensures proper capital allocation.
Many central banks buy and hold gold as a reserve asset. Increases in central bank gold purchases can signal higher gold futures prices.
A reliable futures trading broker is essential for success in futures contract trading. Cannon Trading Company stands out due to its top-performing trading platforms, excellent regulatory standing, and 5 out of 5-star ratings on TrustPilot.
Persistent inflation and potential recessions will likely drive investors toward futures gold as a safe-haven asset. Traders should be prepared for increased volatility.
The rise of tokenized gold and blockchain-based trading platforms is making gold more accessible to retail traders. These innovations may impact gold futures contract liquidity and pricing dynamics.
Ongoing geopolitical tensions, particularly involving global superpowers, could lead to increased demand for gold futures as investors seek stability.
With growing interest in environmental, social, and governance (ESG) investing, ethical mining practices could influence gold futures pricing and availability.
More futures traders are using algorithmic strategies to capitalize on market inefficiencies, making futures contract trading increasingly data-driven.
A strong jobs report can strengthen the dollar, which may drive gold futures prices lower. Conversely, weak employment data can push prices higher.
Understanding the Fed’s stance on monetary policy is crucial for trading futures effectively.
These reports offer insight into inflation trends that impact gold futures trading.
Quarterly reports from the World Gold Council provide valuable insights into demand, supply, and investment trends for futures gold.
This report shows how hedge funds and commercial traders are positioned in gold futures, helping traders gauge market sentiment.
Historically, gold futures have demonstrated resilience during economic uncertainty. The 2008 financial crisis saw gold futures prices surge due to panic-driven buying. More recently, gold hit all-time highs in 2020 amid pandemic fears. Silver, platinum, and palladium futures also tend to follow similar trends but with higher volatility.
Choosing the right futures trading broker is essential for long-term success. Cannon Trading Company offers a superior experience for futures traders with:
From NinjaTrader to Tradestation, Cannon provides access to cutting-edge tools for trading futures efficiently.
With a legacy of expertise, Cannon Trading Company helps traders navigate futures contract trading with confidence.
Cannon Trading is known for its compliance with the National Futures Association (NFA) and the Commodity Futures Trading Commission (CFTC), ensuring traders work with a reputable firm.
With 5 out of 5-star ratings on TrustPilot, traders consistently praise Cannon’s responsiveness and expert support.
Whether you are a beginner or an advanced futures trader, Cannon Trading Company provides tailored resources to enhance your futures gold trading strategies.
Gold futures trading in 2025 presents a wealth of opportunities and risks. By understanding market fundamentals, tracking economic indicators, and choosing the right futures trading broker, traders can maximize their potential in futures contract trading
With a strong historical track record, evolving market trends, and the support of a top-tier futures trading broker like Cannon Trading Company, traders can confidently navigate the complexities of the futures gold market.
For more information, click here.
Ready to start trading futures? Call us at 1(800)454-9572 – Int’l (310)859-9572 (International), or email info@cannontrading.com to speak with one of our experienced, Series-3 licensed futures brokers and begin your futures trading journey with Cannon Trading Company today.
Disclaimer: Trading Futures, Options on Futures, and retail off-exchange foreign currency transactions involve substantial risk of loss and are not suitable for all investors. Past performance is not indicative of future results. Carefully consider if trading is suitable for you in light of your circumstances, knowledge, and financial resources. You may lose all or more of your initial investment. Opinions, market data, and recommendations are subject to change at any time.
Important: Trading commodity futures and options involves a substantial risk of loss. The recommendations contained in this article are opinions only and do not guarantee any profits. This article is for educational purposes. Past performances are not necessarily indicative of future results.
This article has been generated with the help of AI Technology and modified for accuracy and compliance.
Follow us on all socials: @cannontrading

|
|

provided by: ForexFactory.com
All times are Eastern Time (New York)
|
||||||||||||||||||||||||||||
|
||||||||||||||||||||||||||||
|


|
|

provided by: ForexFactory.com
All times are Eastern Time ( New York)

|
||||||||||||||||||||||||||||
|
||||||||||||||||||||||||||||
|