Bullet Points, Highlights, Announcements  + Levels for April 24th

Get Real Time updates and more by joining our Private Facebook Group!
Subscribe to our YouTube Channel


C37

Bullet Points, Highlights, Announcements   

by Mark O’Brien, Senior Broker

General:  


Futures traders with positions in deliverable futures contracts keep an eye on the calendar for important dates at the end of the month. First Notice Day (FND) and Last Trading Day (LTD) for many futures contracts are close at hand. Make sure you steer safely clear of receiving delivery notices for physical commodities (FND), or greatly reduced liquidity (LTD). If you’re unsure, contact your Cannon Trading Co. broker.


The economic calendar for the rest of the week is scarce with Thursday’s Q1 GDP report taking center stage.


Prospects for a fed rate cut announcement at the Fed’s 4/30-5/1 meeting, as well as its mid-June meeting have all but evaporated and many Fed watchers expect the central bank to keep its “higher for longer” mantra in place for most and possibly all of 2024.


Worries over a wider Middle East conflict have subsided and traders are discounting the risk of further escalations. Case in point, June gold lost ±67 per ounce (±2%) yesterday after posting its latest all-time record high close of $2,413.80/ounce on Friday. Iran downplayed Israel’s retaliatory drone strike against it, in what appeared to be a move aimed at averting regional escalation.


Energies: 


  • The ±$2.50/barrel selloff in May crude oil and the ±¢9.75/gallon May RBOB gasoline futures last week likely signaled the markets do not see an Iranian supply disruption in the near future, so the markets will be given to focusing on global energy demand going forward

47489e7c 5065 45b3 8e85 55c7ad3a0f3e


Softs:  


May Cocoa futures declined sharply yesterday and today, down nearly $1,300/ton (a $13,000 per contract move) marking its worst two-day slump since February. This after a 3-day / Wed.-Fri. rally of $1,635/ton to its all-time record high close of 11,878/ton on Friday. ICE U.S. has set the initial margin requirement to $11,260 per contract.

stars

e35cb555 9ff3 4f00 9fe8 0655b28fbd90

Daily Levels for April 24th, 2024

b8b30c15 9c5e 43f1 858e 25ebcd94928e

thumbnail?url=http%3A%2F%2Fi.ytimg.com%2Fvi%2FJnHAMUGdNoM%2Fhqdefault

Economic Reports
provided by: ForexFactory.com
All times are Eastern Time ( New York)
f4aacb3b d0e3 45f4 82bf 45cec9587768

Improve Your Trading Skills

Get access to proprietary indicators and trading methods, consult with an experienced broker at 1-800-454-9572.

Explore trading methods. Register Here

3b644da2 2bee 4d39 8d98 5208a20bec39

* This is not a solicitation of any order to buy or sell, but a current market view provided by Cannon Trading Inc. Any statement of facts here in contained are derived from sources believed to be reliable, but are not guaranteed as to accuracy, nor they purport to be complete. No responsibility is assumed with respect to any such statement or with respect to any expression of opinion herein contained. Readers are urged to exercise their own judgement in trading.

Markets Post CPI + Levels for April 11th

Get Real Time updates and more by joining our Private Facebook Group!
Subscribe to our YouTube Channel


C31


Life After CPI …..

by Mark O’Brien, Senior Broker

General:


It’s been ten months since the central bank paused its rate hike cycle.  It seems as though Jay Powell’s motto throughout his entire tenure as chairman of the Fed has been, “The data will guide our decisions,” and today the Bureau of Labor Statistics released another chunk of data: its March Consumer Price Index (CPI) report, which measures the prices paid by consumers for a basket of consumer goods and services.  The consumer-price index rose 0.4% in March and 3.5% on an annual basis.  Economists had expected 0.3% and 3.4%.  Core CPI, which removes the volatile food and energy categories, was up 0.4% from February, topping an expected 0.3%.  Now, after strong prints in January and February, are these new readings stronger evidence of a “sticky” inflation situation?


At their March meeting, according to its minutes released later this morning, Federal Reserve officials expressed concern that inflation wasn’t moving lower quickly enough.  The CPI report likely didn’t moderate those concerns and the timing for the first long-anticipated rate cut has presumably drifted further out on the calendar.


Energies: 


Speaking of inflation, the first three months of 2024 saw crude oil jump ±$17 per barrel – a ±$17,000 move for the main 1,000-barrel futures contract – with the front-month May contract trading to the year’s high of $87.63 intraday just last Friday.


Softs: 


After a one-day 321-point/$3,210 move up on March 12 to close above $7,000/ton – its latest all-time high – May cocoa continued its “no top in sight,” rally, closing today at $10,476/ton, a staggering ±$34,700 per contract move in twenty trading sessions.


Metals:  


While cocoa retained its “king of the all-time highs” crown for the month, gold did not disappoint bulls in this market, setting its own new all-time high yesterday, trading up to $2,384.50/oz. intraday (basis the June futures contract).  This is a $199.00/oz. move ($19,900 per contract for the standard 100-oz. futures contract) over the same 20-sesson span as the move in cocoa referenced above.


Grains: 


Keep an eye out for tomorrow’s U.S. Department of Agriculture’s two main reports: its monthly Crop Production and World Agricultural Supply and Demand Estimates (WASDE). These serve as the primary informers of the fundamentals underlying domestic and global agricultural futures markets.


stars

e35cb555 9ff3 4f00 9fe8 0655b28fbd90

Daily Levels for April 11th, 2024

0777cab0 1a21 4376 9482 bc395ecdccaf

thumbnail?url=http%3A%2F%2Fi.ytimg.com%2Fvi%2FJnHAMUGdNoM%2Fhqdefault

Economic Reports
provided by: ForexFactory.com
All times are Eastern Time ( New York)
a6273151 d609 4ded 8856 a663e620f095

Improve Your Trading Skills

Get access to proprietary indicators and trading methods, consult with an experienced broker at 1-800-454-9572.

Explore trading methods. Register Here

3b644da2 2bee 4d39 8d98 5208a20bec39

* This is not a solicitation of any order to buy or sell, but a current market view provided by Cannon Trading Inc. Any statement of facts here in contained are derived from sources believed to be reliable, but are not guaranteed as to accuracy, nor they purport to be complete. No responsibility is assumed with respect to any such statement or with respect to any expression of opinion herein contained. Readers are urged to exercise their own judgement in trading.

Weekly Newsletter: Notional Value, May Copper Outlook & Trading Levels for April 8th

Get Real Time updates and more by joining our Private Facebook Group!
Subscribe to our YouTube Channel

C38

Cannon Futures Weekly Letter Issue # 1188

In this issue:
  •  Important Notices – Earnings Season Starts April 12th
  • Trading Resource of the Week – About Contract Notional Value
  • Hot Market of the Week – May Copper
  • Broker’s Trading System of the Week – RBOB Swing System
  • Trading Levels for Next Week
  • Trading Reports for Next Week


Important Notices –

  • Market Moving Data Wed. /Thur.  CPI and PPI respectively , w/Jobless Claims Thur. as well
  • 1 Fed discussion RE: new BASEL lll requirements Wed. AM (raises min. Cap Req from 2% to 4.5% for all banks)
  • AG WASDE Thur.
  • Q1 Earnings Season Begins Fri. the 12th Bank Earnings, JPM, C, WFC, BLK all report on this day.


Trading Resource of the Week : About Contract Notional Value by CMEgroup.com

Contract Unit
The contract unit is a standardized size unique to each futures contract and can be based on volume, weight, or a financial measurement, depending on the contract and the underlying product or market.
For example, a single COMEX Gold contract unit (GC) is 100 troy ounces, which is measured by weight.
A NYMEX WTI Crude Oil contract unit (CL) is 1,000 barrels of oil, measured by volume.
The E-mini S&P 500 contract unit (ES) is a financial calculation based on a fixed multiplier times the S&P 500 Index.
Contract Notional Value
Contract notional value, also known as contract value, is the financial expression of the contract unit and the current futures contract price.
Determining Notional Value
Assume a Gold futures contract is trading at price of $1,000. The notional value of the contract is calculated by multiplying the contract unit by the futures price.
Contract unit x contract price = notional value
100 (troy ounces) x $1,000 = $100,000
If WTI Crude Oil is trading at $50 dollars and the contract unit is 1000 barrels, the notional would be;
$50 x 1,000 = $50,000
Now assume E-mini S&P 500 futures are trading at 2120.00. The multiplier for this contract is $50.
$50 x 2120.00 = $106,000


stars

3b644da2 2bee 4d39 8d98 5208a20bec39


  • Hot Market of the Week – May Copper
Hot market of the week is provided by QT Market Center, A Swiss army knife charting package that’s not just for Hedgers, Cooperatives and Farmers alike but also for Spread traders, Swing traders and shorter time frame application for intraday traders with a unique proprietary indicator that can be applied to your specific trading needs.
May Copper
May copper is completing its third upside PriceCount objective that is consistent with a challenge of the contract high. It would be normal to get a reaction in the form of a near term consolidation or corrective trade, at least, from this level. From here, IF the chart can sustain further gains, we are left with the low percentage fourth upside count to the 4.94 area to aim for (not shown here for presentation purposes).
PriceCounts – Not about where we’ve been , but where we might be going next!
26a5ed14 ac68 4e3d 87d7 32b6f353a42b
The PriceCount study is a tool that can help to project the distance of a move in price. The counts are not intended to be an ‘exact’ science but rather offer a target area for the four objectives which are based off the first leg of a move with each subsequent count having a smaller percentage of being achieved. It is normal for the chart to react by correcting or consolidating at an objective and then either resuming its move or reversing trend. Best utilized in conjunction with other technical tools, PriceCounts offer one more way to analyze charts and help to manage your positions and risk. Learn more at www.qtchartoftheday.com
Trading in futures, options, securities, derivatives or OTC products entails significant risks which must be understood prior to trading and may not be appropriate for all investors. Past performance of actual trades or strategies is not necessarily indicative of future results.
  • Broker’s Trading System of the Week

With algorithmic trading systems becoming more prevalent in portfolio diversification, the following system has been selected as the broker’s choice for this month.
PRODUCT
SYSTEM TYPE
Swing
COST
USD 160 / monthly
Recommended Cannon Trading Starting Capital
$25,000
83550ce4 cf9c 4afc ab89 e5ee2fd9dd36
The performance shown above is hypothetical in that the chart represents returns in a model account. The model account rises or falls by the average single contract profit and loss achieved by clients trading actual money pursuant to the listed system’s trading signals on the appropriate dates (client fills), or if no actual client profit or loss available – by the hypothetical single contract profit and loss of trades generated by the system’s trading signals on that day in real time (real‐time) less slippage, or if no real time profit or loss available – by the hypothetical single contract profit and loss of trades generated by running the system logic backwards on back adjusted data. Please read full disclaimer HERE.
Would you like to receive daily support & resistance levels?
Yes
S
No
S


Daily Levels for April 8th 2024

4d7ce40c c23b 4ee7 b34c e5b2c3d70422

Trading Reports for Next Week

7e9a5c96 d05e 4beb 9567 5c95f07367e0
d259df9c bf07 4429 9fa8 d12b53c37804
First Notice (FN), Last trading (LT) Days for the Week:
d43865c8 31dd 4466 b8a5 e96ddde4d232

Improve Your Trading Skills

Get access to proprietary indicators and trading methods, consult with an experienced broker at 1-800-454-9572.

Explore trading methods. Register Here

* This is not a solicitation of any order to buy or sell, but a current market view provided by Cannon Trading Inc. Any statement of facts here in contained are derived from sources believed to be reliable, but are not guaranteed as to accuracy, nor they purport to be complete. No responsibility is assumed with respect to any such statement or with respect to any expression of opinion herein contained. Readers are urged to exercise their own judgement in trading.

Weekly Newsletter: Understanding Price Banding, May Bean Oil Outlook and Automated Gold System

Get Real Time updates and more by joining our Private Facebook Group!
Subscribe to our YouTube Channel

C27

Cannon Futures Weekly Letter Issue # 1186

In this issue:
  •  Important Notices – FOMC Next Week
  • Trading Resource of the Week – Understanding Price Limits and Banding
  • Hot Market of the Week – May Bean Oil
  • Broker’s Trading System of the Week – Gold Swing System
  • Trading Levels for Next Week
  • Trading Reports for Next Week


Important Notices –

  • FOMC Meeting next week. Announcement on Wednesday.
  • Light data most of the week. Housing sales
  • Very few earnings
  • June is front month for indices, currencies and financials.: M = June
  • USA is on daylight savings time – most international countries have NOT changed yet.


Trading Resource of the Week : What are Price Limits and Price Banding? by CMEgroup.com

As a trader, you want to know that there are mechanisms in place to ensure an orderly market. A regulated marketplace like CME Group provides this order by setting price limits and price banding.
Price Limits
Price limits are the maximum price range permitted for a futures contract in each trading session. These price limits are measured in ticks and vary from product to product. When markets hit the price limit, different actions occur depending on the product being traded. Some markets may temporarily halt until price limits can be expanded or trading may be stopped for the day based on regulatory rules. Different futures contracts will have different price limit rules; i.e. Equity Index futures have different rules than Agricultural futures.
Example
Equity Indexes futures have a three level expansion: 7%, 13% and 20% to the downside, and a 7% limit up and down in overnight trading.
When price reaches any of those levels the market will go limit up or limit down.
Calculating Price Limits
Price limits are re-calculated daily and remain in effect for all trading days except in certain physically-deliverable markets, where price limits are lifted prior to expiration so that futures prices are not prevented from converging on prices for the underlying commodity.
Typically, Agricultural futures will go limit up or down most often compared to Equity Index futures which very rarely if ever go limit up or down. When trading a specific product, it is important to be aware of price limits and the mechanisms that occur when limits are hit. Traders also know that it is possible for limits to be reached for more than one session in a row, however the expansion of limit thresholds over the last few years have reduced this occurrence.
Price Banding
Price banding is a similar mechanism which subjects all orders to price validation and rejects orders outside the given band to maintain orderly markets. Bands are calculated dynamically for each product based on the last price, plus or minus a fixed band value. Thus, if markets quickly move in one direction, the price bands dynamically adjust to accommodate new trading ranges.
Conclusion
The rules for each market can be found on cmegroup.com.
It is important to note that traders can place trades outside the daily price limits. These trades will be executed when price limits and price bands move within the specified range. So, traders still have the ability to place good-til-canceled or good-til-date orders inside and outside daily price limits.
In the last few years there are fewer and fewer times that markets will actually go limit up or down, but it is important to be aware of these pricing rules when you trade.
efa302e7 662d 4483 85eb 5655e4b45680


stars

3b644da2 2bee 4d39 8d98 5208a20bec39


  • Hot Market of the Week – May Bean Oil
Hot market of the week is provided by QT Market Center, A Swiss army knife charting package that’s not just for Hedgers, Cooperatives and Farmers alike but also for Spread traders, Swing traders and shorter time frame application for intraday traders with a unique proprietary indicator that can be applied to your specific trading needs.
May Bean Oil
The rally in May soybean oil accelerated to its second upside PriceCount objective and now the chart is correcting. At this point, IF you can resume the rally with new sustained highs, the third count would project a possible run to the 50.87 area.
PriceCounts – Not about where we’ve been , but where we might be going next!
5bd46875 4f13 4f46 8290 888342486818
The PriceCount study is a tool that can help to project the distance of a move in price. The counts are not intended to be an ‘exact’ science but rather offer a target area for the four objectives which are based off the first leg of a move with each subsequent count having a smaller percentage of being achieved. It is normal for the chart to react by correcting or consolidating at an objective and then either resuming its move or reversing trend. Best utilized in conjunction with other technical tools, PriceCounts offer one more way to analyze charts and help to manage your positions and risk. Learn more at www.qtchartoftheday.com
Trading in futures, options, securities, derivatives or OTC products entails significant risks which must be understood prior to trading and may not be appropriate for all investors. Past performance of actual trades or strategies is not necessarily indicative of future results.
  • Broker’s Trading System of the Week

With algorithmic trading systems becoming more prevalent in portfolio diversification, the following system has been selected as the broker’s choice for this month.
Spartan Gold
PRODUCT
SYSTEM TYPE
Swing
COST
USD 75 / monthly
Recommended Cannon Trading Starting Capital
$20,000
846f5ed4 d467 4de2 9c1d 75acf0c4f4af
The performance shown above is hypothetical in that the chart represents returns in a model account. The model account rises or falls by the average single contract profit and loss achieved by clients trading actual money pursuant to the listed system’s trading signals on the appropriate dates (client fills), or if no actual client profit or loss available – by the hypothetical single contract profit and loss of trades generated by the system’s trading signals on that day in real time (real‐time) less slippage, or if no real time profit or loss available – by the hypothetical single contract profit and loss of trades generated by running the system logic backwards on back adjusted data. Please read full disclaimer HERE.
Would you like to receive daily support & resistance levels?
Yes
S
No
S


Daily Levels for March 18th 2024

b6a2bf3a a499 4edd 8d8e e4d3d22769b4

Trading Reports for Next Week

58d4627d b4e3 4117 a10c 1ddf826463a9
First Notice (FN), Last trading (LT) Days for the Week:

Improve Your Trading Skills

Get access to proprietary indicators and trading methods, consult with an experienced broker at 1-800-454-9572.

Explore trading methods. Register Here

871e501d 3a1d 4e83 8ee9 a2be76e7992f

* This is not a solicitation of any order to buy or sell, but a current market view provided by Cannon Trading Inc. Any statement of facts here in contained are derived from sources believed to be reliable, but are not guaranteed as to accuracy, nor they purport to be complete. No responsibility is assumed with respect to any such statement or with respect to any expression of opinion herein contained. Readers are urged to exercise their own judgement in trading.

Natural Gas Daily Chart + Futures Trading Levels for 02.22.24

Get Real Time updates and more by joining our Private Facebook Group!
Subscribe to our YouTube Channel


C5


We have a FULL day tomorrow with several reports, FED members talking and more….

Natural Gas bounced sharply on news that Chesapeake cuts production outlook

Cocoa continues it’s run into unknown territories….up over 4% today!

Natural Gas Daily Chart for review below:


92d1139a 8f36 4734 b233 8dc5cc93894c


stars

e35cb555 9ff3 4f00 9fe8 0655b28fbd90

Daily Levels for February 22nd, 2024

200c25d6 f2a3 4027 9b53 daf37d2c2023

e2efe540 f5de 4e9d a356 c461773aa83d

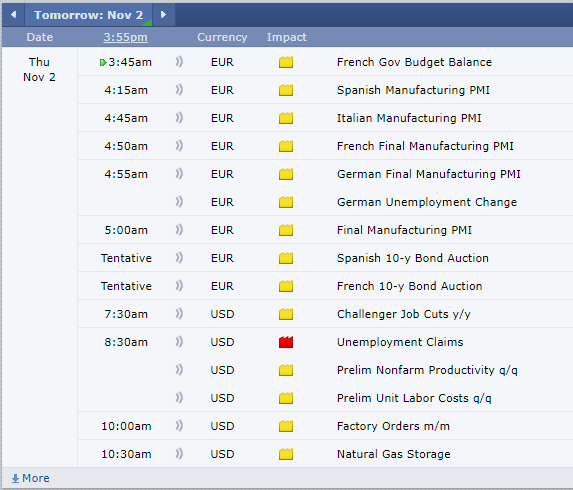
Economic Reports
provided by: ForexFactory.com
All times are Eastern Time ( New York)
f031220f dd92 4380 8bcb 35edc0d5f2cb

Improve Your Trading Skills

Get access to proprietary indicators and trading methods, consult with an experienced broker at 1-800-454-9572.

Explore trading methods. Register Here

3b644da2 2bee 4d39 8d98 5208a20bec39

* This is not a solicitation of any order to buy or sell, but a current market view provided by Cannon Trading Inc. Any statement of facts here in contained are derived from sources believed to be reliable, but are not guaranteed as to accuracy, nor they purport to be complete. No responsibility is assumed with respect to any such statement or with respect to any expression of opinion herein contained. Readers are urged to exercise their own judgement in trading.

Gold Outlook, Crude Oil & Nat Gas Numbers Tomorrow! +Futures Trading Levels for 01.18.24

Get Real Time updates and more on our private FB group!

Join our Private Facebook group

Subscribe to our YouTube Channel


Talking Gold Futures

By Mark O’Brien, Senior Broker

A six-month decline followed by a two-month rally of almost equal price movement. On April 4, Feb gold traded to its all time high of $2,140.30 per ounce. Almost six months to the day, on Oct. 6, the benchmark precious metal had declined ±$300 per ounce (a ±$30,000 move) to $1,842.50. Then, within almost an exact two-month span, on the Sunday Dec. 4th opening of trading, Feb. gold capped a ±$300 per ounce rally, trading briefly up to a new all-time high of $2,152.50. Today, gold prices fell to a more than one-month low, trading intra-day to $2,004.60 per ounce. Credit strong economic data that strengthened dollar and Treasury yields and lowered market expectations of a U.S. rate cut in March. The Commerce Department reported a more-than-expected rise in U.S. retail sales for December. This followed the strong gains in employment and wage gains reported earlier this month and an uptick in inflation last week.


The U.S. Consumer Price Index last week did not persuasively indicate under-control inflation,

but with energy and grain prices remaining significantly below last year’s highs, the prevailing

direction of inflation points down with economic conditions improving.

Heads up: Both Natural Gas and Crude Oil numbers come out tomorrow due to MLK holiday this past Monday and the short trading week.


3b644da2 2bee 4d39 8d98 5208a20bec39


Trading Futures, Options on Futures, and retail off-exchange foreign currency transactions involves substantial risk of loss and is not suitable for all investors.  You should carefully consider whether trading is suitable for you in light of your circumstances, knowledge, and financial resources. You may lose all or more of your initial investment. Opinions, market data, and recommendations are subject to change at any time when it comes to Futures Trading.

Futures Trading Levels

01-18-2024


#ES, #NQ, #YM, #RTY, #XBT, #GC, #SI, #CL, #ZB, #6E, #ZC, #ZW, #ZS, #ZM, #NG

d536c132 d3ce 47ff 8099 79b752e3652b


Improve Your Trading Skills

Get access to proprietary indicators and trading methods, consult with an experienced broker
 1-800-454-9572 Explore trading methods. Register Here


Economic Reports,

Source: 

Forexfactory.com


1d5d1814 7e97 4974 a350 5c367a42c217


This is not a solicitation of any order to buy or sell, but a current market view provided by Cannon Trading Inc. Any statement of facts here in contained are derived from sources believed to be reliable, but are not guaranteed as to accuracy, nor they purport to be complete. No responsibility is assumed with respect to any such statement or with respect to any expression of opinion herein contained. Readers are urged to exercise their own judgement in trading.

Video on Projecting Levels, Christmas Modified Trading Schedule + Levels for 12.20.23

Get Real Time updates and more on our private FB group!

Join our Private Facebook group

Subscribe to our YouTube Channel


March is front month for stock indices and currency futures.

Symbol for March is H, so example ESH24

February is front month for crude oil.

Christmas Modified trading schedule below.


Video: Projecting possible targets when trading futures


Projecting possible targets when trading futures

3b644da2 2bee 4d39 8d98 5208a20bec39


05dcb83f 1c17 4e7a 9b99 80e2e6d1f45d

Trading Futures, Options on Futures, and retail off-exchange foreign currency transactions involves substantial risk of loss and is not suitable for all investors.  You should carefully consider whether trading is suitable for you in light of your circumstances, knowledge, and financial resources. You may lose all or more of your initial investment. Opinions, market data, and recommendations are subject to change at any time when it comes to Futures Trading.

Futures Trading Levels


12-20-2023

#ES, #NQ, #YM, #RTY, #XBT, #GC, #SI, #CL, #ZB, #6E, #ZC, #ZW, #ZS, #ZM, #NG

Improve Your Trading Skills

Get access to proprietary indicators and trading methods, consult with an experienced broker
 1-800-454-9572 Explore trading methods. Register Here


Economic Reports,

Source: 

Forexfactory.com


62584dc1 3e63 45e3 a29b ee6378ed7743


This is not a solicitation of any order to buy or sell, but a current market view provided by Cannon Trading Inc. Any statement of facts here in contained are derived from sources believed to be reliable, but are not guaranteed as to accuracy, nor they purport to be complete. No responsibility is assumed with respect to any such statement or with respect to any expression of opinion herein contained. Readers are urged to exercise their own judgement in trading.

Get Trade Alerts + Futures Trading Levels for Dec. 7th

Get Real Time updates and more on our private FB group!

Join our Private Facebook group

Subscribe to our YouTube Channel


Bullet Points, Highlights, Announcements

By Mark O’Brien, Senior Broker


General: 


It seems like no futures markets are more focused on trading off expectations than those of interest rate futures, like the 10-year T-note and 30-year T-bond.  And those expectations are more focused on one source of information more than any other: the words and actions of the U.S. Federal Reserve Bank’s governors and current chairman, Jerome Powell.  The Fed. board’s governors’ words are incessantly parsed for any clues as to the future direction of interest rate policy.  Each coming Federal Open Market Committee meeting becomes the latest most important meeting in memory and next week’s is no exception.  The U.S. economy is slowing; there are signs inflation is falling and the Fed has kept interest rates steady – at a range of 5.25% to 5.50%, the highest since 2001 – through its last two meetings after raising rates at the conclusion of eleven consecutive meetings before that.  If “three is a trend,” and if the Fed. holds interest rates steady (widely forecast) look for the futures markets to pile on to the already-shifting expectation that a rate cut is coming sooner than later.  As is customary, Chair Powell will likely try to communicate that the Central Bank’s job of controlling inflation is ongoing and any decision on the future of interest rates – up, down, or steady – will be based on broad definitive proof of the need to act, or not.  Next week’s meeting is a 2-day affair, with the announcement scheduled for Wednesday at 1:00 P.M. Central Time, followed by Chair Powell’s press conference.  Stay tuned.


Energy: 


Already entering today’s trading on a 4-day losing streak, crude oil futures extended its sell-off which as of this typing broke through $70.00 per barrel to an intra-day low of $69.11, its lowest price since July 3 (basis the January contract).


While today’s weekly Energy Information Administration report showed crude inventories fell by 4.6 million barrels, far exceeding the 1.4 million-barrel drop analysts had expected, U.S. gasoline stocks rose by 5.4 million barrels last week, more than five times the 1 million-barrel rise analysts expected.


News concerning “the elephant in the room” – China’s economic health – also pressed down on prices.  Yesterday, rating agency Moody’s lowered the outlook on China’s A1 rating from stable to negative.


Getting help from the currency market, the U.S. dollar stayed on its upward rebound from 3+ month lows of last week to a two-week high.  For all things dollar denominated – particularly globally traded commodities – a rising dollar pressures demand by making purchases more expensive for holders of other currencies.


Plan your trade and trade your plan.


b2843954 59a1 437a b480 9ae8d8fc780f


Trading Futures, Options on Futures, and retail off-exchange foreign currency transactions involves substantial risk of loss and is not suitable for all investors.  You should carefully consider whether trading is suitable for you in light of your circumstances, knowledge, and financial resources. You may lose all or more of your initial investment. Opinions, market data, and recommendations are subject to change at any time when it comes to Futures Trading.

3b644da2 2bee 4d39 8d98 5208a20bec39

Futures Trading Levels

12-07-2023

#ES, #NQ, #YM, #RTY, #XBT, #GC, #SI, #CL, #ZB, #6E, #ZC, #ZW, #ZS, #ZM, #NG

Improve Your Trading Skills

Get access to proprietary indicators and trading methods, consult with an experienced broker
 1-800-454-9572 Explore trading methods. Register Here


Economic Reports,

Source: 

Forexfactory.com


8ff83ab5 6c57 42ad 96da d3d58640aa58

This is not a solicitation of any order to buy or sell, but a current market view provided by Cannon Trading Inc. Any statement of facts here in contained are derived from sources believed to be reliable, but are not guaranteed as to accuracy, nor they purport to be complete. No responsibility is assumed with respect to any such statement or with respect to any expression of opinion herein contained. Readers are urged to exercise their own judgement in trading.

The Day After FOMC + Futures Trading Levels for Nov. 2nd

Get Real Time updates and more on our private FB group!

The Day After?

By Senior Broker, Mark O’Brien


General: 


Prior to this blog’s release, the Federal Reserve Bank’s Open Market Committee held rates steady at 5.25% – 5.50% for the second consecutive meeting, yet another indication that the global central bank rate hike cycle is coming to an end.  At the same time, Fed. chair Powell stayed on message by suggesting more rate hikes could be in the pipeline should inflation remain “sticky.”


Keep in mind that a favorite inflation gauge of the Fed is the quarterly Core Personal Consumption Expenditures Index (Core PCE), which last Friday recorded its eighth monthly decline in a row – down to a 3.68% YOY increase and the lowest reading since May 2021.


Energy:


If there was a fear / anticipation that the crisis in the Middle East would lead to extended physical supply disruptions for the energy markets, that fear – and crude oil prices – has abated in the last week or so.  After its initial ±$2.00 per barrel gap-up opening to ±$83.25 per barrel the Sunday after the outbreak of hostilities, Dec. crude oil spent two weeks reaching up to $89.85 intraday on Friday the 20th.  As of this typing, it’s trading over $9.00 per barrel lower near $80.00 per barrel, below pre-hostility prices.  Certainly without notice, the war could escalate.  Expansion militarily between the current parties involved, or in concert with expanded state or non-state participation including the United States, Iran, Syria, Hezbollah could inject a “war premium” into energy prices and extend to other commodities.


Risk: 


The point here is not to opine that this is the direction the conflict will go.  There are a range of possible scenarios for the Israel-Gaza conflict, from an expansion to a broader regional war to a negotiated cessation of hostilities.  There are parties and catalysts capable of steering the situation in either direction.


The idea is to caution traders of the potential for increased volatility and to suggest you approach your futures trading generally with risk-defined strategies, such as hard stop orders, option protection, hedge positions & futures and options spread applications.

Plan your trade and trade your plan.


9b849107 bc80 4031 a503 1322399191de


Trading Futures, Options on Futures, and retail off-exchange foreign currency transactions involves substantial risk of loss and is not suitable for all investors.  You should carefully consider whether trading is suitable for you in light of your circumstances, knowledge, and financial resources. You may lose all or more of your initial investment. Opinions, market data, and recommendations are subject to change at any time when it comes to Futures Trading.

3b644da2 2bee 4d39 8d98 5208a20bec39

Futures Trading Levels

11-02-2023


#ES, #NQ, #YM, #RTY, #XBT, #GC, #SI, #CL, #ZB, #6E, #ZC, #ZW, #ZS, #ZM, #NG

Improve Your Trading Skills

Get access to proprietary indicators and trading methods, consult with an experienced broker
 1-800-454-9572 Explore trading methods. Register Here


Economic Reports, Source: 

Forexfactory.com

1182ad94 9bac 4e94 9804 1d60d5708846


This is not a solicitation of any order to buy or sell, but a current market view provided by Cannon Trading Inc. Any statement of facts here in contained are derived from sources believed to be reliable, but are not guaranteed as to accuracy, nor they purport to be complete. No responsibility is assumed with respect to any such statement or with respect to any expression of opinion herein contained. Readers are urged to exercise their own judgement in trading.

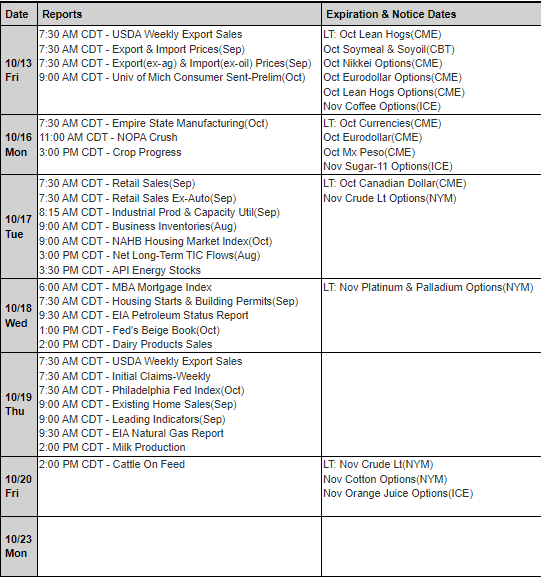
Weekly Newsletter: How to Trade Economic Reports + Futures Trading Levels for Oct. 23rd

Cannon Futures Weekly Newsletter Issue # 1168


Join our private Facebook group for additional insight into trading and the futures markets!

In this issue:

  •  Important Notices – Trading Contest/Real Cash Prizes
  • Trading Resource of the Week – Trading Around Economic Reports
  • Hot Market of the Week – December Cotton
  • Broker’s Trading System of the Week – ES Swing Trading System
  • Trading Levels for Next Week
  • Trading Reports for Next Week
  • Important Notices

Trading Contest – Win Real Cash Trading Simulated Account!
Energy Futures Trading Competition
Duration 
Start: October 15th at 5:00 PM CT
End: October 27th at 4:00 PM CT
Prizes (Cash Prizes!!)
First Place: $2500
Second Place: $1000
Third Place: $650
Random Selection: $500

Competition Details

  • Trade any Group Energy Futures Products including Crude Oil, Micro Crude Oil, RBOB Gasoline, and Natural Gas
  • All Trading will be in the Front-Month Contract
  • All trades will be completed in the StoneX Trader Simulated Trading Environment using the white-labeled Contest Trader application
  • All traders will begin with a virtual account of $100,000.00 Your goal: increase the balance to as much as possible by the conclusion of the competition.
  • Top three traders with the highest P&L balance at the end will get a cash prize.
  • One winner will be chosen from the remaining participants to receive a cash prize.
  • The prizes to the winners shall be awarded in the form of a check (or any other form as reasonably determined by StoneX) and sent to the winner within ten business days of receiving the required tax documentation.

REGISTER NOW

  • Trading Resource of the Week 

Trading Key Economic Reports

As a trader, you will come across many factors that you must consider before entering or exiting the markets. Some of the most important aspects to look for are economic events that can move the markets drastically one way or another.
There are many types of economic events including releases by a governing body, changes in sales or consumption of commodities, and increases in supply and demand. All of these can affect the markets you trade, making it important for you to know how and when these changes are happening.
In this “Trading Around Key Economic Reports” FREE Course you will learn:
  • What is GDP?
  • About the Retail Sales Report
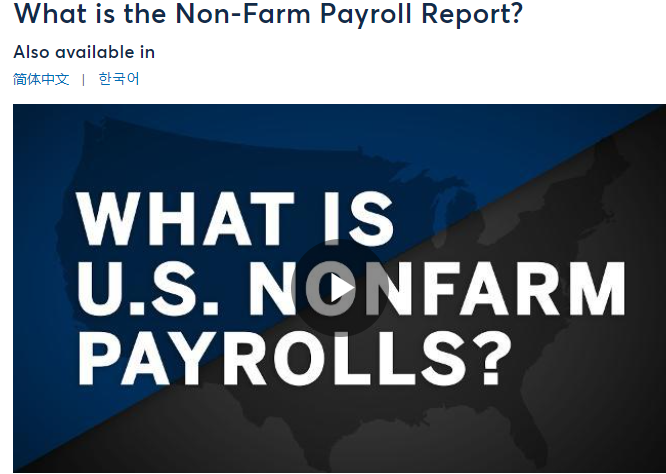
  • What is NFP ( non farm payroll) Report?
  • Understanding US housing Data
  • FOMC
  • Understanding Oil Data Report
  • Importance of Consumer Confidence Survey

ACCESS THE COURSE NOW

KeyEconomicReports
Hot market of the week is provided by QT Market Center, A swiss army knife charting package that’s not just for Hedgers, Cooperatives and Farmers alike but also for Spread traders, Swing traders and shorter time frame application for intraday traders with a unique proprietary indicator that can be applied to your specific trading needs.
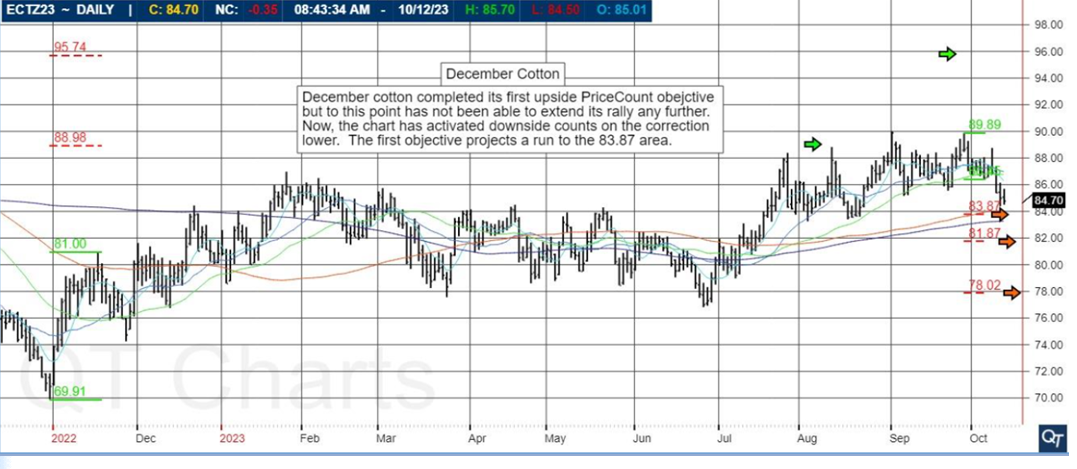
December Cotton completed its first upside PriceCount objective but to this point has not been able to extend its rally any further. Now, the chart has activated downside counts on the correction lower. The first objective projects a run to the 83.87 area.
PriceCounts – Not about where we’ve been , but where we might be going next!
3d478359 d175 421e a6bf 83161427d491
The PriceCount study is a tool that can help to project the distance of a move in price. The counts are not intended to be an ‘exact’ science but rather offer a target area for the four objectives which are based off the first leg of a move with each subsequent count having a smaller percentage of being achieved. It is normal for the chart to react by correcting or consolidating at an objective and then either resuming its move or reversing trend. Best utilized in conjunction with other technical tools, PriceCounts offer one more way to analyze charts and help to manage your positions and risk. Learn more at www.qtchartoftheday.com
Trading in futures, options, securities, derivatives or OTC products entails significant risks which must be understood prior to trading and may not be appropriate for all investors. Past performance of actual trades or strategies is not necessarily indicative of future results.
3b644da2 2bee 4d39 8d98 5208a20bec39
  • Broker’s Trading System of the Week

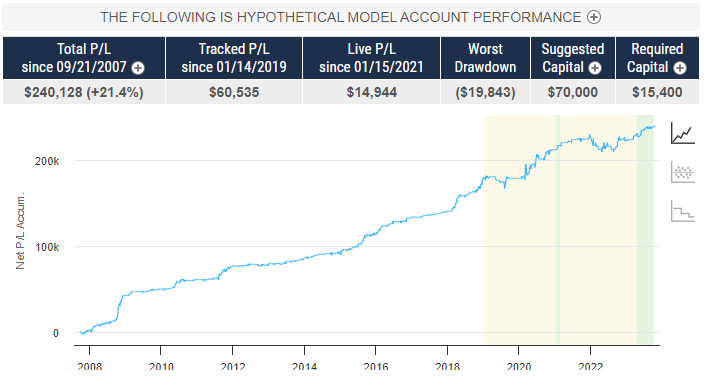
With algorithmic trading systems becoming more prevalent in portfolio diversification, the following system has been selected as the broker’s choice for this month.
PRODUCT
SYSTEM TYPE
Swing
Recommended Cannon Trading Starting Capital
$30,000.00
COST
USD 127 / monthly
e4e4441f db24 42a4 8faa 199b3f8b82ce
The performance shown above is hypothetical in that the chart represents returns in a model account. The model account rises or falls by the average single contract profit and loss achieved by clients trading actual money pursuant to the listed system’s trading signals on the appropriate dates (client fills), or if no actual client profit or loss available – by the hypothetical single contract profit and loss of trades generated by the system’s trading signals on that day in real time (real‐time) less slippage, or if no real time profit or loss available – by the hypothetical single contract profit and loss of trades generated by running the system logic backwards on back adjusted data. Please read full disclaimer HERE.
Sign Up for a Free Personalized Consultation with a Broker from Cannon Trading Company
Questions about the markets? trading? platforms? technology? trading systems? Get answers with a complimentary, confidential consultation with a Cannon Trading Company series 3 broker.
Would you like to receive daily support & resistance levels?
Yes
S
No
S


  • Trading Levels for Next Week

Daily Levels for October 13th, 2023
#ES, #NQ, #YM, #RTY, #XBT, #GC, #SI, #CL, #ZB, #6E, #ZC, #ZW, #ZS, #ZM, #NG
Trading Reports for Next Week
06727b0d 5d63 420b 9876 5bcbf87f210b
First Notice (FN), Last trading (LT) Days for the Week: www.mrci.com 
ef48ab70 147d 4960 b95d ece9544f40ac

This is not a solicitation of any order to buy or sell, but a current market view provided by Cannon Trading Inc. Any statement of facts herein contained are derived from sources believed to be reliable but are not guaranteed as to accuracy, nor they purport to be complete. No responsibility is assumed with respect to any such statement or with respect to any expression of opinion herein contained. Readers are urged to exercise their own judgment in trading.


Good Trading!
Trading Futures, Options on Futures, and retail off-exchange foreign currency transactions involves substantial risk of loss and is not suitable for all investors. You should carefully consider whether trading is suitable for you in light of your circumstances, knowledge, and financial resources. You may lose all or more of your initial investment. Opinions, market data, and recommendations are subject to change at any time.