Trading Classification for Beginners, December Dollar Index, NEW Webinar Nov. 12th, Levels, Reports; Your 5 Important Must-Knows for Trading Futures on October 31st, 2025

9dc1e02e d5f7 4ff4 abf7 1df60775f196

Classify the Trading Day

By Ilan Levy-Mayer, VP

At-a-Glance Levels

Instrument S2 S1 Pivot R1 R2

Gold (GC)

— Dec (GCZ5)

3886.53 3961.37 3999.93 4074.77 4113.33

Silver (SI)

— Dec (SIZ5)

46.47 47.59 48.21 49.33 49.95

Crude Oil (CL)

— Dec (CLZ5)

59.07 59.66 60.22 60.81 61.37

 Dec. Bonds (ZB)

— Dec (ZBZ5)

116 28/32 117 8/32 117 22/32 118 2/32 118 16/32

Classify the trading day — quick guide for beginners

trading

Knowing the day type early helps you pick the right strategy: fade on choppy days, trend-follow on volatile days, and use spreads or small size on mixed/news days.

Simple pre-open checks (do these first)

  • Gap size: big gap → possible trend; small gap → likely chop.
  • Pre-market volume: heavy and one-sided → continuation bias; thin → false breaks.
  • News: major headlines → higher odds of volatility.
  • Correlated markets: bonds, oil, FX aligned with equities → directional day.

First 15 minutes checks

  • Open auction: clean one-sided auction + follow-through → trending; repeated rejections → choppy.
  • VWAP action: price runs away from VWAP → trend; price crossing VWAP repeatedly → mean reversion.
  • Open range vs ATR: open range large vs ATR → favor momentum; small → favor range trades.

Fast decision rules

  • If 3+ trending signals → use breakout/momentum play with trailing stop.
  • If 3+ non-trending signals → use small targets, fade to VWAP/open range.
  • If mixed or headline-driven → cut size, use same‑day options or trade spreads.

Beginner checklist (60 seconds)

  1. Gap: big / small.
  2. Pre-market volume: heavy / thin.
  3. News present: yes / no.
  4. First 15 min: follow-through / oscillation.
  5. If majority = trend → trend plan. If majority = chop → fade plan.

Start small, follow these checks every morning, and track which signals worked so you can refine thresholds over time.

S
7f9123a3 163e 471f 8845 2f0d73018d8f

Dec. Dollar Index

The December dollar index completed its second upside PriceCount objective to the 99.60 level which is consistent with a challenge of the August reversal high. If the chart can break out from here with new sustained highs, the third count would project a possible run to the 101.395 area.

8ca8a93c a038 4316 9e80 ac55744ab727

The PriceCount study is a tool that can help to project the distance of a move in price. The counts are not intended to be an ‘exact’ science but rather offer a target area for the four objectives which are based off the first leg of a move with each subsequent count having a smaller percentage of being achieved.

It is normal for the chart to react by correcting or consolidating at an objective and then either resuming its move or reversing trend. Best utilized in conjunction with other technical tools, PriceCounts offer one more way to analyze charts and help to manage your positions and risk. Learn more at www.qtchartoftheday.com

Trading in futures, options, securities, derivatives or OTC products entails significant risks which must be understood prior to trading and may not be appropriate for all investors. Past performance of actual trades or strategies is not necessarily indicative of future results.

Daily Levels for Oct. 30th, 2025

fd320446 71c7 4772 b3e7 22054cbabb96

Want to feature our updated trading levels on your website? Simply paste a small code, and they’ll update automatically every day!

 Click here for quick and easy instructions.

Economic Reports

 U.S. government data may be impacted by the shutdown. ‘Tentative’ events are subject to delay, revision, or cancellation

provided by: ForexFactory.com

All times are Central Time ( Chicago)

11cbcb65 2b59 4079 8349 940e4772dae1

Find us on Trustpilot

stars

Trading Futures, Options on Futures, and retail off-exchange foreign currency transactions involves substantial risk of loss and is not suitable for all investors. You should carefully consider whether trading is suitable for you in light of your circumstances, knowledge, and financial resources. You may lose all or more of your initial investment. Opinions, market data, and recommendations are subject to change at any time.

Join our Private Facebook group

Subscribe to our YouTube Channel

Listen to our podcast: Subscribe on AppleSpotify, Amazon

or wherever you listen to podcasts!

S
Facebook  Instagram  LinkedIn
S
ef3ab1c9 8d6d 4e60 a3f1 af5d9d4ecbb3
Services
Software
Tools
Community
Contact

Rate Cut, Nov. Feeder Cattle, Trading Psychology, Levels, Reports; Your 5 Must-Knows for Trading Futures the week of October 27th, 2025

7cfe5b36 db9f 4933 824a 7f264613e7fe

Cannon Futures Weekly Newsletter

In Today’s Issue #1263

  • The Week Ahead – FOMC Week!

  • Futures 101 – Trading Psychology Course

  • Hot Market of the Week – Nov. Feeder Cattle

  • Broker’s Trading System of the Week – MICRO NQ Swing Trading System

  • Trading Levels for Next Week
  • Trading Reports for Next Week

At-a-Glance Levels

Instrument S2 S1 Pivot R1 R2
Gold (GC) — Dec (GCZ5) 4007.90 4063.40 4111.20 4166.70 4214.50
Silver (SI) — Dec (SIZ5) 46.79 47.58 48.17 48.96 49.55
Crude Oil (CL) — Nov (CLX5) 60.38 60.93 61.76 62.31 63.14
 Dow Jones (YM) — Dec 2025 46629 47017 47263 47651 47897

Important Notices: The Week Ahead

By John Thorpe, Senior Broker

rate


Traders, much like the Federal Reserve Board, are dependent on data that, during a government shutdown is barely existent.  We have a FOMC rate decision next week and immediately following, a Chair Jerome Powell presser. According to the CME Fed watch tool, we have a 99% chance of another .25-point reduction in the bank lending rate to a 3.75-4.00 range.

Actually, the tool reflects significant confidence of 2, count them, .25 rate reductions remaining this year (the next and final Fed Rate decision meeting is scheduled for December 10th) even after Friday’s CPI release of .03 percent increase in the inflation rate probabilities have remained consistent. The December move would put the Fed Funds lending rate into the 3.50-3.75 range by year end.

As for earnings reports?  Next week we will see the numbers for 5, Trillion dollar + market cap stocks; MSFT, GOOG, META, Wednesday and AAPL, AMZN on Thursday post close.

The on again off again nature of Tariff news has created golden opportunities for breakouts in some markets, rangebound trades in others.  The gold market exploded out of it’s range I have been writing about for months.  BTW, the US Dollar has been in a 4-cent range since April, conversely, the Euro has been in a 5-cent range since Memorial Day. The longer the range trade the harder and faster the breakout becomes.

Expect continued volatility next week as the markets have not been able to receive Gov’t data due to the ongoing, politician-imposed shutdown. Don’t be fooled, this is about politics NOT Policy. Additionally, markets will be reacting to whatever comes out of U.S. Govt leadership relating to conflicts/ cessation, think Russia/Ukraine, sanctioning Russian oil company’s and applying pressure to country’s currently buying oil from them.  Trade deals or no trade deals, China, Trump to meet with Xi Jinping in Korea, India, Canada (in trouble w/ the Reagan Foundation for cutting and pasting incorrectly, a 1987 Reagan Speech on Tariffs) and also, remember that Mexico’s extension will end October 29.

We’ll see you next week! Please enjoy a safe and memorable weekend.

 Earnings Next Week:

·        Mon. Quiet

·        Tue. Visa, UnitedHealth Group,

·        Wed.  MSFT, GOOG, META

·        Thu. AMZN, AAPL, Ely Lilly,

·        Fri.   Exxon Mobile, Chevron

FED SPEECHES: (all times CDT)

·        Mon. Quiet

·        Tues.  Quiet

·        Wed.     FOMC 1:30 Chair Powell Presser

·        Thu. Quiet

·        Fri. Logan 8:30 am, Bostic 11:00 am, Hammack 11:00 am

Economic Data week:

·        Mon.  with the government shutdown, data will be suspended. Check the list Below.

Get An Edge With the Trading Psychology Course

“You must understand that there is more than one path to the top of the mountain.”- Miyamoto Musashi, A Book of Five Rings: The Classic Guide to Strategy

Many experienced traders say that the stiffest challenge you’ll face in becoming a futures trader is conquering your own psyche. Why? Because losing is part of trading, and people hate to lose.

In this “Trading Psychology” Course you will learn:

·     How to examine your patterns and behaviors and recognize when they are holding you back

·     Maintaining self-confidence as a trader even in the face of inexperience

·     The mathematical expectation model and how it can decrease your losses

·     Determining the trading plan that is right for your trading personality

·     Understanding and using Motivation – Risk – Reward to its full advantage

·     Creating effective trading technique strategies

·     Qualities of Successful Traders

START FREE COURSE NOW

Trading Psychology 251024

Hot Market of the Week

Hot market of the week is provided by QT Market Center, A Swiss army knife charting package that’s not just for Hedgers, Cooperatives and Farmers alike but also for Spread traders, Swing traders and shorter time frame application for intraday traders with a unique proprietary indicator that can be applied to your specific trading needs.

Free Trial Available

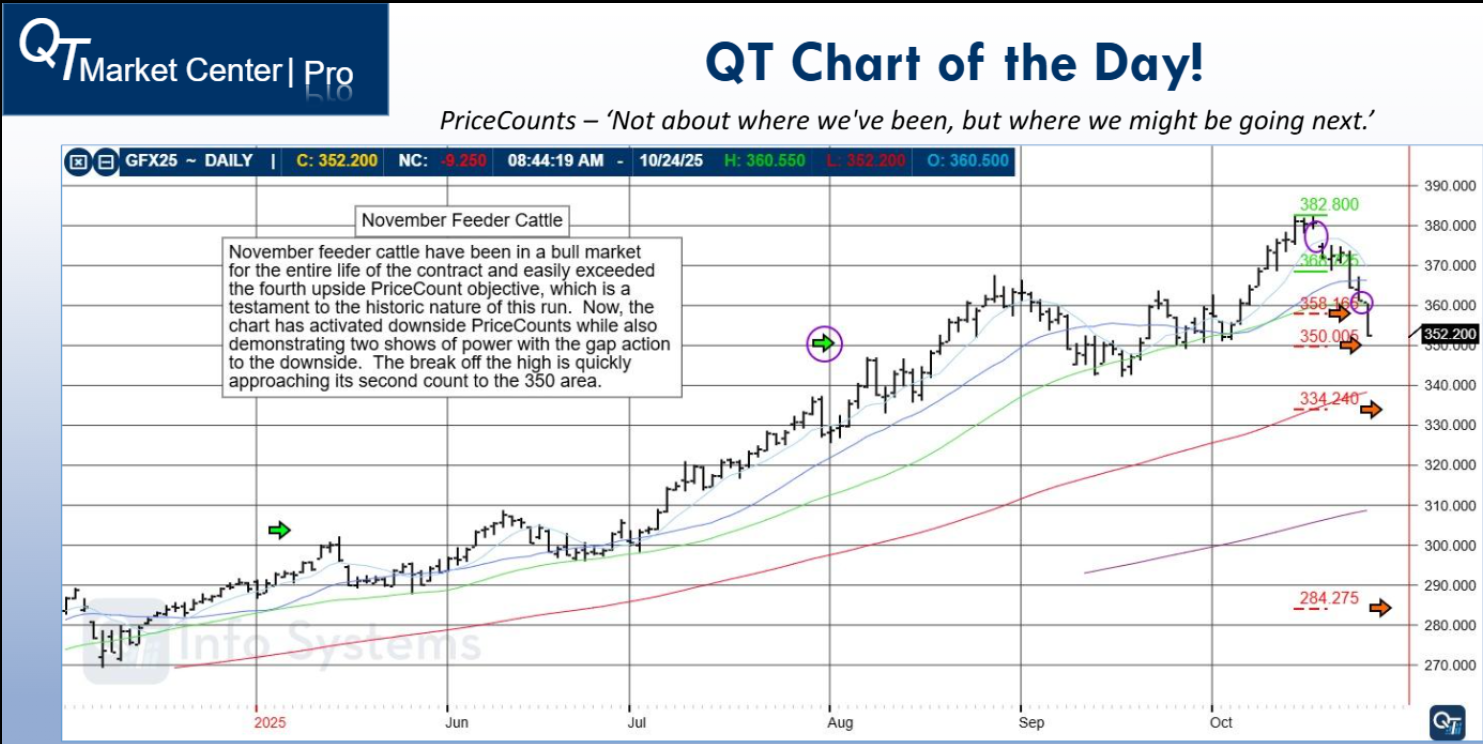
November Feeder Cattle

cattle

The PriceCount study is a tool that can help to project the distance of a move in price. The counts are not intended to be an ‘exact’ science but rather offer a target area for the four objectives which are based off the first leg of a move with each subsequent count having a smaller percentage of being achieved.

It is normal for the chart to react by correcting or consolidating at an objective and then either resuming its move or reversing trend. Best utilized in conjunction with other technical tools, PriceCounts offer one more way to analyze charts and help to manage your positions and risk. Learn more at www.qtchartoftheday.com

Trading in futures, options, securities, derivatives or OTC products entails significant risks which must be understood prior to trading and may not be appropriate for all investors. Past performance of actual trades or strategies is not necessarily indicative of future results.

Brokers Trading System of the Week

Abacus Upside ES Trading System

Markets Traded:   MICRO NQ

System Type: Swing Trading

Risk per Trade: varies

Trading Rules: Caracal is a trend trade strategy that takes long trades only

Suggested Capital: $8,000

Developer Fee per contract: $19 Monthly Subscription

Get Started

Learn More & Detailed Results

tradingsystem 251024

Disclaimer The risk of trading can be substantial and each investor and/or trader must consider whether this is a suitable investment. Past performance is not necessarily indicative of future results.

System Trades Disclosure:

System Description

“System Description” is based upon information obtained from specific system marketing documents, system developers and/or system vendors themselves. While the information is believed to be reliable, we cannot guarantee its completeness or accuracy.

Actual Monthly Performance

The table and charts represent the monthly/quarterly/annual summation of actual trades based on system-specified contract(s) executed through Striker Securities, Inc. using the referenced trading system or system vendor for the stated time period. Commissions and monthly vendor fees are deducted from the tabulation. Results are based on 1 contract. If a client trades 2 contracts his gain or loss is twice as displayed (and so on). This table is presented for information purposes only and is not a solicitation for the referenced system or vendor. The purpose of this information is for clients to compare their brokerage statements to what is displayed on Striker’s site. Striker as a matter of policy has no ownership with the referenced system or vendor or any other trading system or vendor. Past trade history may not be indicative of future results. The results indicated here may or may not be typical of the performance of this system and, ALTHOUGH WE BELIEVE THIS INFORMATION TO BE ACCURATE, CANNON TRADING COMPANY MAKES NO ENDORSEMENT OF THIS OR ANY SYSTEM NOR WARRANTS ITS PERFORMANCE. This is not the only trading system that Striker executes for its clients. Potential traders should carefully investigate, evaluate and compare trading systems before investing capital. Some or all trading systems may involve an inappropriate level of risk for potential traders. It is the nature of commodity trading that where there is the opportunity for profit, there is also the risk of loss. In opening an account through CANNON TRADING COMPANY, Customer acknowledges and agrees that he/she will rely solely upon the information that CANNON TRADING COMPANYprovides to you. Thus, all prior third-party materials provided are superseded by the information and disclosures provided by CANNON TRADING COMPANY.

Important Information About this Trading System Analysis

Statistics, tables, charts and other information on trading system monthly performance are based on actual trading unless otherwise specified. Actual dollar and percentage gains/losses experienced by investors would depend on many factors not accounted for in these statistics, including, but not limited to, starting account balances, market behavior, developer fees, incidence of split fills and other variations in order execution, and the duration and extent of individual investor participation in the specified system.

While the information and statistics given are believed to be complete and accurate we cannot guarantee their completeness or accuracy as they results are key punched and subject to human error. Performance information is not the performance of a single account, but a compilation of several accounts over time, and is based on the physical trading ticket. THIS INFORMATION IS PROVIDED FOR EDUCATIONAL/ INFORMATIONAL PURPOSES ONLY AND USED BY CURRENT CLIENTS TO AUDIT THEIR STATEMENTS TO STRIKER SITE. These results are not indicative of, and have no bearing on, any individual results that may be attained by the trading system in the future.

This trading system, like any other, may involve an inappropriate level of risk for prospective investors. THE RISK OF LOSS IN TRADING COMMODITY FUTURES AND OPTIONS CAN BE SUBSTANTIAL AND MAY NOT BE SUITABLE FOR ALL INVESTORS. Prior to purchasing or leasing a trading system from this or any other system vendor or investing in a trading system with a registered commodity trading representative, investors need to carefully consider whether such trading is suitable for them in light of their own specific financial condition. In some cases, futures accounts are subject to substantial charges for commission, management, incentive or advisory fees.

It may be necessary for accounts subject to these charges to make substantial trading profits to avoid depletion or exhaustion of their assets. In addition, one should carefully study the accompanying prospectus, account forms, disclosure documents and/or risk disclosure statements required by the CFTC or NFA, which are provided directly by the system vendor and/or CTA’s.

The information contained in this report is provided with the objective of “standardizing” trading systems measurements, and it is intended for educational /informational purposes only. All information is offered with the understanding that an investor considering purchasing or leasing a system must carry out his/her own research and due diligence in deciding whether to purchase or lease any trading system noted within or without this report.

This report does not constitute a solicitation to purchase or invest in any trading system which may be mentioned herein. CANNON TRADING COMPANY AND STRIKER SECURITES, INC. MAKES NO ENDORSEMENT OF THIS OR ANY OTHER TRADING SYSTEM NOR WARRANTS ITS PERFORMANCE. THIS IS NOT A SOLICITATION TO PURCHASE OR SUBSCRIBE TO ANY TRADING SYSTEM.

Futures Trading Disclaimer:

Transactions in securities futures, commodity and index futures and options on futures carry a high degree of risk. The amount of initial margin is small relative to the value of the futures contract, meaning that transactions are heavily “leveraged”. A relatively small market movement will have a proportionately larger impact on the funds you have deposited or will have to deposit: this may work against you as well as for you. You may sustain a total loss of initial margin funds and any additional funds deposited with the clearing firm to maintain your position. If the market moves against your position or margin levels are increased, you may be called upon to pay substantial additional funds on short notice to maintain your position. If you fail to comply with a request for additional funds within the time prescribed, your position may be liquidated at a loss and you will be liable for any resulting deficit.

Disclaimer The risk of trading can be substantial, and each investor and/or trader must consider whether this is a suitable investment. Past performance is not necessarily indicative of future results.

System Trades Disclosure:

System Description

“System Description” is based upon information obtained from specific system marketing documents, system developers and/or system vendors themselves. While the information is believed to be reliable, we cannot guarantee its completeness or accuracy.

Actual Monthly Performance

The table and charts represent the monthly/quarterly/annual summation of actual trades based on system-specified contract(s) executed through Striker Securities, Inc. using the referenced trading system or system vendor for the stated time period. Commissions and monthly vendor fees are deducted from the tabulation. Results are based on 1 contract. If a client trades 2 contracts his gain or loss is twice as displayed (and so on). This table is presented for information purposes only and is not a solicitation for the referenced system or vendor. The purpose of this information is for clients to compare their brokerage statements to what is displayed on Striker’s site.

Striker as a matter of policy has no ownership with the referenced system or vendor or any other trading system or vendor. Past trade history may not be indicative of future results. The results indicated here may or may not be typical of the performance of this system and, ALTHOUGH WE BELIEVE THIS INFORMATION TO BE ACCURATE, CANNON TRADING COMPANY MAKES NO ENDORSEMENT OF THIS OR ANY SYSTEM NOR WARRANTS ITS PERFORMANCE.

This is not the only trading system that Striker executes for its clients. Potential traders should carefully investigate, evaluate and compare trading systems before investing capital. Some or all trading systems may involve an inappropriate level of risk for potential traders. It is the nature of commodity trading that where there is the opportunity for profit, there is also the risk of loss. In opening an account through CANNON TRADING COMPANY, Customer acknowledges and agrees that he/she will rely solely upon the information that CANNON TRADING COMPANYprovides to you. Thus, all prior third-party materials provided are superseded by the information and disclosures provided by CANNON TRADING COMPANY.

Important Information About this Trading System Analysis

Statistics, tables, charts and other information on trading system monthly performance are based on actual trading unless otherwise specified. Actual dollar and percentage gains/losses experienced by investors would depend on many factors not accounted for in these statistics, including, but not limited to, starting account balances, market behavior, developer fees, incidence of split fills and other variations in order execution, and the duration and extent of individual investor participation in the specified system.

While the information and statistics given are believed to be complete and accurate we cannot guarantee their completeness or accuracy as they results are key punched and subject to human error. Performance information is not the performance of a single account, but a compilation of several accounts over time, and is based on the physical trading ticket. THIS INFORMATION IS PROVIDED FOR EDUCATIONAL/ INFORMATIONAL PURPOSES ONLY AND USED BY CURRENT CLIENTS TO AUDIT THEIR STATEMENTS TO STRIKER SITE. These results are not indicative of, and have no bearing on, any individual results that may be attained by the trading system in the future.

This trading system, like any other, may involve an inappropriate level of risk for prospective investors. THE RISK OF LOSS IN TRADING COMMODITY FUTURES AND OPTIONS CAN BE SUBSTANTIAL AND MAY NOT BE SUITABLE FOR ALL INVESTORS. Prior to purchasing or leasing a trading system from this or any other system vendor or investing in a trading system with a registered commodity trading representative, investors need to carefully consider whether such trading is suitable for them in light of their own specific financial condition.

In some cases, futures accounts are subject to substantial charges for commission, management, incentive or advisory fees. It may be necessary for accounts subject to these charges to make substantial trading profits to avoid depletion or exhaustion of their assets. In addition, one should carefully study the accompanying prospectus, account forms, disclosure documents and/or risk disclosure statements required by the CFTC or NFA, which are provided directly by the system vendor and/or CTA’s.

The information contained in this report is provided with the objective of “standardizing” trading systems measurements, and it is intended for educational /informational purposes only. All information is offered with the understanding that an investor considering purchasing or leasing a system must carry out his/her own research and due diligence in deciding whether to purchase or lease any trading system noted within or without this report.

This report does not constitute a solicitation to purchase or invest in any trading system which may be mentioned herein. CANNON TRADING COMPANY AND STRIKER SECURITES, INC. MAKES NO ENDORSEMENT OF THIS OR ANY OTHER TRADING SYSTEM NOR WARRANTS ITS PERFORMANCE. THIS IS NOT A SOLICITATION TO PURCHASE OR SUBSCRIBE TO ANY TRADING SYSTEM.

Futures Trading Disclaimer:

Transactions in securities futures, commodity and index futures and options on futures carry a high degree of risk. The amount of initial margin is small relative to the value of the futures contract, meaning that transactions are heavily “leveraged”. A relatively small market movement will have a proportionately larger impact on the funds you have deposited or will have to deposit: this may work against you as well as for you.

You may sustain a total loss of initial margin funds and any additional funds deposited with the clearing firm to maintain your position. If the market moves against your position or margin levels are increased, you may be called upon to pay substantial additional funds on short notice to maintain your position. If you fail to comply with a request for additional funds within the time prescribed, your position may be liquidated at a loss and you will be liable for any resulting deficit.

Would you like to get weekly updates on real-time, results of systems mentioned above?

Daily Levels for Oct 27th, 2025

levels 251024

Would you like to receive daily support & resistance levels?

Trading Reports for Next Week

First Notice (FN), Last trading (LT) Days for the Week:

www.mrci.com

tradingreports 251024

Find us on Trustpilot

stars

Trading Futures, Options on Futures, and retail off-exchange foreign currency transactions involves substantial risk of loss and is not suitable for all investors. You should carefully consider whether trading is suitable for you in light of your circumstances, knowledge, and financial resources. You may lose all or more of your initial investment. Opinions, market data, and recommendations are subject to change at any time.

Join our Private Facebook group

Subscribe to our YouTube Channel

Listen to our podcast: Subscribe on AppleSpotify, Amazon

or wherever you listen to podcasts!

S
Facebook  Instagram  LinkedIn
S
ef3ab1c9 8d6d 4e60 a3f1 af5d9d4ecbb3
Services
Software
Tools
Community
Contact

Futures FYI: Metals, Stock Index Futures, Energies, Dec-March Corn Spread, Levels, Reports; Your 6 Important Need-To-Knows for Trading Futures on October 23rd, 2025

9dc1e02e d5f7 4ff4 abf7 1df60775f196

What You Need to Know Before Trading Futures Tomorrow!

By Mark O’Brien, Senior Broker

futures

At-a-Glance Levels

Instrument S2 S1 Pivot R1 R2
Gold (GC) — Dec (GCZ5) 3951.53 4035.67 4105.33 4189.47 4259.43
Silver (SI) — Dec (SIZ5) 46.09 47.19 47.92 49.02 49.75
Crude Oil (CL) — Nov (CLX5) 56.37 57.88 58.86 60.37 61.35
 Dow Jones (YM) — Dec 2025 46315 46553 46877 47115 47439

General:

Day 22 of the U.S Government shut-down, now the second-longest on record. Today it overtook the 21-day shutdown of 1995-96. Without a fix, many federal employees will not be getting paid this Friday, the first full paycheck they’ll miss as a result of the shutdown.

Stock Index Futures:

We’re amidst earning season for the third quarter. Moving into full swing, all eyes were on IBM, AT&T and in particular Tesla – all releasing their latest earnings results after the closing bell.

Tomorrow: Intel

Metals:

It’s another installment of the broken record precious metals report – with a twist.

On Monday, Dec. gold futures rose to a new all-time intraday high of $4,398.00/ounce and closed up nearly $150/ounce above Friday’s close. As this blog is being composed, the contract is trading ±$300/ounce lower ±$4,090/ounce – a ±$30,000 per contract move. This includes yesterday’s free-fall of over $300/ounce marking its largest single-day sell-off in 13 years.

Despite the dip, gold is still up over 50% year-to-date. HSBC predicts that the precious metal will hit $5,000 next year.

Energies:

After remaining on their lows last week – with a new multi-month intraday low of $55.96/barrel in the December contract on Monday, futures rose after President Trump again said India would reduce its purchases of Russian oil, while today’s EIA’s report showed a one-million-barrel drop in U.S. crude oil inventories following three weekly builds. Today, Dec. crude oil rose over $2.00/barrel to an intraday high of $59.67/barrel.

S
82a813cd c09a 4dea 96cf a99e6b297f3b

Dec – March Corn Spread

The Dec-March corn spread has resumed its rally into a new high. At this point, the chart appears to be taking aim at its third upside PriceCount objective to the -12 area.

52cc3580 2325 451e ad1d 4341de8368ee

The PriceCount study is a tool that can help to project the distance of a move in price. The counts are not intended to be an ‘exact’ science but rather offer a target area for the four objectives which are based off the first leg of a move with each subsequent count having a smaller percentage of being achieved.

It is normal for the chart to react by correcting or consolidating at an objective and then either resuming its move or reversing trend. Best utilized in conjunction with other technical tools, PriceCounts offer one more way to analyze charts and help to manage your positions and risk. Learn more at www.qtchartoftheday.com

Trading in futures, options, securities, derivatives or OTC products entails significant risks which must be understood prior to trading and may not be appropriate for all investors. Past performance of actual trades or strategies is not necessarily indicative of future results.

Daily Levels for Oct. 23rd, 2025

c48698a2 ba4e 4bd2 80ca 49584262c1f0

Want to feature our updated trading levels on your website? Simply paste a small code, and they’ll update automatically every day! 

Click here for quick and easy instructions.

Economic Reports

 U.S. government data may be impacted by the shutdown. ‘Tentative’ events are subject to delay, revision, or cancellation

provided by: ForexFactory.com

All times are Central Time ( Chicago)

f21cc7d5 3b7b 468a a2d0 59ee83101b6a

Find us on Trustpilot

stars

Trading Futures, Options on Futures, and retail off-exchange foreign currency transactions involves substantial risk of loss and is not suitable for all investors. You should carefully consider whether trading is suitable for you in light of your circumstances, knowledge, and financial resources. You may lose all or more of your initial investment. Opinions, market data, and recommendations are subject to change at any time.

Join our Private Facebook group

Subscribe to our YouTube Channel

Listen to our podcast: Subscribe on AppleSpotify, Amazon

or wherever you listen to podcasts!

S
Facebook  Instagram  LinkedIn
S
ef3ab1c9 8d6d 4e60 a3f1 af5d9d4ecbb3
Services
Software
Tools
Community
Contact

Overnight Edge, December Mini Dow, Levels, Reports; Your 4 Important Need-To-Knows for Trading Futures on October 21st, 2025

9dc1e02e d5f7 4ff4 abf7 1df60775f196

Where is the Edge?

edge

At-a-Glance Levels

Instrument S2 S1 Pivot R1 R2
Gold (GC) — Dec (GCZ5) 4173.40 4285.40 4341.70 4453.70 4510.00
Silver (SI) — Dec (SIZ5) 49.49 50.65 51.24 52.40 52.99
Crude Oil (CL) — Nov (CLX5) 55.32 56.16 56.79 57.63 58.26
 Dow Jones (YM) — Dec 2025 46087 46503 46733 47149 47379

Over the past few months, and especially in recent weeks, we’ve seen unusually large overnight moves. Some moves appear random, others reverse quickly, and some are driven by headlines such as tariff news. These dynamics have increased gap risk, reduced overnight liquidity, and produced frequent open-time dislocations.

Common question

Where is the edge?

Short answer

  • Trade the first 30 minutes and focus on short-term gap-fill or rejection setups.
  • Use same-day options when you expect a large directional move to limit tail risk and avoid being stopped out only to see the market move in your favor.
  • Trade spreads when relative strength diverges across instruments (for example, gold vs silver or mini-Dow vs ES).

Extended answer

I want to focus on the practical elements of trading like pre-market context, move behavior, market news correlation, liquidity, options limits, and whether to use mean reversion or momentum. I’ll also want to highlight key parts like risk management, stop placement, and position sizing. Planning should be direct with a simple checklist and no more than six sections. I should also consider using a relevant citation about tariff-related movements, but just one, and make sure it’s only placed where necessary. No framing or extra explanations.

Futures day-trading edge

You find edge by matching a repeatable hypothesis to the current market regime, then executing it with strict risk and execution rules.

Regime diagnosis (what the market is doing now)

  • Volatility regime: large overnight gaps and erratic premarket prints mean the market is in a news-driven, headline-sensitive volatility regime.
  • Catalyst profile: moves are often tied to macro headlines and tariff noise; those headlines create directional gaps that either persist into the session or sharply reverse at the open.
  • Liquidity profile: overnight liquidity is thin and fragmented, increasing slippage and fake outs at the open.

Reliable, tradeable edges you can use

  • Pre-open directional bias with size filter. Trade opens when overnight gap exceeds a threshold (e.g., 0.5% or X ticks) and pre-market order flow confirms (sustained prints, not one-off sweep).
  • Use reduced size and wider stops for gaps caused by headline noise.
  • Fade headline gap into first 30 minutes when structure is weakIf gap lacks follow-through volume and price fails to make a clean microstructure breakout, favor mean reversion to the first-tail or VWAP.
  • Trend-follow breakouts in high conviction regimeWhen overnight move is accompanied by aligned macro flow (rates, FX, commodities) and volume ramps into the open, follow momentum with a continuation plan.
  • Volatility arbitrage playsUse options or calendar spreads where available to sell realized volatility after spikes and buy protection around known headline windows.
  • Session-timing edgeTrade smaller and tighter in the first 15–30 minutes after the open; increase size after the market establishes structure (first clean high/low and confirmation).
  • Microstructure edge: limit vs market tacticsUse passive limit entries near structural levels and aggressive exits into liquidity. Avoid market entries into thin pre-open auction prints.

Concrete execution rules (checklist)

  • Pre-market checklist: identify gap size, top 3 headlines, correlated markets (bonds, FX, oil), and pre-open volume trend.
  • Entry rules: require either structural confirmation (higher high / lower low) or a mean-reversion setup with defined edge-to-risk ratio ≥ 2:1.
  • Sizing: reduce notional by 25–50% on headline-driven nights; increase only after two clean consecutive edges are realized.
  • Stops and targets: place stop where edge invalidates (clearly definable price level); scale out at predefined targets; never trade without a stop.
  • Slippage buffer: add tick buffer to stops and profit targets during thin liquidity opens.

How to test and keep the edge

  • Backtest regime-specific rules: label historical sessions by overnight gap size and headline events, test mean-reversion vs momentum rules separately.
  • Forward-test with small capital: run a two-week rolling simulator and log slippage, win rate, and expectancy.
  • Adaptive rules: codify a volatility threshold that switches you between momentum and fade strategies automatically.

Brief trade plan template

  • Hypothesis: (e.g., “Overnight tariff headline caused a 0.7% gap that lacks confirmatory volume; first 20 minutes will mean-revert to VWAP.”)
  • Entry: limit at VWAP + X ticks or on 1-minute reversal candle.
  • Stop: invalidation beyond the overnight high/low + slippage buffer.
  • Target: partial at VWAP, final at first structure level.
  • Size: 50% normal when gap driver = headline; full size only when macro alignment confirmed.

Be systematic: diagnose regime, pick the strategy that historically wins in that regime, enforce execution and risk rules, and iterate from measured data.

Important: Trading commodity futures and options involves a substantial risk of loss.  

The recommendations contained in this blog are of opinion only and do not guarantee any profits.  

Past performances are not necessarily indicative of future results.

December Mini DOW

The December mini DJIA chart satisfied its second upside PriceCount objective earlier this month and corrected lower. At this point, IF the chart can resume its rally with new sustained highs, the third count would project a possible run to the 52041 area.

ae992987 2d47 4be3 a8d7 b9228ddcdb34

The PriceCount study is a tool that can help to project the distance of a move in price. The counts are not intended to be an ‘exact’ science but rather offer a target area for the four objectives which are based off the first leg of a move with each subsequent count having a smaller percentage of being achieved.

It is normal for the chart to react by correcting or consolidating at an objective and then either resuming its move or reversing trend. Best utilized in conjunction with other technical tools, PriceCounts offer one more way to analyze charts and help to manage your positions and risk. Learn more at www.qtchartoftheday.com

Trading in futures, options, securities, derivatives or OTC products entails significant risks which must be understood prior to trading and may not be appropriate for all investors. Past performance of actual trades or strategies is not necessarily indicative of future results.

Daily Levels for Oct. 21st, 2025

29a2db9b 5496 4c1a 90af 7b5a30e75999

Want to feature our updated trading levels on your website? Simply paste a small code, and they’ll update automatically every day! 

Click here for quick and easy instructions.

Economic Reports

 U.S. government data may be impacted by the shutdown. ‘Tentative’ events are subject to delay, revision, or cancellation

provided by: ForexFactory.com

All times are Central Time ( Chicago)

584def4f 193c 48ef 8762 24bbb1449316

Find us on Trustpilot

stars

Trading Futures, Options on Futures, and retail off-exchange foreign currency transactions involves substantial risk of loss and is not suitable for all investors. You should carefully consider whether trading is suitable for you in light of your circumstances, knowledge, and financial resources. You may lose all or more of your initial investment. Opinions, market data, and recommendations are subject to change at any time.

Join our Private Facebook group

Subscribe to our YouTube Channel

Listen to our podcast: Subscribe on AppleSpotify, Amazon

or wherever you listen to podcasts!

S
Facebook  Instagram  LinkedIn
S
ef3ab1c9 8d6d 4e60 a3f1 af5d9d4ecbb3
Services
Software
Tools
Community
Contact

Day Trading Week! Fed Speakers, December Hogs, Swing Trading, Levels, Reports; Your 6 Important Need-To-Knows for Trading Futures the Week of October 13th, 2025

7cfe5b36 db9f 4933 824a 7f264613e7fe

Cannon Futures Weekly Letter

In Today’s Issue #1262

  • The Week Ahead – Fed Speakers Galore…

  • Futures 101 – Podcast: Insight into Day Trading Futures

  • Hot Market of the Week – Dec. Hogs

  • Broker’s Trading System of the Week – Mini SP Swing Trading System 

  • Trading Levels for Next Week
  • Trading Reports for Next Week

Important Notices: The Week Ahead

By John Thorpe, Senior Broker

day trading

Traders, much like the Federal Reserve Board, are dependent on data that, during a government shutdown is barely existent. 17 Fed speakers!  The markets are sure to move then, but wait, that’s not all, Fed Chair Powell on Economic Outlook and Monetary Policy.

As for earnings reports? Q3 begins next week!  Major Banks report first. (see Below)

The on again off again nature of Tariff news has created golden opportunities for breakouts in some markets, rangebound trades in others.  The gold market exploded out of its range I have been writing about for months.  Watch Crude oil to see if it stays in its $60.00-$65.00 range and the Dollar index too! The longer the range trade the harder and faster the breakout typically is.

Continued volatility to come as next week all markets will be reacting to whatever comes out of U.S. Govt leadership relating to conflicts cessation and trade deals, China, India, Canada and Russia (looks like the EU is following Trump on this one) The Crude Oil market certainly believes so.. Also, remember that Mexico’s extension will end October 29.

We’ll see you next week! Please enjoy a safe and memorable weekend.

 Earnings Next Week:

  • Mon. Quiet
  • Tue. JPM , JNJ, WFG, GS, BLK, C
  • Wed.  BAC, MS, ABT,
  • Thu. SCHW, BK, USB
  • Fri.   AXP,

FED SPEECHES: (all times CDT)

  • Mon.  Paulson 11:55 am,
  • Tues.  Bowman 7:45, Fed Chair Powell 11:20am, Waller 2:25, Collins 2:30
  • Wed.   Bostic 11:10, Miran 11:30, Waller Noon,
  • Thu.     Barkin 7:00am, Barr, Miran, Waller all 8:00am, Bowman 9:00am , Barkin 10:45am, Miran 3:15pm, Kashkari, 5:00pm
  • Fri.      Musalem 11:15

Economic Data week: 

  • Mon.  with the government shutdown, data will be suspended.
Join us for an exclusive webinar on “Futures Spread Trading,” where you’ll discover the powerful strategies professional traders use to capitalize on market opportunities while managing risk. Whether you’re a seasoned investor or just starting out, this session will break down the essentials of spread trading, uncover actionable techniques, and show you how to navigate the futures market with confidence. Don’t miss this chance to learn from industry experts and take your trading skills to the next level—reserve your spot today!
0d2eda99 dc22 4a53 a1e3 b347a3c01bf5

Day Trading Futures

thumbnail?url=https%3A%2F%2Fi.ytimg.com%2Fvi%2FjEtPhWg91z4%2Fhqdefault

Hot Market of the Week

Hot market of the week is provided by QT Market Center, A Swiss army knife charting package that’s not just for Hedgers, Cooperatives and Farmers alike but also for Spread traders, Swing traders and shorter time frame application for intraday traders with a unique proprietary indicator that can be applied to your specific trading needs.

Free Trial Available

Dec. Hogs

The rally in December hogs stalled out last month and now the chart has activated downside PriceCounts on the correction lower. The first count projects a possible slide to the 81.11 area.”

7a467b43 7646 4910 98e4 46fa4fb48f4b

The PriceCount study is a tool that can help to project the distance of a move in price. The counts are not intended to be an ‘exact’ science but rather offer a target area for the four objectives which are based off the first leg of a move with each subsequent count having a smaller percentage of being achieved.

It is normal for the chart to react by correcting or consolidating at an objective and then either resuming its move or reversing trend. Best utilized in conjunction with other technical tools, PriceCounts offer one more way to analyze charts and help to manage your positions and risk. Learn more at www.qtchartoftheday.com

Trading in futures, options, securities, derivatives or OTC products entails significant risks which must be understood prior to trading and may not be appropriate for all investors. Past performance of actual trades or strategies is not necessarily indicative of future results.

Brokers Trading System of the Week

ALGOsigmaX E-mini S&P ES

Markets Traded:   Mini SP500 ES/EP

System Type: Swing Trading

Risk per Trade: varies

Trading Rules: Partially Disclosed

Suggested Capital: $50,000

Developer Fee per contract: $205 Monthly Subscription

Get Started

Learn More

e1423cd9 525a 41d8 acae 1378fefb1cfa
Disclaimer The risk of trading can be substantial, and each investor and/or trader must consider whether this is a suitable investment. Past performance is not necessarily indicative of future results.

IMPORTANT RISK DISCLOSURE

Futures trading is complex and carries the risk of substantial losses. It is not suitable for all investors. The ability to withstand losses and to adhere to a particular trading program in spite of trading losses are material points which can adversely affect investor returns.

The returns for trading systems listed throughout this website are hypothetical in that they represent returns in a model account. The model account rises or falls by the average single contract profit and loss achieved by clients trading actual money pursuant to the listed system’s trading signals on the appropriate dates (client fills), or if no actual client profit or loss available – by the hypothetical single contract profit and loss of trades generated by the system’s trading signals on that day in real time (real-time) less slippage, or if no real time profit or loss available – by the hypothetical single contract profit and loss of trades generated by running the system logic backwards on backadjusted data (backadjusted).

Please read carefully the CFTC required disclaimer regarding hypothetical results below.

HYPOTHETICAL PERFORMANCE RESULTS HAVE MANY INHERENT LIMITATIONS, SOME OF WHICH ARE DESCRIBED BELOW. NO REPRESENTATION IS BEING MADE THAT ANY ACCOUNT WILL OR IS LIKELY TO ACHIEVE PROFITS OR LOSSES SIMILAR TO THOSE SHOWN; IN FACT, THERE ARE FREQUENTLY SHARP DIFFERENCES BETWEEN HYPOTHETICAL PERFORMANCE RESULTS AND THE ACTUAL RESULTS SUBSEQUENTLY ACHIEVED BY ANY PARTICULAR TRADING PROGRAM.

ONE OF THE LIMITATIONS OF HYPOTHETICAL PERFORMANCE RESULTS IS THAT THEY ARE GENERALLY PREPARED WITH THE BENEFIT OF HINDSIGHT.

IN ADDITION, HYPOTHETICAL TRADING DOES NOT INVOLVE FINANCIAL RISK, AND NO HYPOTHETICAL TRADING RECORD CAN COMPLETELY ACCOUNT FOR THE IMPACT OF FINANCIAL RISK OF ACTUAL TRADING. FOR EXAMPLE, THE ABILITY TO WITHSTAND LOSSES OR TO ADHERE TO A PARTICULAR TRADING PROGRAM IN SPITE OF TRADING LOSSES ARE MATERIAL POINTS WHICH CAN ALSO ADVERSELY AFFECT ACTUAL TRADING RESULTS.

THERE ARE NUMEROUS OTHER FACTORS RELATED TO THE MARKETS IN GENERAL OR TO THE IMPLEMENTATION OF ANY SPECIFIC TRADING PROGRAM WHICH CANNOT BE FULLY ACCOUNTED FOR IN THE PREPARATION OF HYPOTHETICAL PERFORMANCE RESULTS AND ALL WHICH CAN ADVERSELY AFFECT ACTUAL TRADING RESULTS.

Please read full disclaimer HERE.

Would you like to get weekly updates on real-time, results of systems mentioned above?

Daily Levels for Oct 13th, 2025

6ac8232f 6227 444d 909d cb5479bbc219

Would you like to receive daily support & resistance levels?

Trading Reports for Next Week

First Notice (FN), Last trading (LT) Days for the Week:

www.mrci.com

ac46bf10 f98c 4ba4 bc8e c917649e29c1

Find us on Trustpilot

stars

Trading Futures, Options on Futures, and retail off-exchange foreign currency transactions involves substantial risk of loss and is not suitable for all investors. You should carefully consider whether trading is suitable for you in light of your circumstances, knowledge, and financial resources. You may lose all or more of your initial investment. Opinions, market data, and recommendations are subject to change at any time.

Join our Private Facebook group

Subscribe to our YouTube Channel

Listen to our podcast: Subscribe on AppleSpotify, Amazon

or wherever you listen to podcasts!

S
Facebook  Instagram  LinkedIn
S
ef3ab1c9 8d6d 4e60 a3f1 af5d9d4ecbb3
Services
Software
Tools
Community
Contact

Trade and Risk Management, December Cocoa, Levels, Reports; Your 4 Important Must-Knows for Trading Futures on October 3rd, 2025

9dc1e02e d5f7 4ff4 abf7 1df60775f196

Trade and Risk Management

Course Overview 14 minutes

risk

If you have an approach that makes money, then money management can make the difference between success and failure…I try to be conservative in my risk management. I want to make sure I’ll be around to play tomorrow. Risk control is essential.”

– Monroe Trout, Trout Trading

START THE FREE COURSE

S
1b6cb822 4820 4c1e b71b 624084e37450

December Cocoa

December cocoa resumed its break into a new low. If the chart can sustain further weakness, the third downside PriceCount projects a possible slide to the 5681 area.

40ccdaa2 7e03 45b0 ac10 9d2566570cb7

The PriceCount study is a tool that can help to project the distance of a move in price. The counts are not intended to be an ‘exact’ science but rather offer a target area for the four objectives which are based off the first leg of a move with each subsequent count having a smaller percentage of being achieved.

It is normal for the chart to react by correcting or consolidating at an objective and then either resuming its move or reversing trend. Best utilized in conjunction with other technical tools, PriceCounts offer one more way to analyze charts and help to manage your positions and risk. Learn more at www.qtchartoftheday.com

Trading in futures, options, securities, derivatives or OTC products entails significant risks which must be understood prior to trading and may not be appropriate for all investors. Past performance of actual trades or strategies is not necessarily indicative of future results.

Daily Levels for Oct. 3rd, 2025

01fb11d1 6bb3 4a28 b9fa c9b56b11f3e2

Want to feature our updated trading levels on your website? Simply paste a small code, and they’ll update automatically every day! 

Click here for quick and easy instructions.

Economic Reports

provided by: ForexFactory.com

All times are Eastern Time ( New York)

291a87f0 4f13 46e4 ae68 8179bc2827c3

Find us on Trustpilot

stars

Trading Futures, Options on Futures, and retail off-exchange foreign currency transactions involves substantial risk of loss and is not suitable for all investors. You should carefully consider whether trading is suitable for you in light of your circumstances, knowledge, and financial resources. You may lose all or more of your initial investment. Opinions, market data, and recommendations are subject to change at any time.

Join our Private Facebook group

Subscribe to our YouTube Channel

Listen to our podcast: Subscribe on AppleSpotify, Amazon

or wherever you listen to podcasts!

S
Facebook  Instagram  LinkedIn
S
ef3ab1c9 8d6d 4e60 a3f1 af5d9d4ecbb3
Services
Software
Tools
Community
Contact

Last Trading Day of the Month + Levels & Reports; Your 4 Important Must-Knows for Trading Futures on September 30th, 2025

9dc1e02e d5f7 4ff4 abf7 1df60775f196

Trading Futures on the Last Trading Day of the Month

last trading day

Last Trading Day of September: What You Need to Know

On the last trading day of the month, futures markets often see elevated volume and more abrupt intraday swings as large participants—CTAs, hedge funds, commodity pools, and corporates—rebalance, roll, or close positions for performance reporting and risk alignment. Those flows can cluster around key reference windows (e.g., settlement periods and cash-market closes), creating brief liquidity vacuums where spreads widen, slippage increases, and stop cascades are more likely.

Even when overall volume is high, liquidity can be uneven, with deeper book liquidity alternating with thin pockets—so an order that would normally fill cleanly may experience partial fills or adverse selection. It’s also common to see basis and calendar spreads move sharply as rolls concentrate, especially in equity index, rates, energy, and metals.

Practical pointers: come in with a predefined plan and smaller initial size, use limit or passive orders where possible, and avoid chasing late-month breakouts unless your setup and risk budget justify it. Keep an eye on roll calendars, first notice day (for deliverable commodities), margin changes, and any month-end economic releases that can amplify flows (e.g., regional PMIs, rebalancing signals).

Monitor depth-of-book and implied spread quotes; if spreads widen, consider adjusting targets and stops rather than forcing entries. Be wary of Trade-at-Settlement/settlement-period prints if you’re not deliberately targeting the fix.

Finally, tighten process discipline: mark your levels early, define max slippage, and be comfortable standing down if the tape becomes disorderly—not trading is a position. (Educational only—this is not investment advice; manage risk according to your plan and account constraints.)

Have a question about ANY futures market? Trading techniques? Platforms? Trading Algos? Most of our brokers have over 12 years experience and can be one of the most valuable resource you have access to! Speak/chat/email a broker now.

That’s the Last Trading Day of the Month! Plan your Trade and Trade Your Plan!

S
1b6cb822 4820 4c1e b71b 624084e37450

November Canola

November canola resumed its break into a new low. If sustained, the third downside PriceCount objective projects a slide to the 592 area. It takes a trade below the December reactionary low to formally negate the remaining unmet upside count.

7f510d65 50e9 48fd beed cae42b3a5d61

The PriceCount study is a tool that can help to project the distance of a move in price. The counts are not intended to be an ‘exact’ science but rather offer a target area for the four objectives which are based off the first leg of a move with each subsequent count having a smaller percentage of being achieved.

It is normal for the chart to react by correcting or consolidating at an objective and then either resuming its move or reversing trend. Best utilized in conjunction with other technical tools, PriceCounts offer one more way to analyze charts and help to manage your positions and risk. Learn more at www.qtchartoftheday.com

Trading in futures, options, securities, derivatives or OTC products entails significant risks which must be understood prior to trading and may not be appropriate for all investors. Past performance of actual trades or strategies is not necessarily indicative of future results.

Daily Levels for Sept. 30th, 2025

65aec1b7 924e 4cc7 9684 93f7ee89b8fd

Want to feature our updated trading levels on your website? Simply paste a small code, and they’ll update automatically every day! 

Click here for quick and easy instructions.

Economic Reports

provided by: ForexFactory.com

All times are Eastern Time ( New York)

399e3a5d 102d 4469 8fa3 85a900325299

Find us on Trustpilot

stars

Trading Futures, Options on Futures, and retail off-exchange foreign currency transactions involves substantial risk of loss and is not suitable for all investors. You should carefully consider whether trading is suitable for you in light of your circumstances, knowledge, and financial resources. You may lose all or more of your initial investment. Opinions, market data, and recommendations are subject to change at any time.

Join our Private Facebook group

Subscribe to our YouTube Channel

Listen to our podcast: Subscribe on AppleSpotify, Amazon

or wherever you listen to podcasts!

S
Facebook  Instagram  LinkedIn
S
ef3ab1c9 8d6d 4e60 a3f1 af5d9d4ecbb3
Services
Software
Tools
Community
Contact

NFP next Friday, December Dollar Index, Levels, Reports; The Important Need-To-Knows for Trading Futures The Week of September 29th, 2025

7cfe5b36 db9f 4933 824a 7f264613e7fe

Cannon Futures Weekly Letter

In Today’s Issue #1260

  • The Week Ahead -Non Farm Payrolls (NFP) & Fed Speakers
  • Futures 101 – Trading Tips via Short Videos
  • Hot Market of the Week – Dec. Dollar Index
  • Broker’s Trading System of the Week – Mini NASDAQ Day Trading System
  • Trading Levels for Next Week
  • Trading Reports for Next Week

Important Notices: The Week Ahead

By John Thorpe, Senior Broker

Non-Far Payroll (NFP) & Fed Speakers to Dominate the Week Ahead

nfp

NFP Friday and another heavy week of Fed speakers as well.

With the FOMC meeting Behind us, listen for more nuanced language, outside of the 3 cuts prior to years end, Chair Powell shared during after his rate cut speech last week, but we had surprise GDP number this week. You will be hearing from a slew of Fed Speakers posting up this week (schedule is below). This unit by themselves, will, no doubt be responsible for bringing additional spice to the marketplace.

As for earnings reports we are truly at the end of Q2 Reporting. We have but a few laggards reporting this week. If you are wondering, Q3 earnings begin Mid-October.

The on again off again nature of Tariff news has created golden opportunities for breakouts in some markets, rangebound trades in others.

Continued volatility to come as next week all markets will be reacting to whatever comes out of U.S. Govt leadership relating to conflicts cessation and trade deals, China, India, Canada and Russia (looks like the EU is following Trump on this one) The Crude Oil market certainly believes so. Also, remember that Mexico’s extension will end October 29.

We’ll see you next week! Please enjoy a safe and memorable weekend.

 Earnings Next Week: 

  • Mon. Carnival Cruiselines
  • Tue. PayChex, Nike
  • Wed.  Acuity, ConAgra
  • Thu. Quiet
  • Fri.   Quiet

FED SPEECHES: (all times CDT) 

  • Mon.  Waller 6:30 AM , Hammack 7:00 AM, Musalem and Williams 12:30PM, Bostic 5:00pm
  • Tues.  Jefferson 5:00AM, Goolsbee 12:30 PM, Logan 6:10 PM
  • Wed.   Quiet
  • Thu.     Logan 9:30 am
  • Fri.      Williams 5:05 am

Economic Data week: 

  • Mon.  Pending Home Sales, Dallas Fed Manufacturing Index
  • Tue.   Redbook, Case Schiller Home Price, Chgo PMI, Jolts , Consumer Confidence, Dallas Fed Svcs.
  • Wed.  ADP, ISM Manufacturing, EIA Crude Stocks, 17-week Bill auction
  • Thur. Challenger Job Cuts, Initial Jobless claims, Factory Orders, EIA NAT GAS Storage, Fed Balance sheet,
  • Fri.     NFP, ISM Svcs PMI, Baker Hughes Rig Count
626ad4fb 6641 4499 8fee 1a2df95486b7

Trading Videos – Instant Viewing

Watch a series of short videos, where our VP, Ilan Levy-Mayer shares his personal preferences and opinions on different trading topics.

  • Ever wondered when to exit a trade? Take a look at what Ilan has to share on Bollinger Bands and a study called PARABOLICS
  • Some common uses you can make of support and resistance levels.
  • Filter out the noise with range bar charts
  • “Price Confirmation” – Increasing the chances of a win?

WATCH VIDEOS NOW

Hot Market of the Week

Hot market of the week is provided by QT Market Center, A Swiss army knife charting package that’s not just for Hedgers, Cooperatives and Farmers alike but also for Spread traders, Swing traders and shorter time frame application for intraday traders with a unique proprietary indicator that can be applied to your specific trading needs.

Free Trial Available

Dec. Dollar Index

The December dollar index activated upside PriceCounts on yesterday’s close as it attempts to shift its momentum higher once again. We previously attempted to rally with counts made off the July low but that effort failed without reaching the first objective and we negated those unmet counts.

36ab28ea 8315 40d8 83ff 80d5edf428b8

The PriceCount study is a tool that can help to project the distance of a move in price. The counts are not intended to be an ‘exact’ science but rather offer a target area for the four objectives which are based off the first leg of a move with each subsequent count having a smaller percentage of being achieved.

It is normal for the chart to react by correcting or consolidating at an objective and then either resuming its move or reversing trend. Best utilized in conjunction with other technical tools, PriceCounts offer one more way to analyze charts and help to manage your positions and risk. Learn more at www.qtchartoftheday.com

Trading in futures, options, securities, derivatives or OTC products entails significant risks which must be understood prior to trading and may not be appropriate for all investors. Past performance of actual trades or strategies is not necessarily indicative of future results.

Brokers Trading System of the Week

iBO NQ LO30m PcdhlFpbhlFnTH 1C

Markets Traded:   Mini NASDAQ NQ

System Type: Day Trading

Risk per Trade: varies

Trading Rules: Partially Disclosed

Suggested Capital: $30,000

Developer Fee per contract: $85 Monthly Subscription

Get Started

Learn More

ec5c729a 3a18 4b58 baf5 2379ca91c6e3
Disclaimer The risk of trading can be substantial and each investor and/or trader must consider whether this is a suitable investment. Past performance is not necessarily indicative of future results.

IMPORTANT RISK DISCLOSURE

Futures trading is complex and carries the risk of substantial losses. It is not suitable for all investors. The ability to withstand losses and to adhere to a particular trading program in spite of trading losses are material points which can adversely affect investor returns.

The returns for trading systems listed throughout this website are hypothetical in that they represent returns in a model account. The model account rises or falls by the average single contract profit and loss achieved by clients trading actual money pursuant to the listed system’s trading signals on the appropriate dates (client fills), or if no actual client profit or loss available – by the hypothetical single contract profit and loss of trades generated by the system’s trading signals on that day in real time (real-time) less slippage, or if no real time profit or loss available – by the hypothetical single contract profit and loss of trades generated by running the system logic backwards on backadjusted data (backadjusted).

Please read carefully the CFTC required disclaimer regarding hypothetical results below. HYPOTHETICAL PERFORMANCE RESULTS HAVE MANY INHERENT LIMITATIONS, SOME OF WHICH ARE DESCRIBED BELOW.

NO REPRESENTATION IS BEING MADE THAT ANY ACCOUNT WILL OR IS LIKELY TO ACHIEVE PROFITS OR LOSSES SIMILAR TO THOSE SHOWN; IN FACT, THERE ARE FREQUENTLY SHARP DIFFERENCES BETWEEN HYPOTHETICAL PERFORMANCE RESULTS AND THE ACTUAL RESULTS SUBSEQUENTLY ACHIEVED BY ANY PARTICULAR TRADING PROGRAM.

ONE OF THE LIMITATIONS OF HYPOTHETICAL PERFORMANCE RESULTS IS THAT THEY ARE GENERALLY PREPARED WITH THE BENEFIT OF HINDSIGHT. IN ADDITION, HYPOTHETICAL TRADING DOES NOT INVOLVE FINANCIAL RISK, AND NO HYPOTHETICAL TRADING RECORD CAN COMPLETELY ACCOUNT FOR THE IMPACT OF FINANCIAL RISK OF ACTUAL TRADING.

FOR EXAMPLE, THE ABILITY TO WITHSTAND LOSSES OR TO ADHERE TO A PARTICULAR TRADING PROGRAM IN SPITE OF TRADING LOSSES ARE MATERIAL POINTS WHICH CAN ALSO ADVERSELY AFFECT ACTUAL TRADING RESULTS.

THERE ARE NUMEROUS OTHER FACTORS RELATED TO THE MARKETS IN GENERAL OR TO THE IMPLEMENTATION OF ANY SPECIFIC TRADING PROGRAM WHICH CANNOT BE FULLY ACCOUNTED FOR IN THE PREPARATION OF HYPOTHETICAL PERFORMANCE RESULTS AND ALL WHICH CAN ADVERSELY AFFECT ACTUAL TRADING RESULTS.

Please read full disclaimer HERE.

Would you like to get weekly updates on real-time, results of systems mentioned above?

Daily Levels for Sept 29th, 2025

a8378128 d559 45ca a55d 646cd2610177

Would you like to receive daily support & resistance levels?

Trading Reports for Next Week

First Notice (FN), Last trading (LT) Days for the Week:

www.mrci.com

7cdc63dc 3497 412e 8166 e97199ce87d5

Find us on Trustpilot

stars

Trading Futures, Options on Futures, and retail off-exchange foreign currency transactions involves substantial risk of loss and is not suitable for all investors. You should carefully consider whether trading is suitable for you in light of your circumstances, knowledge, and financial resources. You may lose all or more of your initial investment. Opinions, market data, and recommendations are subject to change at any time.

Join our Private Facebook group

Subscribe to our YouTube Channel

Listen to our podcast: Subscribe on AppleSpotify, Amazon

or wherever you listen to podcasts!

S
Facebook  Instagram  LinkedIn
S
ef3ab1c9 8d6d 4e60 a3f1 af5d9d4ecbb3
Services
Software
Tools
Community
Contact

GDP: What It Is and What to Look for in the Upcoming Report; December Corn, Levels, Reports – The Important Facts to Keep in Mind When Trading Futures on September 25th, 2025

9dc1e02e d5f7 4ff4 abf7 1df60775f196

GDP Explained

By Mark O’Brien, Senior Broker

  • Upcoming GDP Report: The Commerce Department’s Bureau of Economic Analysis will release the final report on U.S. GDP for Q2 (April–June) at 7:30 A.M. Central Time.

  • Previous Estimates: The first estimate showed 3.0% growth; the revised figure was 3.3%. Tomorrow’s release will be the final revision.

  • Quarterly Comparison: In Q1, real GDP decreased by 0.5%, making Q2’s growth a significant rebound.

  • GDP Definition & Components: GDP measures total economic output, calculated from four main components: consumer spending, business investment, government spending, and net exports.

  • Uses of GDP: Serves as an economic barometer for policy decisions, guides business and investment strategies, and enables international economic comparisons.

gdp

Keep an eye out for the last look at U.S. GDP (Gross Domestic Product) for the second quarter of this year: April – June. At 7:30 A.M., Central Time the Commerce Department’s U.S. Bureau of Economic Analysis will release its final report. The first, advanced look at the second quarter showed real GDP increased at an annual rate of 3.0 percent.

The bureau then released a revised, coincident figure of 3.3%. Tomorrow’s report will be the final revision, based on data gathered lately. In the first quarter, real GDP decreased 0.5 percent.

GDP

is a comprehensive measure of a nation’s economic output, indicating the total value of goods and services produced. It’s calculated by adding up the value of four main components:

Consumer Spending (Personal Consumption): Purchases of goods and services by households.

Business Investment: Spending by businesses on capital goods, like machinery and buildings.

Government Spending: Purchases of goods and services by the government at all levels.

Net Exports: The total value of exports minus the value of imports.

How GDP is Used

Economic Barometer: Governments and policymakers use GDP data to track the economy’s performance and inform decisions on fiscal and monetary policies.

Business and Investment Decisions: Investors and businesses closely monitor GDP growth to identify opportunities for investment and growth.

International Comparisons: GDP allows for the comparison of the relative size and strength of different economies worldwide.

S

December 25/26 Corn Spread

The Dec – Dec corn spread is trending higher and approaching a second upside PriceCount objective to the -34.75 area. It would be normal to get a near term reaction in the form of a consolidation or corrective trade from that level. IF the chart can sustain further strength, the third count would project a possible run to the -27.25 area.

7c06d7ab 0f6c 4b07 9e0a 4bb4866c520b
The PriceCount study is a tool that can help to project the distance of a move in price. The counts are not intended to be an ‘exact’ science but rather offer a target area for the four objectives which are based off the first leg of a move with each subsequent count having a smaller percentage of being achieved.

It is normal for the chart to react by correcting or consolidating at an objective and then either resuming its move or reversing trend. Best utilized in conjunction with other technical tools, PriceCounts offer one more way to analyze charts and help to manage your positions and risk. Learn more at www.qtchartoftheday.com

Trading in futures, options, securities, derivatives or OTC products entails significant risks which must be understood prior to trading and may not be appropriate for all investors.

Past performance of actual trades or strategies is not necessarily indicative of future results.

Daily Levels for Sept. 25th, 2025

6d974503 683d 45dd ac6e 0a07466a1a22

Want to feature our updated trading levels on your website? Simply paste a small code, and they’ll update automatically every day! 

Click here for quick and easy instructions.

Economic Reports

provided by: ForexFactory.com

All times are Eastern Time ( New York)

b86307f9 fe49 41b8 a305 a339440cad25

Find us on Trustpilot

stars

Trading Futures, Options on Futures, and retail off-exchange foreign currency transactions involves substantial risk of loss and is not suitable for all investors. You should carefully consider whether trading is suitable for you in light of your circumstances, knowledge, and financial resources. You may lose all or more of your initial investment. Opinions, market data, and recommendations are subject to change at any time.

Join our Private Facebook group

Subscribe to our YouTube Channel

Listen to our podcast: Subscribe on AppleSpotify, Amazon

or wherever you listen to podcasts!

S
Facebook  Instagram  LinkedIn
S
ef3ab1c9 8d6d 4e60 a3f1 af5d9d4ecbb3
Services
Software
Tools
Community
Contact

FED Speakers, PCE, Bitcoin and Ether Futures, Levels, Reports; What you Need to Know for Trading Futures the Week of September 22nd, 2025

7cfe5b36 db9f 4933 824a 7f264613e7fe

Cannon Futures Weekly Letter

In Today’s Issue #1259

  • The Week Ahead – Fed Speakers, PCE

  • Futures 101 – Trading Bitcoin and Ether Futures

  • Hot Market of the Week – Dec. Mini SP500

  • Broker’s Trading System of the Week – Natural Gas Swing Trading System

  • Trading Levels for Next Week
  • Trading Reports for Next Week

Important Notices: The Week Ahead

By John Thorpe, Senior Broker

Fed Speakers & PCE to Dominate the Week Ahead

fed speakers

Fed Chair Powell to speak in Warwick, RI Wednesday, Heavy week of Fed speakers as well.

The Spice you should be ordering now that Fall is right around the corner should be anything but the pumpkin variety!

The spice building into these markets is what traders look for, Volume is back and so is volatility on many fronts.

With the FOMC meeting behind us, listen for more nuanced language, outside of the 3 cuts prior to years end, Chair Powell shared during after his rate cut speech Wednesday. You will be hearing from a slew of Fed Speakers posting up this week (schedule is below). This unit by themselves, will, no doubt be responsible for bringing additional spice to the marketplace

Those trading markets other than the indices understand rates effect nearly all the markets we trade. To name a few: precious metals (inflation), Bonds (long term rates following short term to varying degrees), the energy complex (cheaper capital higher demand), Equities (cheaper capital), Currencies (capital flows out of US dollar denominated assets to higher interest rate debentures) Grains, Lumber, etc.

           As for earnings reports we are truly at the end of Q2 Reporting. We have but a few laggards reporting this week

The on again off again nature of Tariff news has created golden opportunities for breakouts in some markets, rangebound trades in others. The market is just bored with the talk about Russia/Ukraine war cessation, until there is major movement, looks like it’s all up to Putin to move the needle.

Continued volatility to come as next week all markets will be reacting to whatever comes out of U.S. Govt leadership relating to conflicts cessation and trade deals, especially with China great talks with XI and Trump tda, India, Canada and Russia. Also, remember that Mexico’s extension will end October 29.

We’ll see you next week! Please enjoy a safe and memorable weekend.

 Earnings Next Week: 

  • Mon. Quiet
  • Tue. Micron
  • Wed.  Quiet
  • Thu. Costco, Accenture
  • Fri.   Quiet

FED SPEECHES: (all times CDT) 

  • Mon.  Williams 8:45am, Musalem 9:00am, Barkin, Hammack and Miran, (new kid on the block) 11:00am
  • Tues.  Bowman 8:00am, Bostic 9:00am, Fed Chair Powell from Warwick, RI 11:35 am
  • Wed. Daly 3:10 pm
  • Thu.     Goolsbee 7:20 am, Williams 8:00am, Bowman 9:00am, Barr 12:00 pm, Daly 2:30 pm
  • Fri.      Hammack 7:00am, Barkin 8:00 am, Bowman 12:00pm, Musalem 12:30 pm, Bostic 5:00pm

Economic Data week: 

  • Mon.  Quiet
  • Tue.   Redbook, &P PMI, Richmond Fed
  • Wed.  Bldg Permits final, EIA Crude Stocks, 17-week Bill auction
  • Thur.  Initial Jobless claims, Core PCE, GDP Final, Existing home sales, EIA NAT GAS Storage, Fed Balance sheet,
  • Fri.     Core PCE index MoM, Michigan consumer sentiment, Baker Hughes
626ad4fb 6641 4499 8fee 1a2df95486b7

Micro Ether been averaging over 140,000 contracts per day last few weeks!

Micro Bitcoin trades close to 100,000 contracts per day as well!!

If you are a Crypto trader, it is time for you to explore trading Crypto Futures on a regulated centralized exchange!

Introduction to Cryptocurrency futures

Course overview

Cryptocurrency futures, available at CME Group, provide market participants with multiple products for cryptocurrency risk management or market expression. Expand your understanding of the cryptocurrency markets, products, and underlying reference rates. This course covers:

  • Bitcoin
  • Ether
  • Micro Bitcoin
  • Micro Ether
  • Options on Bitcoin futures
  • BTIC on Cryptocurrency futures

START FREE COURSE NOW

e47bab83 4e08 4948 b8ed 4ae51104377d

Hot Market of the Week

Hot market of the week is provided by QT Market Center, A Swiss army knife charting package that’s not just for Hedgers, Cooperatives and Farmers alike but also for Spread traders, Swing traders and shorter time frame application for intraday traders with a unique proprietary indicator that can be applied to your specific trading needs.

Free Trial Available

Dec. Mini SP 500

The December Emini S&P is extending its rally with a fresh contract high. At this point, the chart is taking aim at its third upside PriceCount objective to the 7252 area.

8e3a0bf7 c484 4a25 889d fd00cecf3c78

The PriceCount study is a tool that can help to project the distance of a move in price. The counts are not intended to be an ‘exact’ science but rather offer a target area for the four objectives which are based off the first leg of a move with each subsequent count having a smaller percentage of being achieved.

It is normal for the chart to react by correcting or consolidating at an objective and then either resuming its move or reversing trend. Best utilized in conjunction with other technical tools, PriceCounts offer one more way to analyze charts and help to manage your positions and risk. Learn more at www.qtchartoftheday.com

Trading in futures, options, securities, derivatives or OTC products entails significant risks which must be understood prior to trading and may not be appropriate for all investors.

Past performance of actual trades or strategies is not necessarily indicative of future results.

Brokers Trading System of the Week

NAT GAS

Markets Traded:   Natural Gas NG

System Type: Swing Trading

Risk per Trade: varies

Trading Rules: Partially Disclosed

Suggested Capital: $25,000

Developer Fee per contract: $60 Monthly Subscription

Get Started

Learn More

a698b308 5de4 4482 88c4 4e1133f57616
Disclaimer The risk of trading can be substantial and each investor and/or trader must consider whether this is a suitable investment. Past performance is not necessarily indicative of future results.

IMPORTANT RISK DISCLOSURE

Futures trading is complex and carries the risk of substantial losses. It is not suitable for all investors. The ability to withstand losses and to adhere to a particular trading program in spite of trading losses are material points which can adversely affect investor returns.

The returns for trading systems listed throughout this website are hypothetical in that they represent returns in a model account. The model account rises or falls by the average single contract profit and loss achieved by clients trading actual money pursuant to the listed system’s trading signals on the appropriate dates (client fills), or if no actual client profit or loss available – by the hypothetical single contract profit and loss of trades generated by the system’s trading signals on that day in real time (real-time) less slippage, or if no real time profit or loss available – by the hypothetical single contract profit and loss of trades generated by running the system logic backwards on backadjusted data (backadjusted).

Please read carefully the CFTC required disclaimer regarding hypothetical results below. HYPOTHETICAL PERFORMANCE RESULTS HAVE MANY INHERENT LIMITATIONS, SOME OF WHICH ARE DESCRIBED BELOW.

NO REPRESENTATION IS BEING MADE THAT ANY ACCOUNT WILL OR IS LIKELY TO ACHIEVE PROFITS OR LOSSES SIMILAR TO THOSE SHOWN; IN FACT, THERE ARE FREQUENTLY SHARP DIFFERENCES BETWEEN HYPOTHETICAL PERFORMANCE RESULTS AND THE ACTUAL RESULTS SUBSEQUENTLY ACHIEVED BY ANY PARTICULAR TRADING PROGRAM. ONE OF THE LIMITATIONS OF HYPOTHETICAL PERFORMANCE RESULTS IS THAT THEY ARE GENERALLY PREPARED WITH THE BENEFIT OF HINDSIGHT.

IN ADDITION, HYPOTHETICAL TRADING DOES NOT INVOLVE FINANCIAL RISK, AND NO HYPOTHETICAL TRADING RECORD CAN COMPLETELY ACCOUNT FOR THE IMPACT OF FINANCIAL RISK OF ACTUAL TRADING. FOR EXAMPLE, THE ABILITY TO WITHSTAND LOSSES OR TO ADHERE TO A PARTICULAR TRADING PROGRAM IN SPITE OF TRADING LOSSES ARE MATERIAL POINTS WHICH CAN ALSO ADVERSELY AFFECT ACTUAL TRADING RESULTS.

THERE ARE NUMEROUS OTHER FACTORS RELATED TO THE MARKETS IN GENERAL OR TO THE IMPLEMENTATION OF ANY SPECIFIC TRADING PROGRAM WHICH CANNOT BE FULLY ACCOUNTED FOR IN THE PREPARATION OF HYPOTHETICAL PERFORMANCE RESULTS AND ALL WHICH CAN ADVERSELY AFFECT ACTUAL TRADING RESULTS.

Please read full disclaimer HERE.

Would you like to get weekly updates on real-time, results of systems mentioned above?

Daily Levels for Sept 22nd, 2025

8b5f9516 2d48 4a8f 97ac 06e9afd17e2c
Would you like to receive daily support & resistance levels?

Trading Reports for Next Week

First Notice (FN), Last trading (LT) Days for the Week:

www.mrci.com

1cd8913d 6bce 46c6 8638 c904841fa4fc

Find us on Trustpilot

stars

Trading Futures, Options on Futures, and retail off-exchange foreign currency transactions involves substantial risk of loss and is not suitable for all investors. You should carefully consider whether trading is suitable for you in light of your circumstances, knowledge, and financial resources. You may lose all or more of your initial investment. Opinions, market data, and recommendations are subject to change at any time.

Join our Private Facebook group

Subscribe to our YouTube Channel

Listen to our podcast: Subscribe on AppleSpotify, Amazon

or wherever you listen to podcasts!

S
Facebook  Instagram  LinkedIn
S
ef3ab1c9 8d6d 4e60 a3f1 af5d9d4ecbb3
Services
Software
Tools
Community
Contact