Weekly Newsletter 1078: Rollover Notice and Trading Tips During Rollover & Support and Resistance Levels for the Week Ahead

Cannon Futures Weekly Letter Issue # 1078

Dear Traders,

Like us on FaceBook!
Get Real Time updates and market alerts on Twitter!


Trading 201: Trading During Rollover

Rollover Notice for U.S. Stock Index, Currency and Financial Futures
Heads up traders! We’re approaching important dates on the trading calendar.
Monday, December 13th is Last Trading Day for December currency futures. It is of the utmost importance for currency traders to exit all December futures contracts and start trading the next quarterly futures contract and the new front month: March ’22. Currency futures are DELIVERABLE contracts. By holding any December futures contracts through the close of Last Trading Day, you will be subject to delivering (short positions) or taking delivery of (long positions) the full notional value of the futures contract.
For stock index futures traders, on Friday, Dec. 17th, the Dec. ’21 futures contracts will officially halt trading and the exchange will cash settle all open positions at 8:30 A.M., Central Time.  Thursday, December 9th marked the traditional date traders started rolling Dec. stock index futures trades to the next quarterly futures contract and the new front month: also March ’22. Come forward to the new front month for the next ±90 days.
Finally, for financial futures traders (Ultra bonds, 30-yr. T-bonds, 2-, 5-, 10-yr. T-notes, etc.) the traditional roll-over day was Nov. 30th/First Notice Day (the date all open LONG positions became subject to delivery). The next front month – and now by far the more liquid – is also March ’22. For all longs and shorts not in the deliverables market, it’s time to trade March ’22 contracts.
The March exchange symbol for all these futures contracts is “H.” Check for the appropriate complete symbol for these new front month futures contracts on your trading/charting software. Make sure your quotes, charts, DOM’s are set to the correct futures contract month.
 Keep in mind the following:
  • Currencies are DELIVERABLE and you must be out and trading March as of today, Friday Dec. 10th
  • Stock index futures are cash settled on Friday Dec. 17th at 9:30 AM Eastern Time.
  • During the rollover period, especially with stock index futures, I noticed that the first few days will have two sided, volatile action. Think about it, you have large traders and institutions who are NOT day traders and carry large positions as speculation or a hedge and now they need to rollover from Dec. to March.
  • In my opinion, counter trend methods, mean reversion techniques can work better during rollover period but one must be very aware as past performance is not indicative of futures results.
  • Keep in mind, back in the days, many floor traders would “trade the spread” specifically with different techniques. I believe some traders still do using the screen.
  • Bottom line is know that this is rollover period, do research on past rollover periods, start trading the March contract and good trading and happy holidays!
6541ee95 dd57 4414 bd0f 3a1de7e5be19

Good Trading

Trading Futures, Options on Futures, and retail off-exchange foreign currency transactions involves substantial risk of loss and is not suitable for all investors.  You should carefully consider whether trading is suitable for you in light of your circumstances, knowledge, and financial resources. You may lose all or more of your initial investment. Opinions, market data, and recommendations are subject to change at any time when it comes to Futures Trading.


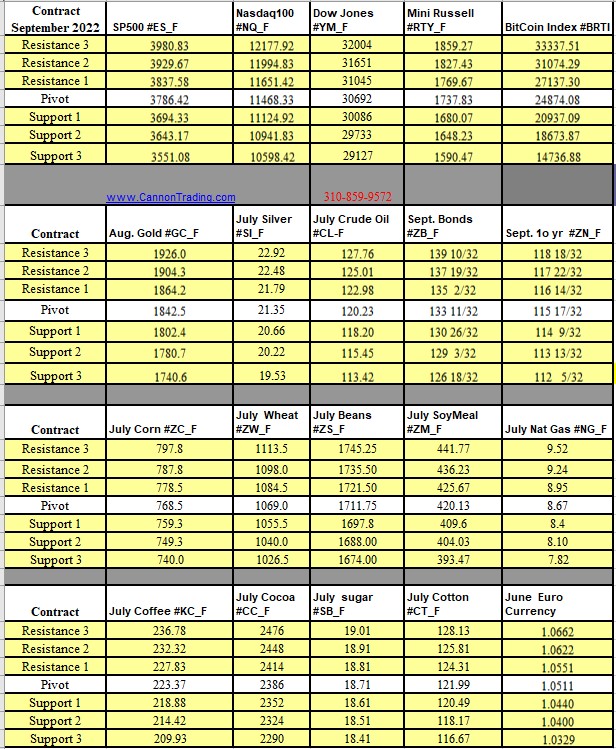
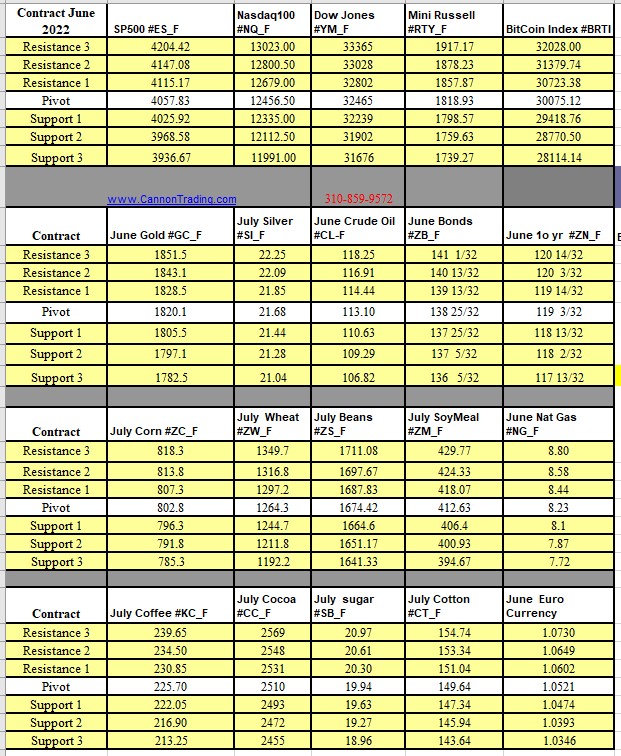
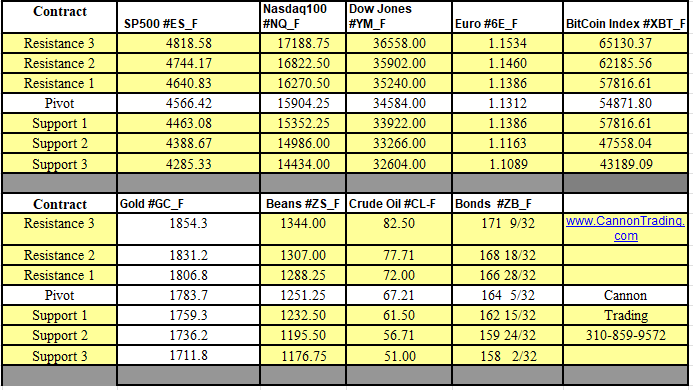
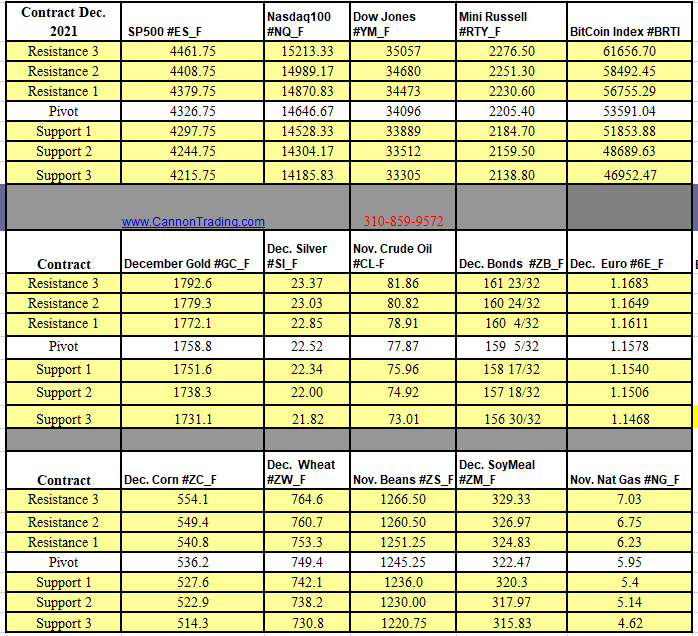
Futures Trading Levels

12.13.2021

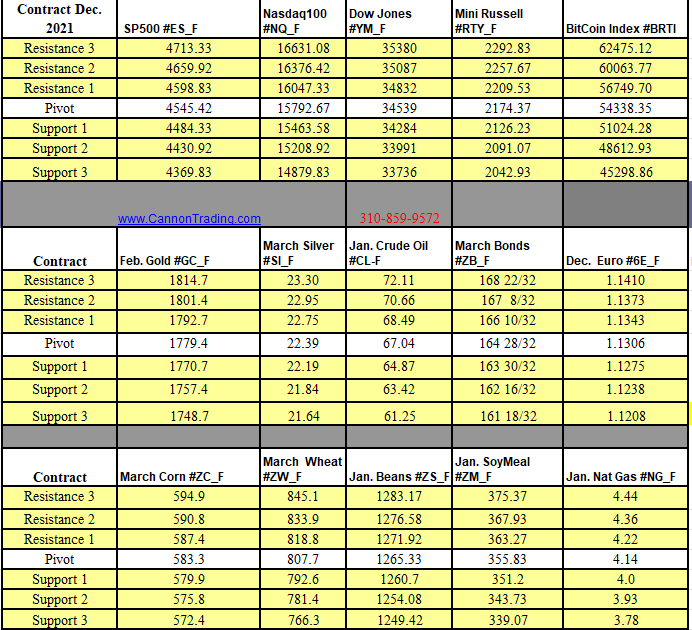
Support & Resistance Levels 12.13.2021


Weekly Levels

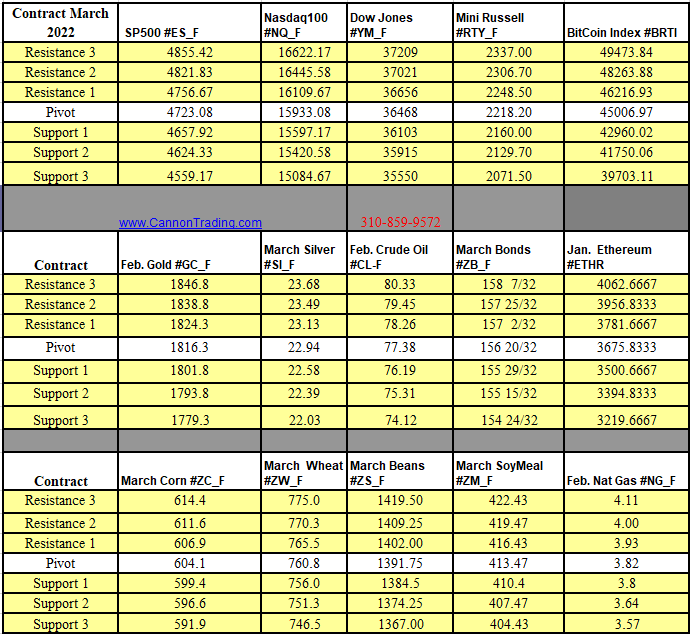
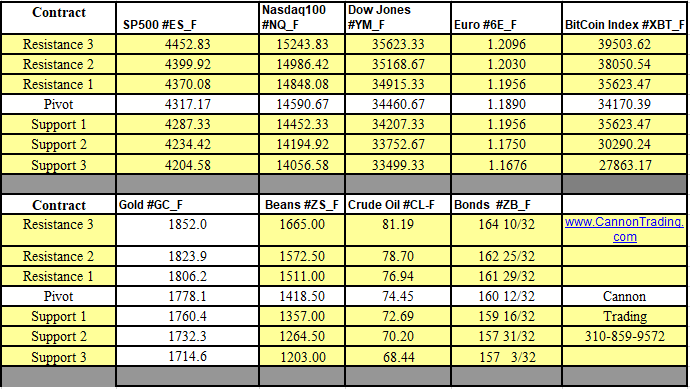
Weekly Support & Resistance Levels


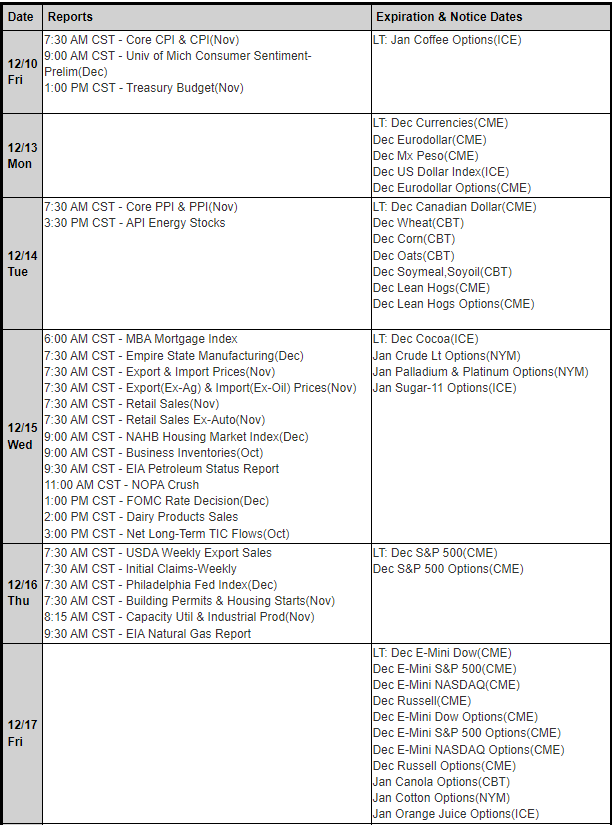
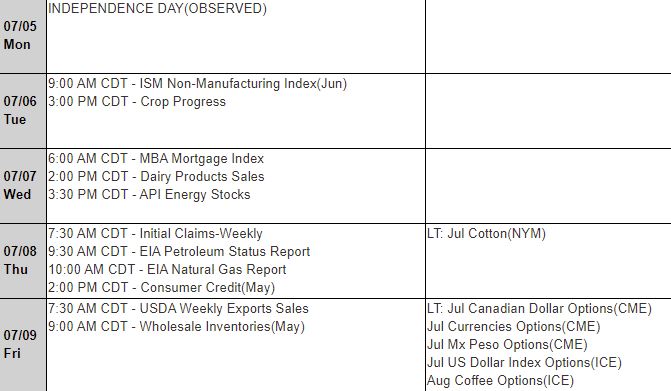
Reports, First Notice (FN), Last trading (LT) Days for the Week:

https://mrci.com

Date Reports/Expiration Notice Dates

9ed97a66 5ab4 4edc aa1d 9fced0e1bfd0

This is not a solicitation of any order to buy or sell, but a current market view provided by Cannon Trading Inc. Any statement of facts here in contained are derived from sources believed to be reliable, but are not guaranteed as to accuracy, nor they purport to be complete. No responsibility is assumed with respect to any such statement or with respect to any expression of opinion herein contained. Readers are urged to exercise their own judgement in trading

3 Main Types of Trading Days, 30 Year Bond Chart Review & Support and Resistance Levels 11.12.2021

Dear Futures Trader,

Get Real Time updates and more on our private FB group!
Yesterday we had a nice volatile day, with price action both up and down and then we followed it today ( Veteran’s Day, banks are closed) with very choppy, much narrower price action. Tomorrow is Friday, after a quiet day and with some meanigful reports – which encouraged me to share the following with you on the different types of trading days:

 In my opinion there are 3 main types of trading days:

1. The most common day are two sided trading action with swings up and down – this type of trading day is most suitable for using support and resistance levels along with overbought/oversold indicators.
2. Strong trending days, mostly one directional – this type of trading day is the least common, many times will happen on Mondays and maybe 3-5 times a month at most – this type of trading day is most suitable for using ADX, MACD crossovers and pretty much looking for pullbacks to jump on the trend perhaps with the help of parabolics.
3. Slow and/or choppy trading days – this type of trading day is best suited for taking small profits from the market by looking at volume spikes, using stochastics as possible entry signals and usually wait for a pullback before jumping in.
·A good question I’ve been asked is how can one asses what type of trading day we will have while the market is still trading….I have been doing some work in finding the answers and will be happy to hear feedback via email but here are some initial observations:
1.  Was the overnight session a wide, two sided trading range? If the answer is yes, good chances for similar trading day during the primary session (primary session is when the cash/stock market is open)
2. Mondays have the highest chance for trending days
3. The behavior of the first hour of trading can also suggests the type of action for the rest of the day.
4. If the first 30 minutes of the trading day have good volume, better chances for type 1 or type 2 trading days.
5. Low volume during the first 30 minutes can suggest a choppy (type 3 trading day)
6. Are there other strong trends in other sectors? ( bonds? metals? energies? Dollar index? )
Trading Futures, Options on Futures, and retail off-exchange foreign currency transactions involves substantial risk of loss and is not suitable for all investors. You should carefully consider whether trading is suitable for you in light of your circumstances, knowledge, and financial resources. You may lose all or more of your initial investment. Opinions, market data, and recommendations are subject to change at any time when it comes to Futures Trading.
Hourly/ 60 minutes chart click for larger image) of the 30 yr bonds (ZB or USA) for your review below. I have heard from some clients that they “like the personality of the bonds” better than the ES and NQ. Different dynamics, larger tick size – may be worth your time to follow and try in SIM MODE first
Futures US Treasury Bond 60 minute Chart
If you are looking for other reference material please contact your Cannon Broker for lists of solid, informative and helpful trading tomes

Good Trading

Trading Futures, Options on Futures, and retail off-exchange foreign currency transactions involves substantial risk of loss and is not suitable for all investors.  You should carefully consider whether trading is suitable for you in light of your circumstances, knowledge, and financial resources. You may lose all or more of your initial investment. Opinions, market data, and recommendations are subject to change at any time when it comes to Futures Trading.


Futures Trading Levels

11-12-2021


Futures Support and Resistance Levels 11.12.2021


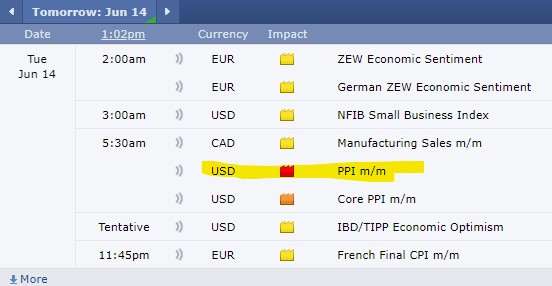
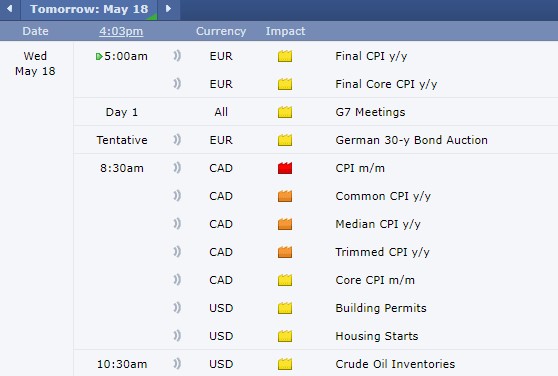
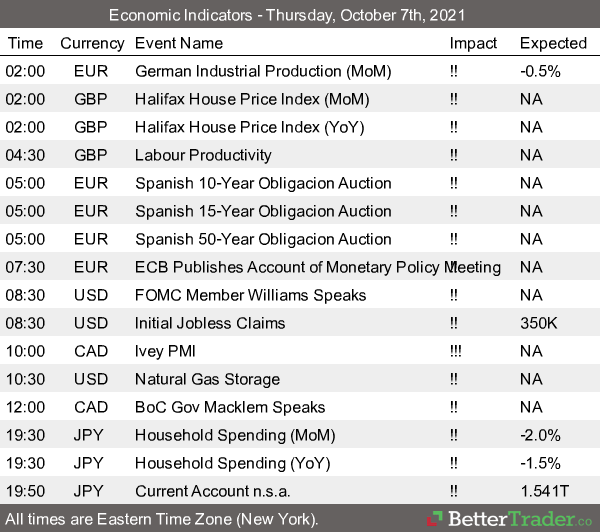
Economic Reports, source: 

https://bettertrader.co/ 

BetterTrader Reports


This is not a solicitation of any order to buy or sell, but a current market view provided by Cannon Trading Inc. Any statement of facts here in contained are derived from sources believed to be reliable, but are not guaranteed as to accuracy, nor they purport to be complete. No responsibility is assumed with respect to any such statement or with respect to any expression of opinion herein contained. Readers are urged to exercise their own judgement in trading.

A Trader’s Guide to Futures 10.07.2021

Dear Traders,

Get Real Time updates and more on our private FB group!

Separator

Everyone loves an introductory guide to trading futures! Even experienced traders can learn something new or refresh their strategies by reviewing this trader’s guide to futures. If you’re a trader who is interested in branching out from equities or cash FX into futures, this guide will provide a great starting point. If you already know something about futures trading, you can jump to any chapter for a review.  Additionally, you can also go to the back of the booklet and test your knowledge in our helpful Futures Quiz.
Some of the guide sections include:

Who Trades Futures?

What Types of Traders are There?

What Makes Futures Trading Different?

How Does a Trade Work?

How Do I Get Started?

Futures Quiz

84866fe7 02fe 4369 8ec2 42e8853921e5

Futures Trading Levels

10-07-2021

Support & Resistance Levels 10.07.2021

Did you know?
Cannon offers over 10 TRADING PLATFORMS CLICK HERE for a demo

Economic Reports, source: 

 www.BetterTrader.co

Better Trader Reports 10.07.2021


This is not a solicitation of any order to buy or sell, but a current market view provided by Cannon Trading Inc. Any statement of facts here in contained are derived from sources believed to be reliable, but are not guaranteed as to accuracy, nor they purport to be complete. No responsibility is assumed with respect to any such statement or with respect to any expression of opinion herein contained. Readers are urged to exercise their own judgement in trading as well as options on futures.

Weekly Newsletter #1057 Fourth of July Trading Schedule; Why Traders Lose Money? & Trading Levels for Week Ahead

Cannon Futures Weekly Newsletter Issue # 1057

Dear Traders,

Like us on FaceBook!
Get Real Time updates and market alerts on Twitter!
Get Real Time updates and more on our private FB group!
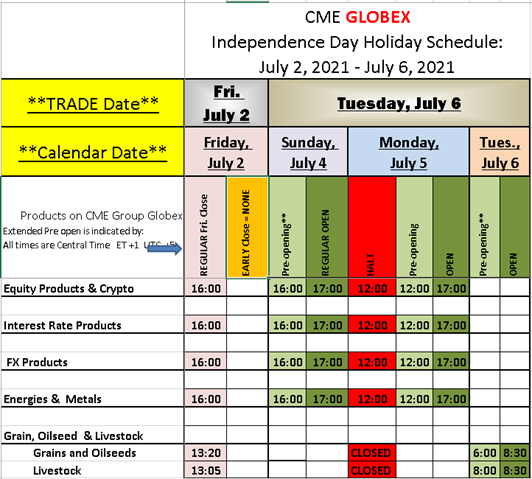
Wishing all of you a safe, relaxing holiday!
Please see trading schedule below.
cbf7ce6c 7a36 4644 afce 934a8a12bb80

Trading 201: Why do most futures traders lose money and how can you improve your odds?

Watch the 45-minute recorded webinar where Ilan shared some of his observations of why a large percentage of traders lose money trading futures.
*Reasons why most traders lose
*Looking at tools you can utilize and improve your odds
*Review different methods/concepts of trading
*Ilan shares many tidbits that can help variety of traders
*Ilan answers questions
Watch the recorded 45-minute webinar which in our opinion contains some of the most valuable advise both new and advanced traders can utilize
Good Trading

Trading Futures, Options on Futures, and retail off-exchange foreign currency transactions involves substantial risk of loss and is not suitable for all investors.  You should carefully consider whether trading is suitable for you in light of your circumstances, knowledge, and financial resources. You may lose all or more of your initial investment. Opinions, market data, and recommendations are subject to change at any time when it comes to Futures Trading.


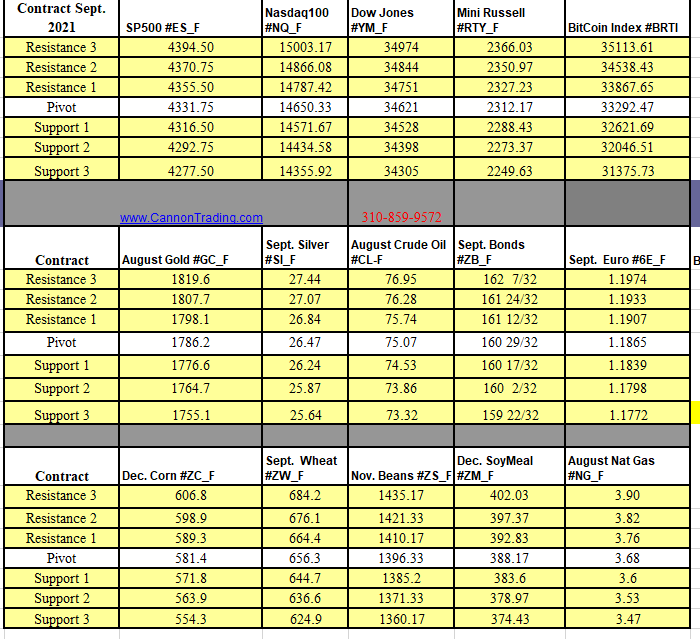
Futures Trading Levels

7-05/06-2021

24b13634 5fa6 4392 ab8b 26220894377b


Weekly Levels

45c4f043 7569 42cd 9539 82dd24b5c2bd

Reports, First Notice (FN), Last trading (LT) Days for the Week:

https://mrci.com

Date Reports/Expiration Notice Dates

753d2157 9724 4e59 92b3 d7033f8643cf

This is not a solicitation of any order to buy or sell, but a current market view provided by Cannon Trading Inc. Any statement of facts herein contained are derived from sources believed to be reliable but are not guaranteed as to accuracy, nor they purport to be complete. No responsibility is assumed with respect to any such statement or with respect to any expression of opinion herein contained. Readers are urged to exercise their own judgment in trading

Maybe you should take a look at trading bond futures ( ZB)?

____________________________________________________________________

Voted #1 Blog and #1 Brokerage Services on TraderPlanet for 2016!!  

____________________________________________________________________

Dear Traders,

Like us on FaceBook!
My colleague, John Thorpe, just shared a good post discussing interest rates futures, how it affects your mortgage and more. You can read the full post here.
Reading the post reminded me how much I personally like both the 30 yr bonds and 10 yr bonds for shorter term and medium term trading.
If you are a day-trader, read below and start following the bonds or 10 years and let us know if we can assist you in any way!
The ZB or the 30 year offers a different type of personality than the mini SP and other indices. It is more sensitive to certain economic reports and trades differently than other markets, just a total different personality.
The tick size on the ZB is 1/32 or $31.50 per one point/ tick.
I included some contract specs on the T Bonds futures below as well as an intra-day chart for your review.
The 10 yr notes or the ZN are very similar to the 30 yr except it does trade in half points, so minimum fluctuation is $15.625 and the 10 years will have smaller moves than the 30 yr although 99% in the same direction ( opens the door for spread trading on a daytrading basis).
If you like to have access to the trading signals like shown in the chart below, click on the get started now.
30 yr Treasury Bond Futures Specs
Hours: 05:00 PM previous day to 4:00 PM Central Time
Margins: $2530 initial, $2300 Maint. ( as of the date of this newsletter)
Point Value: full point = $1000 ( Example: 144.16 to 145.16 ). Min fluctuation is 0.01 = $31.25 ( Example: 144.16-144.17) Settlement: Physical Delivery
Months: Quarterly (March,June,Sep,Dec)
Weekly Options:YES
Some of the basic fundamentals to keep in mind when you are considering trading the U.S. 30yr Treasury Bonds for this matter:
1. Interest Rates.
2. FOMC Rate decisions and Language
3. Focus in macroeconomics
4. Bond Prices have an inverse relationship to Interest rates
5. Correlation to US Dollar prices
6. Inflationary prospects
7. Geopolitical Stability
8. U.S. Fiscal and Monetary Stability
Our brokers here at Cannon will be happy to chat about the Bond market, other interest rate products, other futures, options, futures spreads and much more! Feel free to contact us at any time.
Feel free to click on the chart below to view on larger scale.
24828127 8b10 4845 bf66 9d0405a6dbef
bdf6db09 7692 48a4 8450 9a8d7d5f2d31

Good Trading

Trading Futures, Options on Futures, and retail off-exchange foreign currency transactions involves substantial risk of loss and is not suitable for all investors.  You should carefully consider whether trading is suitable for you in light of your circumstances, knowledge, and financial resources. You may lose all or more of your initial investment. Opinions, market data, and recommendations are subject to change at any time.


Futures Trading Levels

07-18-2019


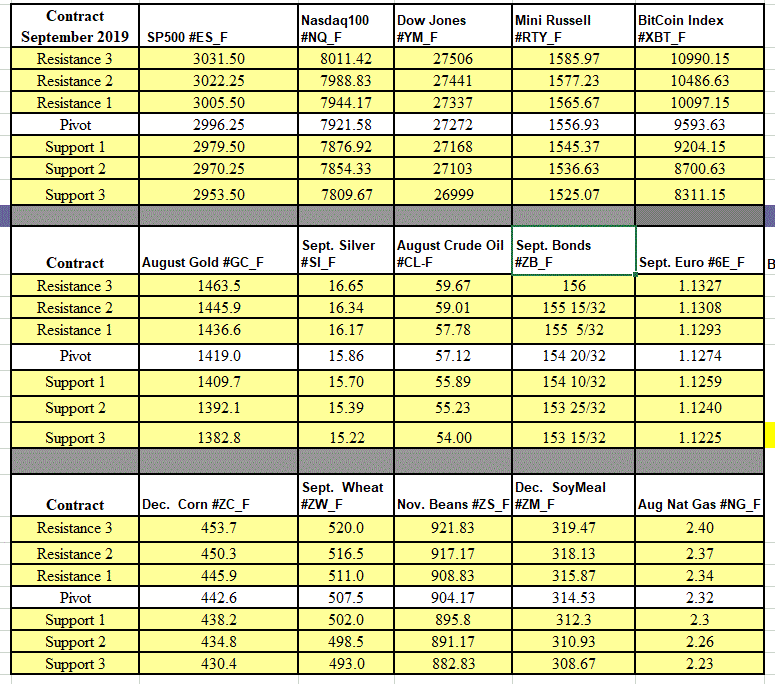
00d712c5 035c 47fa a3f3 a9a6daac6464


9bc7688a c378 4d73 a8b4 4884da770536
try free demo account


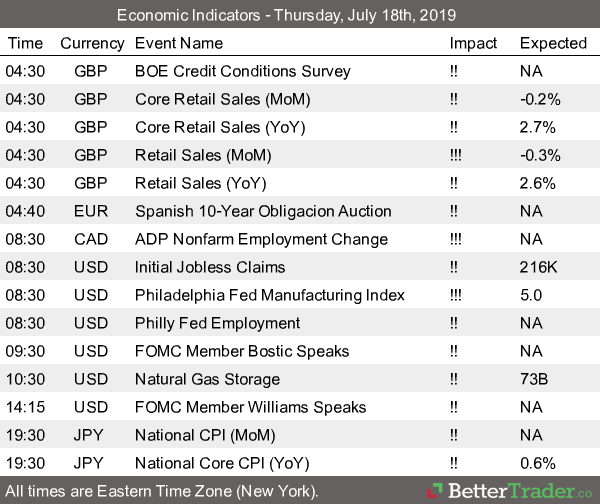
Economic Reports, source: 

bettertrader.co

9fade731 2c4f 421e ac01 2c2c04a7869b


This is not a solicitation of any order to buy or sell, but a current market view provided by Cannon Trading Inc. Any statement of facts here in contained are derived from sources believed to be reliable, but are not guaranteed as to accuracy, nor they purport to be complete. No responsibility is assumed with respect to any such statement or with respect to any expression of opinion herein contained. Readers are urged to exercise their own judgement in trading.

Interest Rate Futures, Real Estate and Mortgage Rates

By John Thorpe, Senior Broker


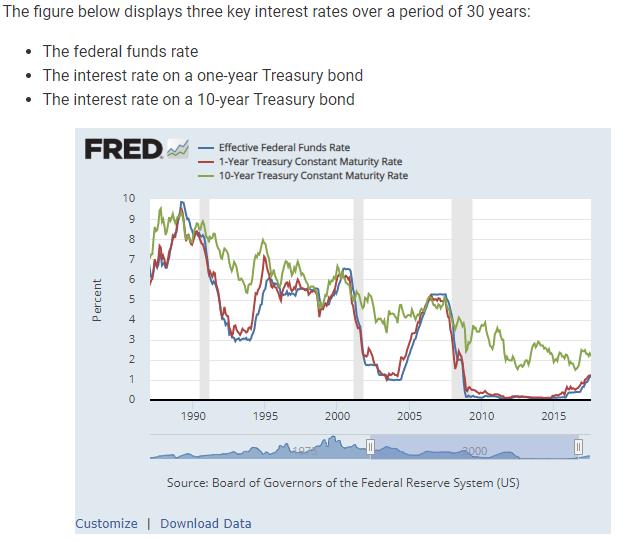
Over the course of the last 45 years, whether you own a small monopoly of commercial buildings or a condo on Oak street U.S.A. your investments are subjected to the actions of the Federal Reserve Bank.


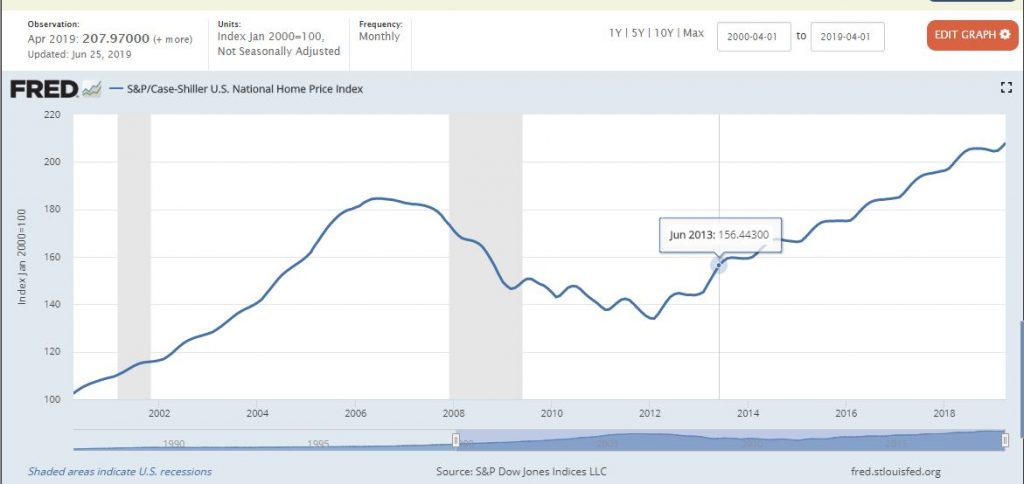
The Federal Reserve Bank seeks to provide stability in the largest world economy through interest rate regulation. Its mandate is to use financial tools to satisfy two congressional mandates, 1: Full Employment and 2: Moderate Inflation to a 2% annualized rate; Move too far too fast in any direction with policy shifts and financial perils for all! may be in the offing. The economy could move too fast in the wrong direction or too fast in the right direction which can lead to an overheating and a bursting of an economic bubble. Look no further than Savings and Loan crisis in the 1980’s and 90’s, the Japanese housing market collapse in 1989 (Japan is currently still struggling with a zero interest rate environment 30 years later) the Dot Com bubble after Y2K and most recently , the housing market collapse, which began with the bankruptcy of Iceland, no one paid attention, then the bankruptcy of Ireland, again, no one paid attention, then the bankruptcy of Bear Stearns,  some paid attention  (what did any of these entities have to do with the value of our homes, we thought) then Lehman brothers collapsed in September of 2008 and everyone paid attention as our home prices collapsed.

Use Google, DuckDuckGo, Bing or any of your favorite search engines and type in

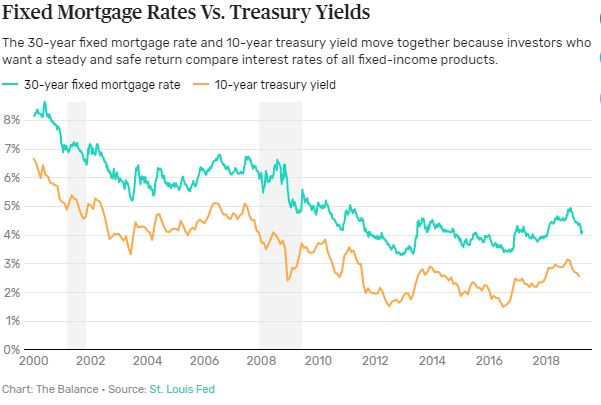
10 yr. correlation with mortgage rates


You will find search pages full of information about the importance of interest rate policy and its effect on mortgage rates, specifically the Fedfunds rate.

FedFundsVS10


Whether you have a 30 yr fixed, a 15 yr fixed or a 5/1 ARM  (usually capped after 5 years) you need to protect your largest investments by first understanding the tools available to the public to monitor these markets and second, knowing you can contact a professional to discuss the myriad of ways to hedge your real estate portfolio and be ready when you need to by utilizing the futures markets to protect your investments.


The hypothesis:  Generally speakingand largely from region to region diversity, when interest rates go lower, home prices go higher. Lower interest rates lead to increases in the value of real assets. Mortgage rates are sensitive to changes in Fed Policy, the 10yr note being the reference financial instrument moves in response to market reactions to Fed policy shifts.


When interest rates go higher, a definite time lag exists in the long run may make  home prices move lowerand real asset prices lower.


Watch futures market prices in the interest rate futures. Get comfortable watching the interest rate futures contracts.


I am by no means offering a pure hedge or even a short-term hedge in my analysis.

I believe what you will see and get a sense of the ebbs and flows of these markets from a visual perspective  while you are learning about the base currency (US Dollar) valuation of real assets changing and thereby affecting not only the value of the real assets you hold but also the cost to maintain those assets. The interest rate futures markets give you the clearest picture of how policy equates to real rates for you, the mortgage holder. 10yr Note Futures prices and chart


Major trends that are a serious harbinger of future housing price changes are important to understand so you may act to preserve, maintain and profit from potential shifts in policy.
 

MortgageVSTreasury


FRED


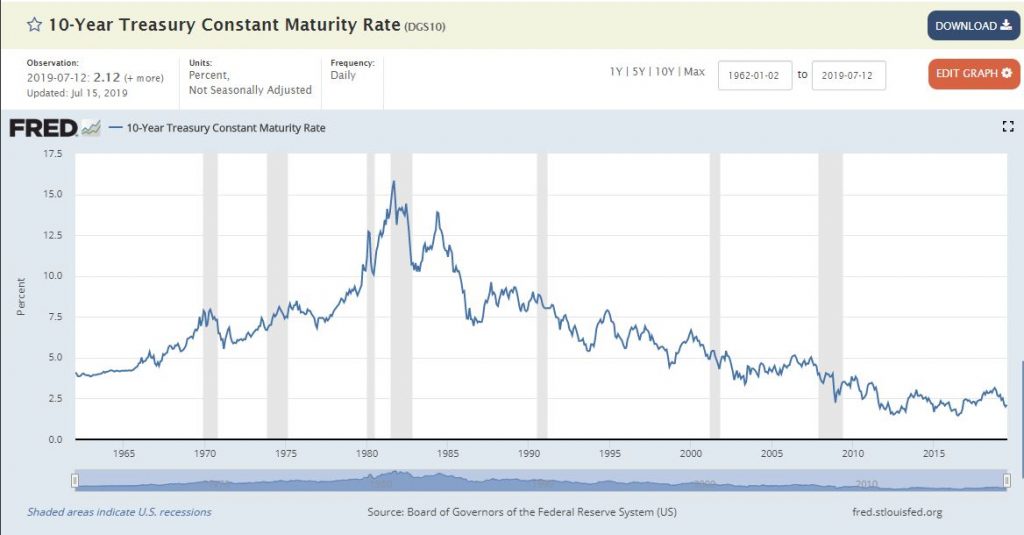
Between 2008 and 2012 during the last recession, a major fed policy tool used was a series of fed fund rate reductions (net effect is the cost of money becomes cheaper relative to real asset prices), these calculated moves lowered the interest rate on longer term debt obligations  10Yr. Note Futures Prices and Chart as well as all dollar denominated Treasuries.


As you can see, Mortgage rates, I mean the 10yr Treasury Note rates (Freudian slip, sorry), are still at or near all-time lows.
Treasury

In Summary, Familiarizing yourself with the interrelationships among Mortgage rates, 10 year treasuries and fed fund policy shifts are an important starting point for a conversation with a professional about protecting your family’s biggest investment.


A Cannon Trading professional is available between 8:30am to 5:00pm Eastern to answer your questions Call Now


Disclaimer – Trading Futures, Options on Futuresand retail off-exchange foreign currency transactions involves substantial risk of loss and is not suitable for all investors. Past performance is not indicative of future results. You should carefully consider whether trading is suitable for you in light of your circumstances, knowledgeand financial resources. You may lose all or more of your initial investment. Opinions, market dataand recommendations are subject to change at any time.
 

Selling Future Options Premium

Futures Options Writing


Have you ever wondered who sells the futures options that most people buy? These people are known as the option writers/sellers. Their sole objective is to collect the premium paid by the option buyer. Option writing can also be used for hedging purposes and reducing risk. An option writer has the exact opposite to gain as the option buyer. The writer has unlimited risk and a limited profit potential, which is the premium of the option minus commissions. When writing naked futures options your risk is unlimited, without the use of stops. This is why we recommend exiting positions once a market trades through an area you perceived as strong support or resistance. So why would anyone want to write an option? Here are a few reasons:

  1. Most futures options expire worthless and out of the money. Therefore, the option writer is collecting the premium the option buyer paid.


  1. There are three things that happen to the underlying price of the option: Price goes up, goes down or stays the same. If when the option expires, the market price was at or below your strike price you collect all the premium if two of those things happen Time decay is the option writer’s friend.


  1. The writer believes the futures contract will not reach a certain strike price by the expiration date of the option. This is known as naked option selling.


  • To hedge against a futures position. For example: someone who goes long cocoa at 850 can write a 900 strike price call option with about one month of time until option expiration. This allows you to collect the premium of the call option if cocoa settles below 900, based on option expiration. It also allows you to make a profit on the actual futures contract between 851 and 900. This strategy also lowers your margin on the trade, and should cocoa continue lower to 800, you at least collect some premium on the option you wrote. Risk lies if cocoa continues to decline, because you only collect a certain amount of premium and the futures contract has unlimited risk the lower it goes. So you should trade with a stop on the futures contract. You can read on different strategies using options on futures here:


https://www.cannontrading.com/tools/education-futures-options-trading-101


Cannon offers SPAN margins for options sellers.

Many brokers will restrict or increase the margins required for options sellers, or traders who like to “collect premium”, but here at Cannon we can find you the best set up utilizing the multiple clearing arrangements we have with more than a few FCMs.

How much margin is required to sell a futures option?

That is a question we get asked often. The exact number is an output of SPAN margins. SPAN deserves a post on its own, but what it stands for is: Standard Portfolio Analysis of Risk. The formula takes into consideration volatility, time value, distance of strike price from current underlying future, and more.

Outright options may be easier to “guesstimate” margin than more complex strategies and spreads, but our free platform, E-Futures Int’l (https://www.cannontrading.com/software/e-futures-international )has a margin calculator built in so you can calculate the margin you will need for different strategies.

Commission for selling options on futures?

Commissions will vary based on the following:

Are you trading online or with a broker?

Trading volume

Account size

Risk responsibility.

The rates for selling options will vary from as low as $0.25 per side + fees for HIGH VOLUME, institutional accounts to $30 per side + fees for retail, broker assisted accounts.


Selling options is NOT for newcomers as it involves higher risk than buying options.

However, selling options and trading option spreads may offer an edge if done with proper risk management. No guarantees are made here.

Our strength at Cannon is our ability to offer CUSTOMIZED trading solutions, so contact a broker at:

https://www.cannontrading.com/company/contact

and learn more about risks and opportunities in futures trading (https://www.cannontrading.com/riskopportunity), what software you can use, consult with a broker on margin, commissions and strategy questions and much more!


Trading Futures, Options on Futures, and retail off-exchange foreign currency transactions involves substantial risk of loss and is not suitable for all investors.  You should carefully consider whether trading is suitable for you in light of your circumstances, knowledge, and financial resources. You may lose all or more of your initial investment. Opinions, market data, and recommendations are subject to change at any time.
Trading Videos+ Trading Levels for June 4th

______________________________________________________________

Voted #1 Blog and #1 Brokerage Services on TraderPlanet for 2016!!  

____________________________________________________________________

Dear Traders,

Like us on FaceBook!
Get Real Time updates and market alerts on Twitter!
Trading 101: Trading videos on bollinger bands, Parabolics, Trading levels, Range Bars and more!
Watch the latest trading videos we have posted and shared with our clients!
In this week’s newsletter we are sharing two videos, each a few minutes long. The videos discuss practical tips for trading and sharing our experience with you
1. Using bollinger Bands as a possible tool for exiting trades
2. One way you can use the Parabolics study ( also known as PSAR) to manage current positions, possibly as a trailing stop
3. Different ways traders can utilize support and resistance levels in their trading.
4. Entering trades on a stop, using “price confirmation”.
5. Utilizing Range Bar charts for shorter term trading as a way to try and filter out some noise.
logo
stars

Good Trading

Trading Futures, Options on Futures, and retail off-exchange foreign currency transactions involves substantial risk of loss and is not suitable for all investors.  You should carefully consider whether trading is suitable for you in light of your circumstances, knowledge, and financial resources. You may lose all or more of your initial investment. Opinions, market data, and recommendations are subject to change at any time.
 

Futures Trading Levels

06-03-2019

c0cd9d79 f227 438b 9abe 909d01d157d5


Economic Reports, source: 

bettertrader.co

S
31ebd27e bd58 4a19 ba72 df1d71fa6fd0


This is not a solicitation of any order to buy or sell, but a current market view provided by Cannon Trading Inc. Any statement of facts here in contained are derived from sources believed to be reliable, but are not guaranteed as to accuracy, nor they purport to be complete. No responsibility is assumed with respect to any such statement or with respect to any expression of opinion herein contained. Readers are urged to exercise their own judgement in trading.

Bonds Futures and Crude Oil Futures Unique Patterns

Hello Traders,

For 2014 I would like to wish all of you discipline and patience in your trading!

Time sure does tick a bit different in the commodities and futures world….

Some traders know time has passed quickly when it is time to change to the Dec. contract versus the Sept. contract, others may notice it when they think “wow, monthly unemployment is this Friday, time sure flies…” and still other traders, perhaps professionals and money managers notice it when one month ends and another starts and it is time to share monthly results with their clients…..

Either way you look at it, hope October will be a great trading month!

Today I noticed a couple of market behaviors I have noticed in the past and wanted to share with you.

The first is us Bonds trading behavior on the last trading day of the month on the last 15 minutes of the old pit session, i.e. 13:45 to 14:00 central time.

While I did not spend any time trying to predict the direction of the move, I seen it many times, the bonds will make a 10-15 ticks ( 15 tick in bonds = $500 per contract) move during the last 15 minutes as large traders position themselves ahead of months close.

Below is a 15 minute chart of Bonds from today….notice the very tight range all day long until the last 15 minutes….if you go back to the last trading day of the month, you will notice this pattern more often than not. Of course, I leave the important work to you…and that is which way and how can one try to take advantage of it….PS: My trade system below missed entering the short by 1 tick )-:


Custom USA - 30Yr US Treasury Bonds (Globex), Equalized Active 15Min Continuation
Custom USA – 30Yr US Treasury Bonds (Globex), Equalized Active 15Min Continuation


The second pattern for you to investigate if interested is the behavior of crude oil futures around “round numbers”. Today was obviously a HUGE move in crude ( down over $3 or $3000 per contract or 3.5%) but notice the 10 seconds chart I am sharing with ( yes, seconds, not minutes…) of what happened when crude broke below 93.00 and 92.00 today…..Once again, the million dollar question, how and can you take advantage of it? Obviously in this case it seems like there were MANY sell stops placed right below the round numbers which resulted in another accelerated move to the down side.

Crude breaking below $93.00


CLE - Crude Light (Globex), Equalized Active Continuation, Primary Session, 10Sec
CLE – Crude Light (Globex), Equalized Active Continuation, Primary Session, 10Sec


Crude breaking below $92.00

CLE - Crude Light (Globex), Equalized Active Continuation, Primary Session, 10Sec
CLE – Crude Light (Globex), Equalized Active Continuation, Primary Session, 10Sec


Continue reading “Bonds Futures and Crude Oil Futures Unique Patterns”

Volatility Returns to Stock Index Futures – Levels & reports for August 5th

Hello Traders,

For 2014 I would like to wish all of you discipline and patience in your trading!

As I do from time to time, I like to share resources I feel are worthy of exploring, such is the one below by www.factset.com :

Overview:

  • US equities came under pressure this week as the S&P 500 suffered its biggest weekly pullback in over two years. Despite the magnitude of the move, there was not an overriding theme that captured the price action.
  • Widely cited headwinds included Fed angst, geopolitical tensions, disappointing earnings, the latest flare-up on the Eurozone periphery, the slowdown in the housing recovery, Argentina’s default, fatigue, technical and continued worries about stretched valuations and crowded trades.
  • However, there were notable pockets of reprieve surrounding some of these concerns, particularly when it came to monetary policy and earnings. In addition, geopolitics has not proved to be a sustainable directional driver, while the tipping point search has been in play for a while.
  • While largely on the backburner, there were some positive dynamics at work this week. The pickup in strategic M&A activity continued, while there more signs of stabilization in China, where the Shanghai Composite bucked the sell off in global equities with a nearly 3% rally.
  • There did not seem to be any great signals from the sector performance this week with the broad-based nature of the risk-off trade and company-specific takeaways from a very busy week of earnings. Energy and industrials put in the worst performance, while telecom held up the best.

Fed angst finds some reprieve:

  • Worries about the Fed being behind the curve and the potential for an earlier and more aggressive start to the policy normalization process continued to get a lot of attention as a source of market angst this week. There were two particular areas of focus. One was the 4% growth in Q2 GDP, which was a full point ahead of the consensus. The other was the 0.7% increase in the Q2 employment cost index (ECI), which was ahead of the 0.5% consensus and marked the fast growth in six years. The hotter ECI print was of particular interest because it followed on the heels of an FOMC statement that hedged an upgrade of the assessment of the labor market by noting that a range of indicators suggest a significant underutilization of labor resources. However, there was some reprieve late in the week as average hourly earnings were flat in July, leaving them up just 2.0% y/y. This compared to expectations for a 0.2% m/m and 2.2% y/y increase. In addition, while a sixth straight month of nonfarm payrolls growth above 200K kept the recovery traction theme in focus, the 209K was slightly below expectations and not robust enough to impact liftoff expectations. Finally, despite the hype surrounding Fed fears, yields in the front and belly of the curve were actually lower on the week.

Continue reading “Volatility Returns to Stock Index Futures – Levels & reports for August 5th”