Triple Witching Friday; Powerful Market Shift! 3 Crucial Facts About Triple Witching Friday

9dc1e02e d5f7 4ff4 abf7 1df60775f196

Triple Witching!

triple witching

Triple Witching tomorrow!

Stock Index March contracts (i.e., the E-mini and Micro S&P, Nasdaq, Dow Jones and Russell 2000.) expire Friday, March 21st (8:30 A.M., Central Time). At that point, trading these contracts halts. Stock index futures are CASH SETTLED contracts. If you hold any March futures contracts through 8:30 A.M., Central Time on Friday, they will be offset with the cash settlement price, as set by the exchange.

Triple Witching!

FRONT MONTH IS NOW JUNE, the symbol is M25, example for MICRO mini SP is MESM25

Things to know about Triple Witching

A “triple witching,” is NOT without risk for holders of futures and futures option contracts.

A triple witching is the simultaneous expiration of stock options, index futures, and index futures options that occurs four times a year.

The first triple witching of 2025 will take place this Friday. Futures Stock indices and futures Options cease to allow trading at the opening bell of the Cash Stock market and settle, NOT to the final traded price at that time but, at a fixed settlement price based on where all the stocks making up the index have opened, this becomes the cash settled price for those contracts not offset prior to the trading halt.

Triple Witching!

S

Bloomberg Commodity Index

The Bloomberg Commodity Index is a basket of 24 commodities spread across energy, grains, softs, livestock, industrial and precious metals. The weekly chart has developed a 2-year sideways range of trade. IF the chart can break out to the topside, there are upside PriceCount objectives in place which suggest that this index would have significant potential to run.

2aad4e38 a7bc 41e4 acd9 f2709d9d25fc

Chart above is provided by QT Market Center, A Swiss army knife charting package that’s not just for Hedgers, Cooperatives and Farmers alike but also for Spread traders, Swing traders and shorter time frame application for intraday traders with a unique proprietary indicator that can be applied to your specific trading needs.

Free Trial Available

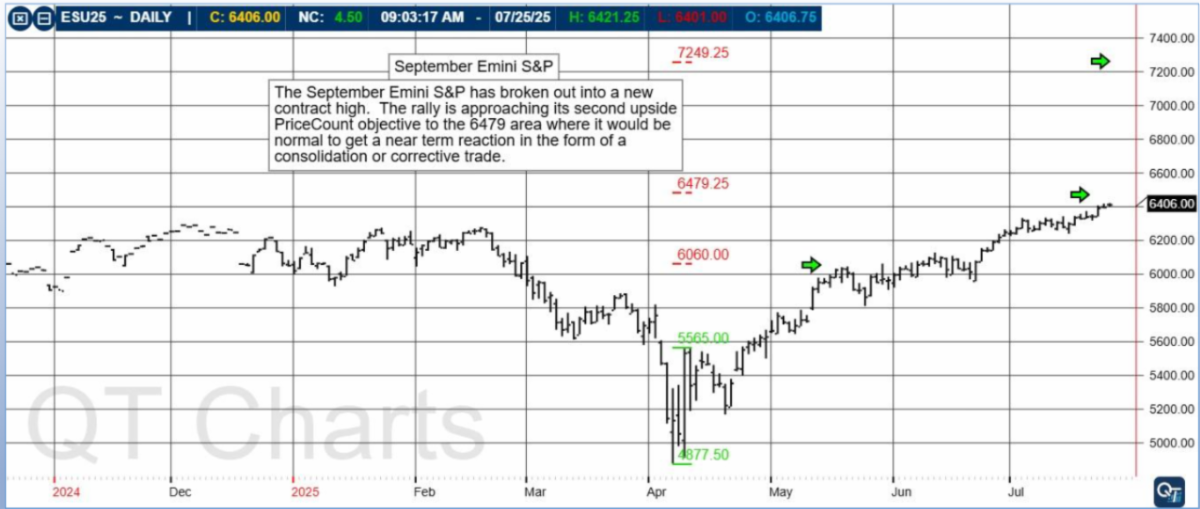
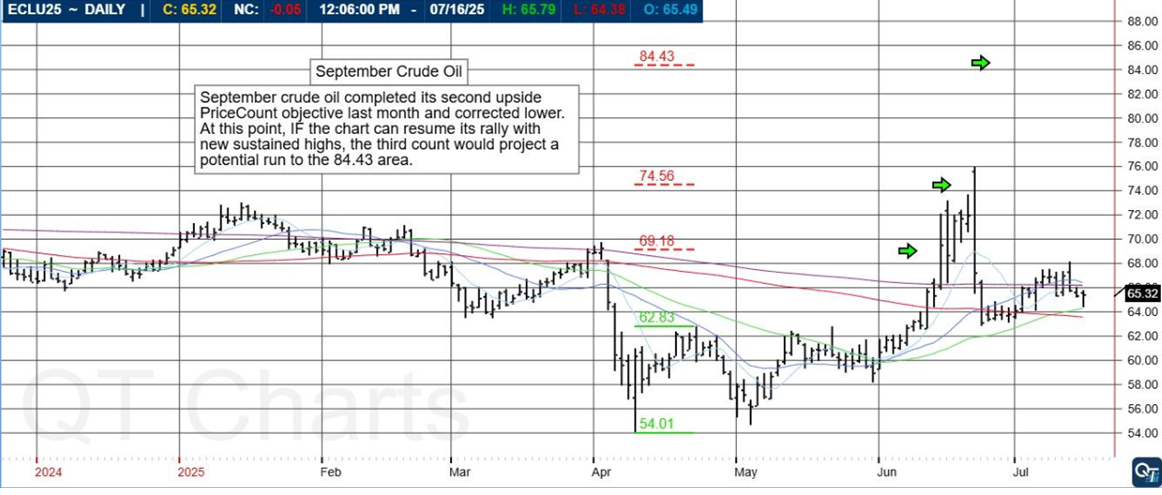
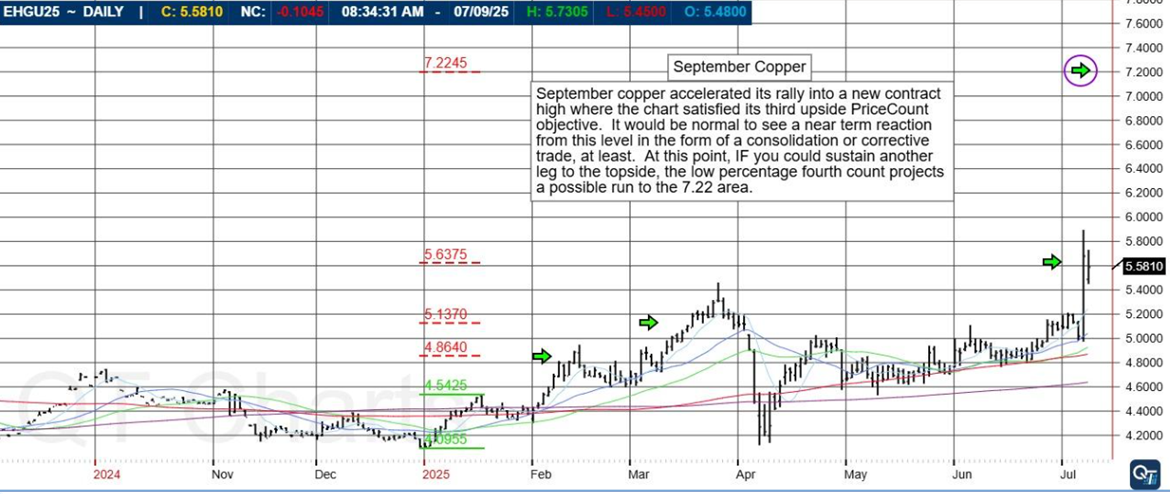
The PriceCount study is a tool that can help to project the distance of a move in price. The counts are not intended to be an ‘exact’ science but rather offer a target area for the four objectives which are based off the first leg of a move with each subsequent count having a smaller percentage of being achieved. It is normalfor the chart to react by correcting or consolidating at an objective and then either resuming its move or reversing trend. Best utilized in conjunction with other technical tools, PriceCounts offer one more way to analyze charts and help to manage your positions and risk. Learn more at www.qtchartoftheday.com

Trading in futures, options, securities, derivatives or OTC products entails significant risks which must be understood prior to trading and may not be appropriate for all investors. Past performance of actual trades or strategies is not necessarily indicative of future results.

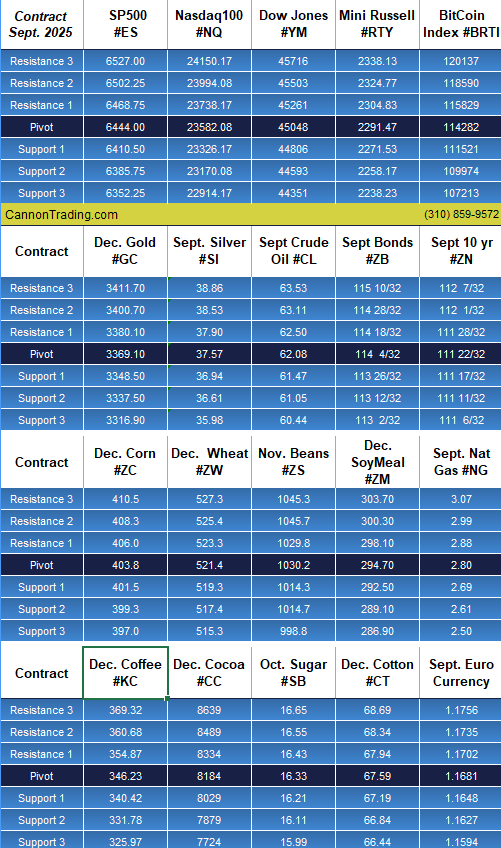
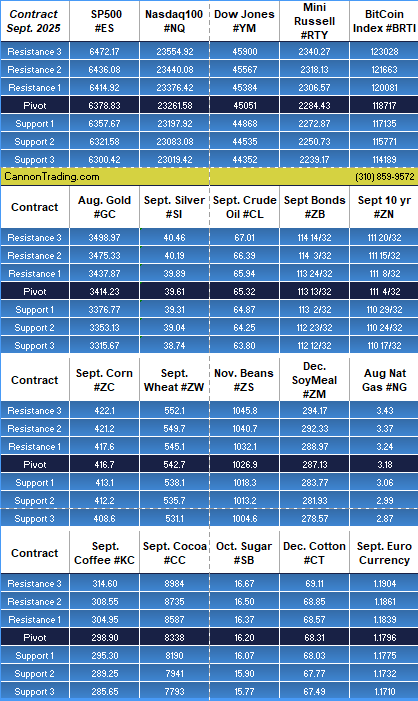
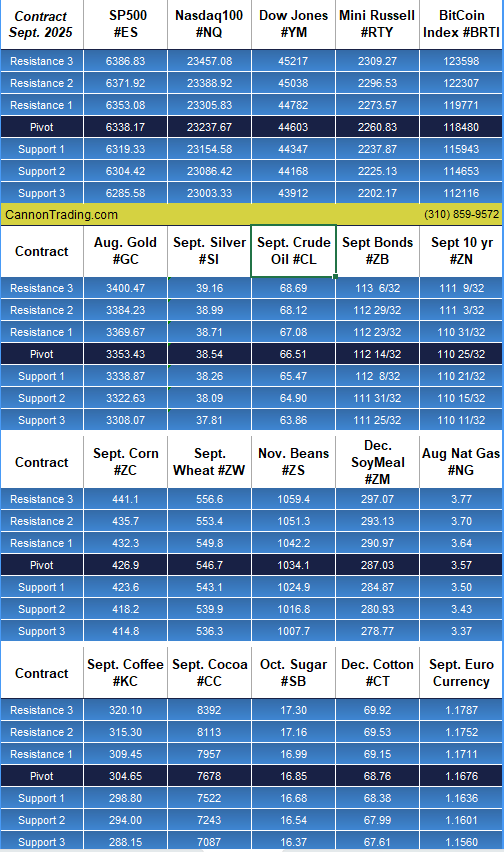
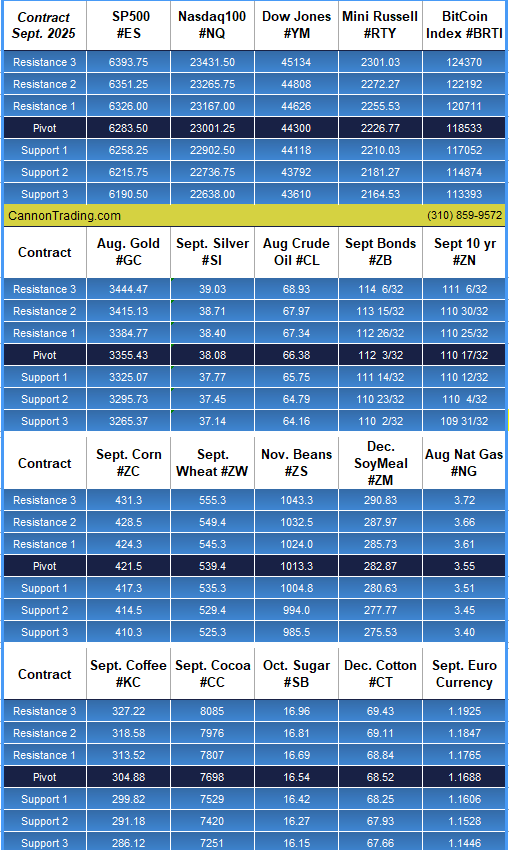
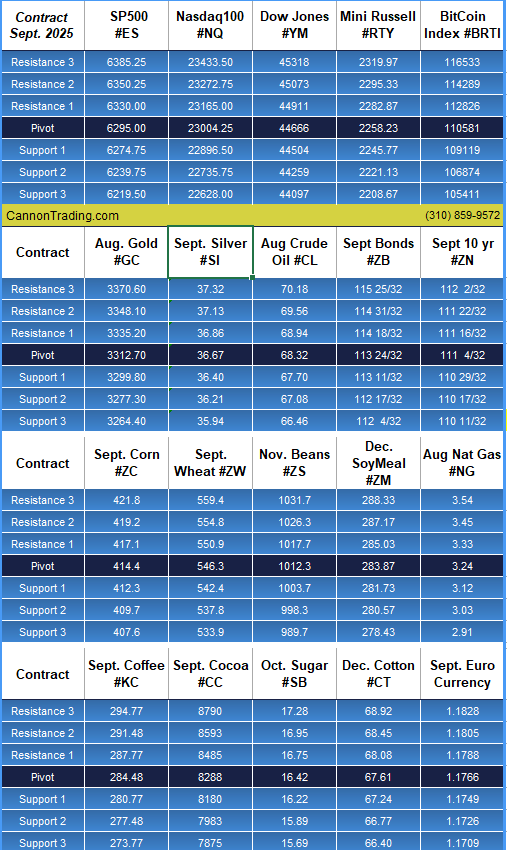
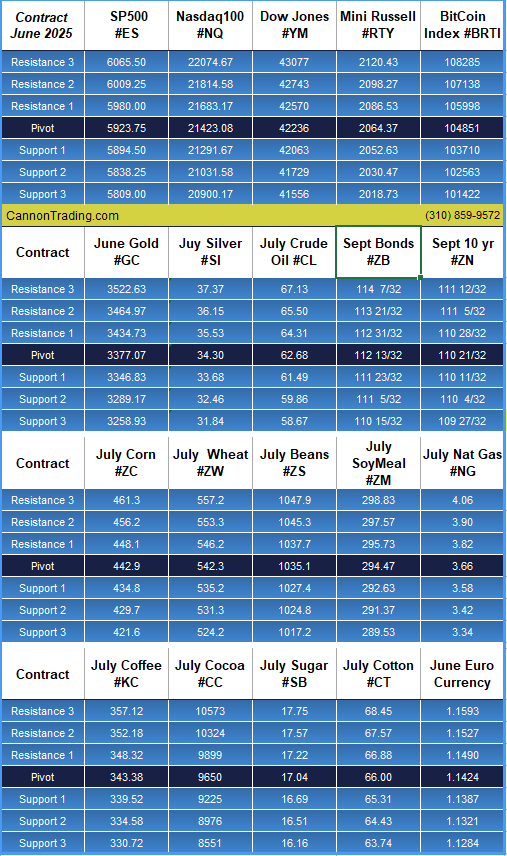
Daily Levels for March 21st, 2025

d8ade829 a3ed 41e9 b32f 40e8157071f7

Want to feature our updated trading levels on your website? Simply paste a small code, and they’ll update automatically every day!

Click here for quick and easy instructions.

822b33c5 2339 45ed bc84 e9c8f8c7358e

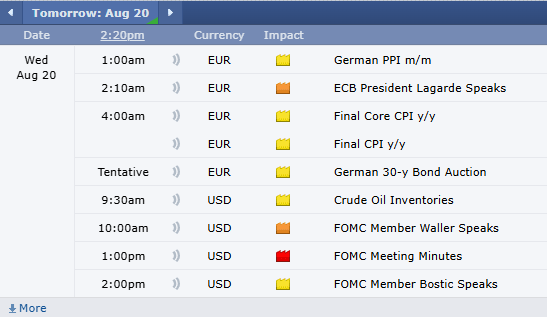
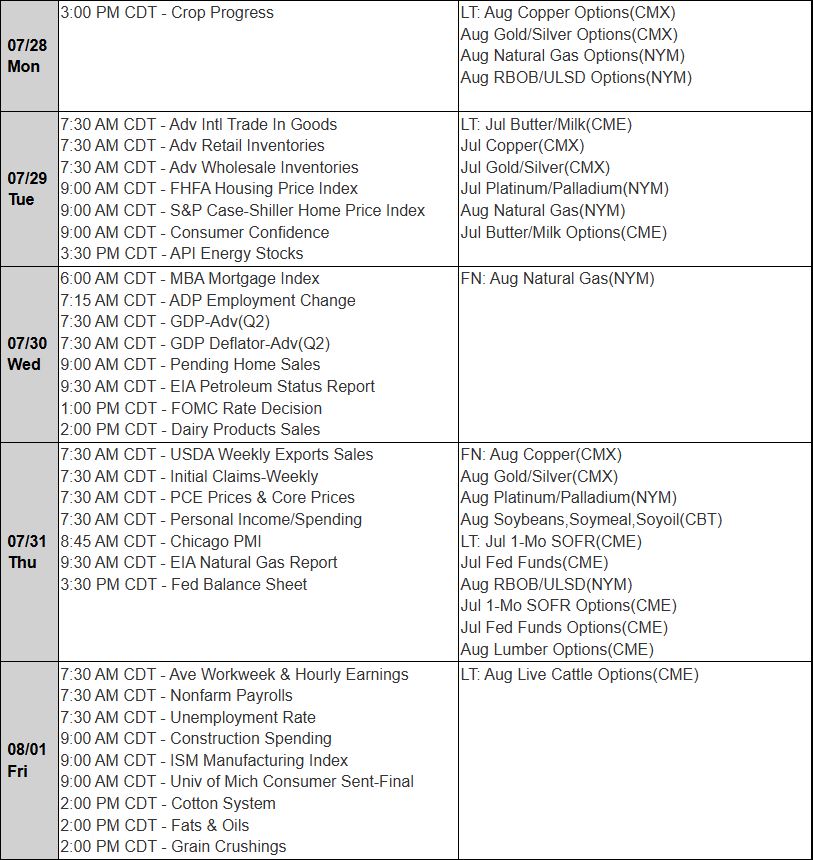
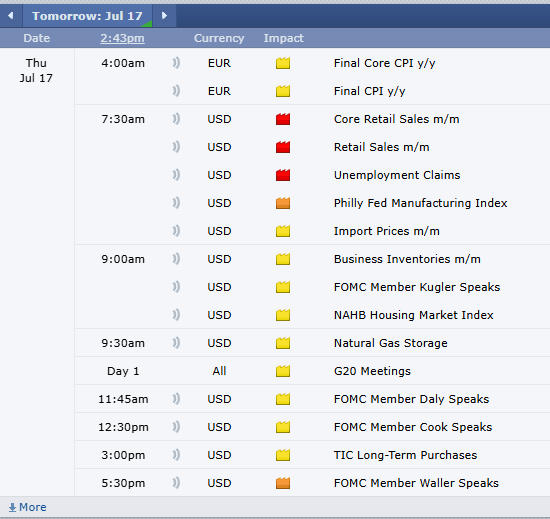
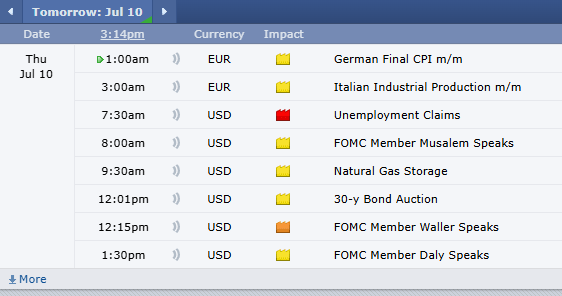
Economic Reports

provided by: ForexFactory.com

All times are Eastern Time (New York)

280a59ac 9d9b 45c4 9938 d470749cb78d

Find us on Trustpilot

stars

Trading Futures, Options on Futures, and retail off-exchange foreign currency transactions involves substantial risk of loss and is not suitable for all investors. You should carefully consider whether trading is suitable for you in light of your circumstances, knowledge, and financial resources. You may lose all or more of your initial investment. Opinions, market data, and recommendations are subject to change at any time.

Call Now

Join our Private Facebook group

Subscribe to our YouTube Channel

Listen to our podcast: Subscribe on AppleSpotify, Amazon

or wherever you listen to podcasts!

S
Facebook  Instagram  LinkedIn
S
ef3ab1c9 8d6d 4e60 a3f1 af5d9d4ecbb3
Services
Software
Tools
Community
Contact

FOMC: Shocking Decision Just Sent Gold Soaring: 3 Big Reasons Why

9dc1e02e d5f7 4ff4 abf7 1df60775f196

Market Highlights

by Mark O’Brien, Senior Broker

The Day After FOMC

fomc

FOMC Meeting Update  

The FOMC left interest rates unchanged today.  In language newly added to its policy statement, “Uncertainty around the economic outlook has increased.”  Surveys of consumers and businesses, corporate earnings, and financial markets, albeit “soft data,” have suggested that the economic ground may be shifting beneath our feet.  Last Friday, the University of Michigan’s preliminary survey of consumer sentiment for March sank for the third straight month, showing sharply lower expectations for the future – regardless of respondents’ party affiliations.  Warnings have percolated from airlines and retailers, i.e. Dollar General and Walmart, about underwhelming consumer demand.  Outplacement firm Challenger Gray & Christmas announced layoffs reached their highest levels since the summer of 2020, when the pandemic was in full force — and the highest level for the month of February since 2009. That’s all for the FOMC for now.

Metals:

Gold prices edged higher to hover near all-time highs on the heels of Fed Chairman Jerome Powell’s post announcement press conference.

Daily Levels for March 20th, 2025

c5937400 3b21 4803 b673 3a6bad946ee4

Want to feature our updated trading levels on your website? Simply paste a small code, and they’ll update automatically every day!

Click here for quick and easy instructions.

822b33c5 2339 45ed bc84 e9c8f8c7358e

Economic Reports

provided by: ForexFactory.com

All times are Eastern Time (New York)

248517e1 e2e5 4c6e b14f 47c6daada34d

Find us on Trustpilot

stars

Trading Futures, Options on Futures, and retail off-exchange foreign currency transactions involves substantial risk of loss and is not suitable for all investors. You should carefully consider whether trading is suitable for you in light of your circumstances, knowledge, and financial resources. You may lose all or more of your initial investment. Opinions, market data, and recommendations are subject to change at any time.

Call Now

Join our Private Facebook group

Subscribe to our YouTube Channel

Listen to our podcast: Subscribe on AppleSpotify, Amazon

or wherever you listen to podcasts!

S
Facebook  Instagram  LinkedIn
S
ef3ab1c9 8d6d 4e60 a3f1 af5d9d4ecbb3
Services
Software
Tools
Community
Contact

Gold Surges to All-Time Record High of $3040 – 5 Key Signals, 7 Volatility Triggers Before the FOMC Decision

9dc1e02e d5f7 4ff4 abf7 1df60775f196

Movers & Shakers – GOLD

by John Thorpe, Senior Broker

gold nugg


Movers and Shakers:  FOMC Meeting Tomorrow @ 1:00PM CDT

    Market volatility is here to stay for the foreseeable future

Choose your opportunities wisely. Prepare for shocks on the tomorrow FOMC Rate decision but, more importantly, expect a roller coaster during the Chairman’s statement and Q and A 30 minutes to follow.

How gold is your portfolio? 

All time highs in Gold today. 3040.00 per troy ounce of Gold. We have all contract sizes, from 1 oz to 100 ounces of Gold.

Today was a subdued trading day for almost all of the high-volume products we trade compared to the past 30 days or so.

Waiting for FOMC rate decision?

GOLD

Here were today’s top headlines.

Updated: March 18, 2025 7:32 am

US Housing Starts and Building Permits Headline Recap

**US February Housing Starts: +11.2% to 1.501 mln units annualized rate; expected +1.0% to 1.38 mln

**US February Building Permits: -1.2% to 1.456 mln unit annualized rate; expected -2.2% to 1.45 mln

Updated: March 18, 2025 8:17 am

Federal Reserve US Industrial Production & Capacity Utilization Headline Recap

**Federal Reserve February US Industrial Production: +0.7%; expected +0.3%

**Federal Reserve February US Capacity Utilization: +0.5% to 78.2; expected 77.8%

**Federal Reserve January US Industrial Production revised: +0.3%; prior +0.5%

  • **Federal Reserve January US Capacity Utilization revised: 77.7%; prior 77.8%

Daily Levels for March 19th, 2025

5b0a901d f76a 41a5 aaa8 d6ac04d7bfc2

Want to feature our updated trading levels on your website? Simply paste a small code, and they’ll update automatically every day!

Click here for quick and easy instructions.

822b33c5 2339 45ed bc84 e9c8f8c7358e

Economic Reports

provided by: ForexFactory.com

All times are Eastern Time (New York)

7e6cb20a 22ad 4753 83f5 6733219577f9

Find us on Trustpilot

stars

Trading Futures, Options on Futures, and retail off-exchange foreign currency transactions involves substantial risk of loss and is not suitable for all investors. You should carefully consider whether trading is suitable for you in light of your circumstances, knowledge, and financial resources. You may lose all or more of your initial investment. Opinions, market data, and recommendations are subject to change at any time.

Call Now

Join our Private Facebook group

Subscribe to our YouTube Channel

Listen to our podcast: Subscribe on AppleSpotify, Amazon

or wherever you listen to podcasts!

S
Facebook  Instagram  LinkedIn
S
ef3ab1c9 8d6d 4e60 a3f1 af5d9d4ecbb3
Services
Software
Tools
Community
Contact

Gold Surges to Record $2,974: Powerful Trends & Market Shifts in This Month’s Report

9dc1e02e d5f7 4ff4 abf7 1df60775f196

Monthly Micro

Gold, Silver and Copper

Markets Report

gold 2

Highlights in this issue include:

  • Gold prices reach new high of $2,974/oz amid tariff fears and a weaker USD.
  • Silver prices down 2.4% MoM: weaker industrial demand concerns persist.
  • Copper prices gain 1.8% MoM, the third consecutive month of growth despite tariff uncertainty.
  • Micro Gold futures saw 21% MoM growth in February.

1-Ounce Gold futures see strong start: ADV reached 8,144 contracts in February.

READ FULL REPORT

274b1347 15da 400e 97fd 4a4a0a69de51

Daily Levels for March 18th, 2025

JUNE levels for stock index futures will be sent out tomorrow morning around the cash open!

92fe099a 55bf 4bed a8ac a313de0a7aad

Want to feature our updated trading levels on your website? Simply paste a small code, and they’ll update automatically every day!

Click here for quick and easy instructions.

822b33c5 2339 45ed bc84 e9c8f8c7358e

Economic Reports

provided by: ForexFactory.com

All times are Eastern Time (New York)

7493ff45 7526 4721 b0b6 cc4b121c51da

Find us on Trustpilot

stars

Trading Futures, Options on Futures, and retail off-exchange foreign currency transactions involves substantial risk of loss and is not suitable for all investors. You should carefully consider whether trading is suitable for you in light of your circumstances, knowledge, and financial resources. You may lose all or more of your initial investment. Opinions, market data, and recommendations are subject to change at any time.

Call Now

Join our Private Facebook group

Subscribe to our YouTube Channel

Listen to our podcast: Subscribe on AppleSpotify, Amazon

or wherever you listen to podcasts!

S
Facebook  Instagram  LinkedIn
S
ef3ab1c9 8d6d 4e60 a3f1 af5d9d4ecbb3
Services
Software
Tools
Community
Contact

Currency & Stock Index Futures: Avoid Costly Mistakes with these 3 Critical Deadlines

7cfe5b36 db9f 4933 824a 7f264613e7fe

Cannon Futures Weekly Letter

In Today’s Issue #1234

  • Rollover
  • The Week Ahead – FOMC, Housing
  • Futures 102 – Can you handle Drawdowns??
  • Hot Market of the Week – May KC/ Chi Wheat Spread
  • Broker’s Trading System of the Week – NQ intraday System
  • Trading Levels for Next Week
  • Trading Reports for Next Week

currency

Currencies Last Trading Day & Stock Index rollover

Time to start trading June Stock Index futures like MESM25 and MNQM25.

Symbol for June is M.

Monday, March 17th is Last Trading Day for all currency futures contracts, except the Canadian Dollar (Last Trading Day for the Canadian Dollar is Tuesday, March 18th). Currency futures contracts are DELIVERABLE CONTRACTS. You need to exit ALL LONG and SHORT open positions or be required to deliver or take delivery of the ACTUAL NOMINAL VALUE of the respective futures contract, i.e. $12,500 Euros, or $12,500,000 Japanese Yen. DO NOT put your account is this position. Exit all March ‘25 currency futures. Start trading currency futures with the June ’25 futures contracts.

Friday, March. 21st is Last Trading Day for March stock index futures contracts, i.e., the E-mini S&P, E-mini NASDAQ, E-mini Dow Jones and their Micro relatives. These futures contracts will halt trading at 8:30 A.M., Central Time and are cash settled, meaning any remaining open positions will be offset/settled using a to-be-determined settlement price. It is recommended that all new positions be placed in the June ‘25 futures contracts as of this Sunday night’s opening of trading. Volume in the March ‘25 contracts will begin to drop off until their expiration Friday, March. 21th.

Important Notices: The Week Ahead

By John Thorpe, Senior Broker

FOMC Week!

Indices traders roll to June, —M25

The Senate will vote today on a continuing resolution spending bill to keep the govt. open until Sept. 30. It must be on the Presidents desk by 11:59 pm EST to avoid a shut down, This may occur during market hours or after.

More volatility to come as next week all markets will be reacting to the potential for tariff implementations creating uncertainty in the marketplace. Therefore, increased volatility expectations.

Highlights next week will include Housing Data as well as the Wednesday Rate decision. Earnings reports continue to dwindle with 271 total reports while we are in the top of the 9th inning of earnings season, the reports will be impacting the indices much less than in past weeks Highlighted by many Chinese corp. reports. Finally, for Indices traders, contract rollover Monday. June will become the front month. M25. If you are on the new StoneX Platform, click on your current month tab at the top of your DOM or HOT to open the menu. Then slide down to Replace, now type in EPM25 if you are trading the Mini-S&P or ENQM25 for the Mini Nasdaq.

Earnings Next Week:

  • Mon. Quiet
  • Tue. Quiet
  • Wed. Tencent
  • Thu. Micron, Nike
  • Fri. Quiet

FED SPEECHES:

  • Mon.     Fed Blackout period
  • Tues.     Fed Blackout Period persists
  • Wed.     Fed Rate Decision 3/19/25 Chair Powell will Speak, 30 minutes after the rate decision.
  • Thu.      Last day of Fed Blackout period
  • Fri.       Williams 8:05 am CDT

Economic Data week:

  • Mon. Empire State Mfg., NAHB Housing Market Index
  • Tue. Bldg. Permits, Housing Starts, Redbook, Industrial Production
  • Wed. EIA Crude Stocks, FOMC I.R. Decision 1:00 pm followed by Fed Presser 1:30 pm CDT
  • Thur. Initial Jobless Claims, Philly Fed, Existing Home Sales, EIA Nat Gas
  • Fri Quiet

Futures 102: System Traders: Can you handle the drawdowns?

Many investors may think, “I can handle drawdown”, but honestly you have no idea how much drawdown you can handle until you have been stuck in the eye of a number of your own personal drawdown storms.

While drawdown is a natural part of trading and investing, what does differ is how much drawdown each investor can mentally handle. As humans, we all ‘see’ the world differently. What appears as something normal to one person can appear completely disastrous to another. While a 10% portfolio drawdown could be extreme for one investor, the next investor may be able to trade through periods of 50% plus drawdown.

From the behavioral finance point of view, some of the main negative facts of the human brain related to trading are:

  1. The fact that weak traders tend to be reluctant to realize losses and quick to realize gains. They are more risk averse when dealing with profitable positions and more risk seeking when dealing with losses.
  2. The fact that weak traders make inconsistent and irrational economic decisions over the same scenario depending on how it is described.
  3. The fact that weak traders deals with positions as if they were expecting mean reversion of prices. They are expecting the price to return to a long term average. This is the principle that makes them think they are buying expensive positions on volatility breakout or trend following strategies.

It is out of the scope of this article to talk much more about this science, but I will just point that:

  1. Weak traders know nothing about behavioral finance, so they think that his gut feeling is right and base their decisions on his gut feeling.
  2. Smart traders knows about behavioral finance. A smart trader has already studied about this and trained himself to overcome this limitations.  At least they know how to deal with their brain to avoid most of the damage it can create on their trading accounts. The best traders knows even how to monetize from this herd behavior.

Are drawdown periods a bad thing?


In my opinion, they are not a bad thing, in fact I believe that drawdown periods are a very sane and good thing for any solid strategy. Drawdown periods are very efficient to shake out weak traders from the strategy while smarter traders can pick up their money (which is the name of the game after all).

The time that passes since the first equity high until we reach a new equity high is the drawdown period.

So a drawdown period has two dimensions:

  • The drawdown depth
  • The drawdown length

Most people mostly care about the drawdown depth as this is what is easier to see on back tests. But human the brain is much more affected by drawdown length. During live trading, it is easier to deal with a 10% drawdown for one week than with a 5% drawdown for five months.

  • Detailed statistical information about the strategy: Expected profit, expected drawdown, maximal drawdown depth and length, average win percentage, reward to risk ratio, …
  • Different scenarios and the actions to take (if any): intense and/or deep drawdown periods and what to do (or do nothing), whether to trade during Christmas time or summer time, whether to keep opened positions during weekends or not, what to do after a losing year (or do nothing), funding and withdrawing plan, …
  • A very clear worst case scenario: it is basically the “line in the sand” where we know that the strategy has lost it’s edge and something must be done (stop trading the strategy, adapting parameters, …). There are many ways to calculate it (double the max historical drawdown, using montecarlo simulations, using regression lines multiplied by x times the standard deviation on the equity curve, …). In the end it is a number. The important thing is to have it written in the trading plan.

When facing a problem that generates pain or panic such as a sudden deep drawdown, most of the time, when analyzed with rigor and care, the problem is not so important, and everything is within expected statistics. You will see that there were many periods in the past with similar characteristics.

Hot Market of the Week

Hot market of the week is provided by QT Market Center, A Swiss army knife charting package that’s not just for Hedgers, Cooperatives and Farmers alike but also for Spread traders, Swing traders and shorter time frame application for intraday traders with a unique proprietary indicator that can be applied to your specific trading needs.

Free Trial Available

May KC – Chicago Wheat Spread

The KC-Chicago wheat spread has resumed its rally into a new high. If the chart can sustain further strength, the second upside PriceCount projects a possible run to the 32-cent area.

04f865a9 1c11 4576 b13a 867dcc05b204

The PriceCount study is a tool that can help to project the distance of a move in price. The counts are not intended to be an ‘exact’ science but rather offer a target area for the four objectives which are based off the first leg of a move with each subsequent count having a smaller percentage of being achieved. It is normal for the chart to react by correcting or consolidating at an objective and then either resuming its move or reversing trend. Best utilized in conjunction with other technical tools, PriceCounts offer one more way to analyze charts and help to manage your positions and risk. Learn more at www.qtchartoftheday.com

Trading in futures, options, securities, derivatives or OTC products entails significant risks which must be understood prior to trading and may not be appropriate for all investors. Past performance of actual trades or strategies is not necessarily indicative of future results.

Brokers Trading System of the Week

With algorithmic trading systems becoming more prevalent in portfolio diversification, the following system has been selected as the broker’s choice for this month.

Intra Nasdaq

PRODUCT

Mini NASDAQ

SYSTEM TYPE

Day Trading

Recommended Cannon Trading Starting Capital

$20,000

COST

USD 85 / monthly

Get Started

Learn More

98f6920d d939 4f0b a401 19b6cebb6155

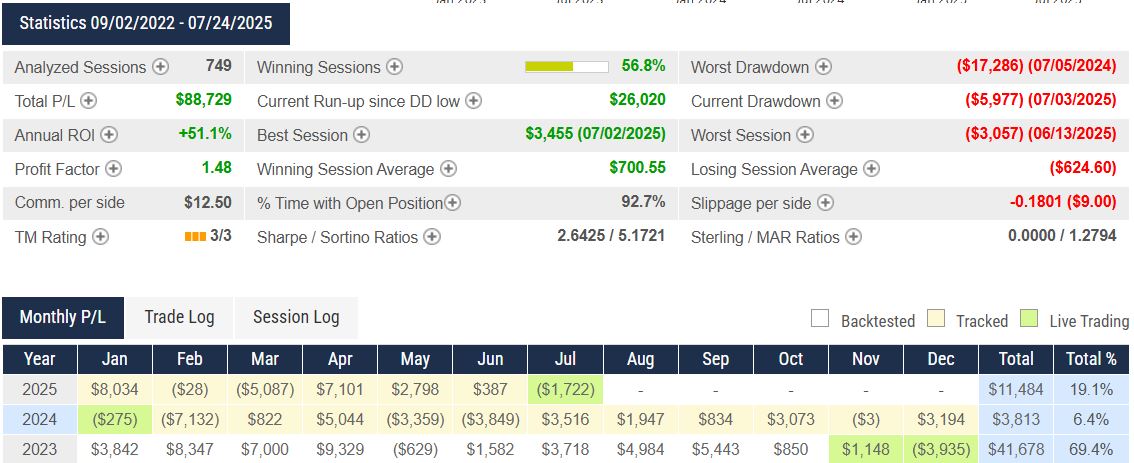
The performance shown above is hypothetical in that the chart represents returns in a model account. The model account rises or falls by the average single contract profit and loss achieved by clients trading actual money pursuant to the listed system’s trading signals on the appropriate dates (client fills), or if no actual client profit or loss available – by the hypothetical single contract profit and loss of trades generated by the system’s trading signals on that day in real time (real‐time) less slippage, or if no real time profit or loss available – by the hypothetical single contract profit and loss of trades generated by running the system logic backwards on back adjusted data. Please read full disclaimer HERE.

Would you like to get weekly updates on real-time, results of systems mentioned above?
Yes
No

Trading Levels for Next Week

Daily Levels for March 17th, 2025

68e10b2b d361 4459 99e9 c157f620ce96

Would you like to receive daily support & resistance levels?
Yes
No

Trading Reports for Next Week

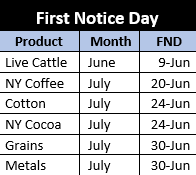
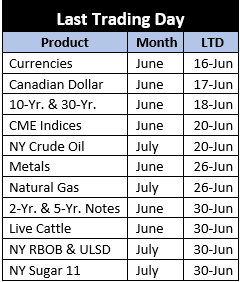
First Notice (FN), Last trading (LT) Days for the Week:

www.mrci.com 

b74635bd 884f 41ea b758 e4a8b904d3f3

Find us on Trustpilot

stars

Trading Futures, Options on Futures, and retail off-exchange foreign currency transactions involves substantial risk of loss and is not suitable for all investors. You should carefully consider whether trading is suitable for you in light of your circumstances, knowledge, and financial resources. You may lose all or more of your initial investment. Opinions, market data, and recommendations are subject to change at any time.

Call Now

Join our Private Facebook group

Subscribe to our YouTube Channel

Listen to our podcast: Subscribe on AppleSpotify, Amazon

or wherever you listen to podcasts!

S
Facebook  Instagram  LinkedIn
S
ef3ab1c9 8d6d 4e60 a3f1 af5d9d4ecbb3
Services
Software
Tools
Community
Contact

Volatility Warning: 3 Crucial Adjustments to Avoid Devastating Losses in High Volatility!

9dc1e02e d5f7 4ff4 abf7 1df60775f196

Volatility Expands

volatility 2

Volatility is high!!

Volatility alert: The “bands” are expanding, consider reducing trading size? Possibly trading MICROS?

Evaluating your stops and targets to make sure they adjust to volatility?

Daily Levels for March 14th, 2025

a2976065 b56b 4444 b745 f2da20f3b7f8

Want to feature our updated trading levels on your website? Simply paste a small code, and they’ll update automatically every day!

 Click here for quick and easy instructions.

822b33c5 2339 45ed bc84 e9c8f8c7358e

Economic Reports

provided by: ForexFactory.com

All times are Eastern Time (New York)

1d8ea8d0 dea7 449c 81f2 9ee6b25ac0a2

Find us on Trustpilot

stars

Trading Futures, Options on Futures, and retail off-exchange foreign currency transactions involves substantial risk of loss and is not suitable for all investors. You should carefully consider whether trading is suitable for you in light of your circumstances, knowledge, and financial resources. You may lose all or more of your initial investment. Opinions, market data, and recommendations are subject to change at any time.

Call Now

Join our Private Facebook group

Subscribe to our YouTube Channel

Listen to our podcast: Subscribe on AppleSpotify, Amazon

or wherever you listen to podcasts!

S
Facebook  Instagram  LinkedIn
S
ef3ab1c9 8d6d 4e60 a3f1 af5d9d4ecbb3
Services
Software
Tools
Community
Contact

Copper Prices Surge $6,500 per Contract After Trump’s 25% Tariff Bombshell!

9dc1e02e d5f7 4ff4 abf7 1df60775f196

Markets Highlights on Copper

Copper

by Mark O’Brien, Senior Broker

General:

The big one! It’s that time of the month again: we’re a couple of days from when the Labor Dept. releases its monthly Non-farm payrolls report. It’s widely considered to be one of the most important and influential measures of the U.S. economy and the report is released at 7:30 A.M., Central Time on the first Friday of the month.

Ahead of that, today the ADP National Employment Report showed payrolls increased by 77,000 jobs in February, the smallest gain since July 2024, after rising 186,000 in January. Economists had forecast private employment advancing 140,000.

The ADP report, jointly developed with the Stanford Digital Economy Lab, likely exaggerates the labor market slowdown and has no correlation with the government’s employment report.

 Softs:

Arabica coffee futures rose sharply today with the market heading back up towards recent record highs. May ICE coffee rose almost 5% to $4.1855 per lb. intraday. Traders indicated the market showing signs of resuming its upward trend after suffering a sharp setback which took prices from a record high of $4.2995 on Feb. 11 to a low of $3.6630 a week ago – a ±$23,900 per contract correction! The market was keeping a close watch on the weather in top grower Brazil with hot, dry conditions raising some concerns about the upcoming crop.

Energy:

Crude oil futures settled down for the fourth consecutive session today after U.S. crude oil stockpiles posted a larger-than-expected build, adding a further headwind as investors worried about OPEC+ plans to increase output in April and U.S. tariffs on Canada, China and Mexico. April West Texas Intermediate crude (WTI) settled down $1.95, or 2.86%, to $66.31 a barrel, its lowest since November ’24. OPEC+, the Organization of the Petroleum Exporting Countries and allies including Russia, decided on Monday to proceed with a planned April oil output increase of 138,000 barrels per day, its first since 2022.

Metals:

Copper

CME/COMEX copper futures soared today following President Donald Trump’s announced 25% tariffs on copper imports during his Tuesday night speech to Congress. May copper rose ±26 cents/lb. (±5.7% as of this blog post – a $6,500 per contract move – to a $4.825/lb. intraday high.

S

April Crude Oil

April crude oil is completing its second downside PriceCount objective to the 66.53 area. It would be normal to get a near term reaction from this level in the form of a consolidation or corrective trade. At this point, IF the chart can sustain further weakness, the third count would project a possible slide to a new contract low around 62.78. A trade below the October reactionary low would formally negate the remaining unmet upside objectives.

0e99bbc0 9525 4d6a b618 92dc6ff487b8

Daily Levels for March 6th, 2025

d5322ea5 19d1 4167 952f 10a901eda3f5

Want to feature our updated trading levels on your website? Simply paste a small code, and they’ll update automatically every day! Click here for quick and easy instructions.

822b33c5 2339 45ed bc84 e9c8f8c7358e

Economic Reports

provided by: ForexFactory.com

All times are Eastern Time (New York)

da172104 6c0a 4cfc 9a2d 0eb288e8412e

Find us on Trustpilot

stars

Trading Futures, Options on Futures, and retail off-exchange foreign currency transactions involves substantial risk of loss and is not suitable for all investors. You should carefully consider whether trading is suitable for you in light of your circumstances, knowledge, and financial resources. You may lose all or more of your initial investment. Opinions, market data, and recommendations are subject to change at any time.

Call Now

Join our Private Facebook group

Subscribe to our YouTube Channel

Listen to our podcast: Subscribe on AppleSpotify, Amazon

or wherever you listen to podcasts!

S
Facebook  Instagram  LinkedIn
S
ef3ab1c9 8d6d 4e60 a3f1 af5d9d4ecbb3
Services
Software
Tools
Community
Contact

Nasdaq, S&P 500 Ride the Volatility Lightning! Market Insights & Economic Highlights

9dc1e02e d5f7 4ff4 abf7 1df60775f196

nasdaq

Movers & Shakers by John Thorpe, Senior Broker

Nasdaq

Movers and Shakers: Volatile Day Ahead, Full of Reports

President Trump addressing joint session of congress this evening @ 9 PM Eastern, 6 PM Pacific

Market volatility is here to stay for the foreseeable future, with the Nasdaq and S&P 500 sliding downward at a serious clip.

Choose your opportunities wisely. Don’t miss out on the market news highlights of the day recap below!

Nasdaq, S&P 500

The S&P 500 experienced an 114-point slide ($5700 per contract) The market has continued to recover from the initial losses and look to close in – 50-point range near 5820.00 basis the March contract. The Nasdaq, after taking a drubbing down over 400 points earlier in the session, was running as positive as up 200. As, the Nasdaq is virtually unchanged now as of this typing while the DOW looks to subtract over .1% into the 43000 area.

Tariff concerns creating a lack of confidence in the US Dollar as a safe-haven currency has pushed thru support at 106.00 looking to close in the 105.70 area for the first time since December 10th. The Grain markets should have been lower by much more than they were, Soybeans down 14 cents, Wheat down 11 and Corn down 4 /12 cents, if the dollar were stronger today, our old crop supply is getting cheaper by the day.

Crude oil, after experiencing a $1.70 range will be closing near unchanged around the 68.40 area basis the April contract just .70 lower than one week ago.

Econ Data: ADP, S&P Global Svcs. PMI, Factory orders, ISM Svcs. PMI, EIA Crude Inventories, Beige Book

FED Speak: Quiet

Earnings: Quiet

S

May Soybeans

May soybeans activated downside PriceCount objectives off the February recovery peak and accelerated to the second objective. It would be normal to get a near term reacion from this level in the form of a consolidation or corrective trade. IF the chart can sustain further weakness, the third count would project a slide to the 9.73 area. The trade below the January reactionary low formally negated the remaining unmet upside objectives.

bf1f7fa2 0792 479d 86f5 e53ff4b5192b

Daily Levels for March 5th, 2025

d4035983 1e77 492c 9724 19e2cad5abf0

Want to feature our updated trading levels on your website? Simply paste a small code, and they’ll update automatically every day! Click here for quick and easy instructions.

822b33c5 2339 45ed bc84 e9c8f8c7358e


Economic Reports

provided by: ForexFactory.com

All times are Eastern Time (New York)

d8583071 3be8 4f4d 99ba eaf6652c2c34

Find us on Trustpilot

stars

Trading Futures, Options on Futures, and retail off-exchange foreign currency transactions involves substantial risk of loss and is not suitable for all investors. You should carefully consider whether trading is suitable for you in light of your circumstances, knowledge, and financial resources. You may lose all or more of your initial investment. Opinions, market data, and recommendations are subject to change at any time.

Call Now

Join our Private Facebook group

Subscribe to our YouTube Channel

Listen to our podcast: Subscribe on AppleSpotify, Amazon

or wherever you listen to podcasts!

S
Facebook  Instagram  LinkedIn
S
ef3ab1c9 8d6d 4e60 a3f1 af5d9d4ecbb3
Services
Software
Tools
Community
Contact

Gold Drops to $40, Silver Freefalls as Looming Recession Fears Weigh Heavy on Markets

9dc1e02e d5f7 4ff4 abf7 1df60775f196

Movers & Shakers: Gold, Silver, Recession Fears

gold silver

by John Thorpe, Senior Broker

Movers and Shakers: QUIET Econ data and fed speak tomorrow

Market volatility is here to stay for the foreseeable future

Choose your opportunities wisely.

The S&P experienced an 85 point slide ($4250.00 per contract) 65 points immediately following the negative consumer confidence number release that declined by 7 points. The market has continued to recover from the initial loses and look to close in the _0 to 20 point range near 5990.00 basis the March contract. The NQ also took a drubbing, down 225 points as of this writing after being down over 400 points earlier in the session while the DOW looks to add 150 + points today.

Gold, Silver, Recession Fears

Gold, Silver: Recessionary concerns as a result of the building lack of confidence also impacted the Gold and Silver markets , with gold taking a $40.00 per ounce whack and Silver taking a .68 drubbing per troy ounce basis the May contract.

Not to be left out, the US 30 yr Bond, ( ZBM25) was up ( lower interest rates) 42 32nds basis the June contract.

Crude oil will be closing under $70.00 bbl for the first time since the day after Christmas at what looks to be 69.10 basis the April contract.
Updated: February 25, 2025 7:28 am

Dallas Fed President put forth the idea of using a modest portion of the Federal Reserve’s balance sheet to holding daily auctions of discount window loans, arguing that it will improve efficiency and effectiveness in implementing policy, and encourage banks needing liquidity to borrow at the Fed. The US Fed discount window lend to banks in need of cash, exchanging for less liquid collateral held by banks.

Updated: February 25, 2025 7:55 am

Redbook Weekly US Retail Sales Headline Recap

**Redbook Weekly US Retail Sales were +5.9% in the first three weeks of February 2025 vs February 2024

**Redbook Weekly US Retail Sales were +6.2% in the week ending February 22 vs yr ago week

Updated: February 25, 2025 8:01 am

Case Schiller 20 US Metro-Area Home Prices Recap

**Case Schiller 20 US metro area home prices for December Y/Y: +4.4% from the year ago month

**Case Schiller 20 US metro area home prices for December M/M: -0.1% vs prior month

Updated: February 25, 2025 9:02 am

Richmond Fed Manufacturing Index Headline Recap

S
 **Richmond Fed February Manufacturing Index: +6.0 ; prior -4.0; expected -2.0

**Richmond Fed February Manufacturing Shipments Index:+12.0 ; prior -9.0

**Richmond Fed February Manufacturing New Orders: 0.0 ; prior -4.0

**Richmond Fed February Manufacturing Employees: +9.0 ; prior +3.0

**Richmond Fed February Manufacturing Prices Paid: +2.23 ; prior +2.37

**Richmond Fed February Manufacturing Prices Received: +1.62 ; prior +1.21

**Richmond Fed February Service Sector Index: +11.0 ; prior +4.0

Updated: February 25, 2025 9:06 am

The Conference Board Consumer Confidence Index® declined by 7.0 points in February to 98.3 (1985=100).

Tomorrow:

  • Rich. Fed, Bldg Permits, New Home sales.,
  • NVIDIA Earnings after the close!
  • Fed Barkin 7:30 am CST, Fed Bostic 11:00 am CST .
  • Crude Oil Inventories
  • G20 all day

Daily Levels for February 26th, 2025

0d987f02 a52a 4c2e 8c01 c85a3239d6c0

Want to feature our updated trading levels on your website? Simply paste a small code, and they’ll update automatically every day! Click here for quick and easy instructions.

Economic Reports

provided by: ForexFactory.com

All times are Eastern Time ( New York)

c46b8554 0c98 4acb a129 cae957d6d528

Find us on Trustpilot

stars

Trading Futures, Options on Futures, and retail off-exchange foreign currency transactions involves substantial risk of loss and is not suitable for all investors. You should carefully consider whether trading is suitable for you in light of your circumstances, knowledge, and financial resources. You may lose all or more of your initial investment. Opinions, market data, and recommendations are subject to change at any time.

Call Now

Join our Private Facebook group

Subscribe to our YouTube Channel

Listen to our podcast: Subscribe on AppleSpotify, Amazon

or wherever you listen to podcasts!

S
Facebook  Instagram  LinkedIn
S
ef3ab1c9 8d6d 4e60 a3f1 af5d9d4ecbb3
Services
Software
Tools
Community
Contact

Natural Gas & Copper Eye Upside Amid Post-Holiday Market Turbulence; Softs & Metals Lead the Charge

9dc1e02e d5f7 4ff4 abf7 1df60775f196

Busy Friday to Finish a Short Trading Week

By Ilan Levy-Mayer, VP

natural gas 2

It has been a volatile short trading week post President’s Day long weekend.

Wild swings across the board with softs and metals leading the way.

Tomorrow we have new home sales, flash PMI and University of Michigan reports which will be watched closely for the inflation outlook.

Watch both natural gas and copper as these markets are establishing a tend to the upside.

Would you like to get real

time news and markets outlook via videos updates daily?

Simply visit us on our market research section. FREE to clients and prospects!

Daily Updates & Market Research

28d4a612 cce6 4d0b 8195 8adf5accd68a

Daily Levels for February 21st, 2025

2b434bf6 29a6 4c5c 9912 a53187f90c38

Want to feature our updated trading levels on your website? Simply paste a small code, and they’ll update automatically every day! Click here for quick and easy instructions.

822b33c5 2339 45ed bc84 e9c8f8c7358e

Economic Reports

provided by: ForexFactory.com

All times are Eastern Time (New York)

8ebeb12c a31f 402f 8d6c 4d864d24c3ed

Find us on Trustpilot

stars

Trading Futures, Options on Futures, and retail off-exchange foreign currency transactions involves substantial risk of loss and is not suitable for all investors. You should carefully consider whether trading is suitable for you in light of your circumstances, knowledge, and financial resources. You may lose all or more of your initial investment. Opinions, market data, and recommendations are subject to change at any time.

Call Now

Join our Private Facebook group

Subscribe to our YouTube Channel

Listen to our podcast: Subscribe on AppleSpotify, Amazon

or wherever you listen to podcasts!

S
Facebook  Instagram  LinkedIn
S
ef3ab1c9 8d6d 4e60 a3f1 af5d9d4ecbb3
Services
Software
Tools
Community
Contact