Futures Trader

A futures trader is a professional who buys and sells futures contracts on commodities, financial instruments, and other assets in order to profit from fluctuations in their price. Engaging in futures trading involves significant risk and complexity, but when done right, it can yield considerable rewards. However, to maintain a long-term career in futures trading, a trader must adhere to a set of core principles that promote sustainable growth and risk management. Key principles for longevity in this field include emotional control, adherence to trading plans, disciplined risk management, and an understanding of how to balance opportunity with caution. Futures trading is a demanding profession, and those who approach it without a structured approach often find themselves struggling to maintain consistency.

Emotional Control: The Backbone of Successful Futures Trading

One of the most critical principles for any futures trader is emotional control. The fast-paced nature of trading futures, coupled with the significant leverage available, can make it easy to fall into the traps of fear and greed. Emotional control allows traders to respond to market movements calmly rather than react impulsively, which is essential in avoiding irrational decisions that can lead to losses.

For instance, a futures trader may be tempted to double down on a losing position out of frustration or stubbornness, hoping to recoup losses. However, experienced traders know that emotional decisions are rarely profitable in the long term. Instead, successful futures traders have the discipline to cut losses when needed and avoid revenge trading — the tendency to try and “win back” losses through risky moves. Achieving emotional control is often about creating a mindset that recognizes that losses are a natural part of trading in futures and can be managed with a clear strategy.

While emotional control is vital, it can also conflict with the excitement of seizing opportunities. The futures market often presents fast-moving opportunities, and a futures trader may feel an impulse to “catch the wave” of a sudden price move. However, seasoned traders understand that making emotionally driven decisions rarely yields consistent profits. They approach each opportunity with a clear mind and refrain from overtrading, no matter how tempting it may feel in the moment.

The Role of a Trading Plan: Consistency and Structure

A trading plan is a carefully crafted roadmap that outlines a trader’s strategy, including entry and exit points, stop-loss levels, position sizes, and risk tolerance. For a futures trader, adhering to a trading plan is crucial for maintaining consistency in an environment known for its volatility. A trading plan helps remove the emotional component from decision-making, as it provides clear guidelines on how to react under different market conditions.

One of the most significant challenges that futures traders face is resisting the urge to deviate from their trading plans in pursuit of short-term gains. Trading in futures can sometimes feel unpredictable, and an unexpected market shift may lead traders to stray from their plan to try to capitalize on a sudden price movement. While the allure of quick profits can be strong, a successful futures trader recognizes the importance of sticking to the plan and avoiding impulsive trades that do not align with their long-term objectives.

For example, let’s say a futures trader sees an unexpected market rally that they did not anticipate in their plan. Jumping in impulsively could expose them to excessive risk and result in a significant loss if the market reverses. Instead, a disciplined futures trader will assess the situation and determine if the opportunity aligns with their trading criteria. If not, they will patiently wait for a setup that fits their plan. This adherence to a structured approach not only minimizes unnecessary risks but also helps in building a consistent track record over time.

Risk Management: Avoiding Overleveraging in Futures Trading

Risk management is arguably one of the most important principles for anyone involved in futures trading. Unlike other forms of trading, futures contracts are highly leveraged, allowing a futures trader to control large positions with a relatively small amount of capital. While this leverage can magnify profits, it also significantly increases the potential for losses. Proper risk management involves understanding the potential downside of each trade and implementing safeguards to protect capital.

One of the main ways to manage risk is by avoiding overleveraging. Overleveraging occurs when a trader takes on too large a position relative to their account size, which can lead to substantial losses if the market moves unfavorably. Many futures traders are tempted to overleverage in an attempt to maximize profits, but this approach often leads to a quick depletion of their capital. Instead, experienced traders limit their leverage to a level that allows them to weather market volatility without risking catastrophic losses.

Resisting overleveraging is critical, but it sometimes conflicts with a trader’s desire to take advantage of an attractive opportunity. For instance, if a futures trader identifies what they perceive as a high-probability trade, they may feel compelled to increase their leverage to maximize their gains. However, seasoned traders understand that any single trade carries risk, and overextending oneself on one trade can lead to financial trouble. The most successful futures traders balance their enthusiasm for opportunity with a disciplined approach to leverage, ensuring that they have enough capital to remain in the market for the long haul.

Choosing the Right Broker: The Value of Support and Expertise

While discipline and skill are essential, selecting a reliable futures broker is also a crucial decision for any futures trader. The right broker provides a foundation of support, from trade execution to customer service and technical troubleshooting. Cannon Trading Company, for instance, is known for its decades of experience in the futures markets, and with a 5 out of 5-star rating on TrustPilot, it has established a reputation for reliability and client satisfaction.

Working with a broker like Cannon Trading offers multiple advantages for futures traders trading futures. First, their extensive experience in the futures markets means they understand the nuances and challenges traders face daily. This insight allows them to provide valuable guidance and support, which can be especially beneficial for newer traders who are still learning the complexities of trading futures. Additionally, their high customer service ratings indicate a strong commitment to assisting clients promptly, which can be essential in the fast-paced world of futures trading where platform issues or trade execution delays can have financial consequences.

Cannon Trading’s dedication to customer service and troubleshooting helps traders focus on their strategies without the added stress of technical issues. In futures trading, having a broker who can resolve issues efficiently and provide ongoing support can be the difference between a successful trade and a missed opportunity. Cannon Trading’s ratings reflect their reliability in providing broker assistance, which is invaluable for futures traders who rely on quick access to information and a seamless trading experience.

Continuous Learning and Adaptability in Futures Trading

The futures markets are constantly evolving, with new technologies, strategies, and market conditions emerging regularly. For a futures trader to succeed over the long term, a commitment to continuous learning is essential. This could involve studying market trends, understanding new regulations, or refining trading strategies based on past experiences. A willingness to adapt and evolve as a trader ensures that one remains competitive and avoids becoming complacent.

Additionally, the support of a knowledgeable broker like Cannon Trading Company can aid in this learning process. With their years of experience, they can offer educational resources, insights, and market analysis that are beneficial to traders at all skill levels. Leveraging the resources provided by an experienced broker can help traders stay informed and make more educated decisions.

Balancing Discipline and Opportunity in Futures Trading

The life of a futures trader is a delicate balance between seizing opportunities and maintaining discipline. The desire to capitalize on favorable market conditions is natural, but without the guiding principles of emotional control, adherence to a trading plan, and disciplined risk management, traders may fall into habits that undermine their long-term success. Resisting the temptation to overleverage and choosing a trustworthy broker like Cannon Trading Company can further support a sustainable approach.

Futures trading is not a career suited to impulsive decision-making or excessive risk-taking. Traders who respect the markets, remain vigilant, and continuously refine their strategies have the best chances of success. The journey of a futures trader is marked by patience, adaptability, and a focus on consistent, incremental gains rather than high-stakes risks. By adhering to these core principles and leveraging the support of an experienced broker, traders can pursue a rewarding and sustainable career in the dynamic world of futures trading.

For more information, click here.

Ready to start trading futures? Call us at 1(800)454-9572 – Int’l (310)859-9572 (International), or email info@cannontrading.com to speak with one of our experienced, Series-3 licensed futures brokers and begin your futures trading journey with Cannon Trading Company today.

Disclaimer: Trading Futures, Options on Futures, and retail off-exchange foreign currency transactions involve substantial risk of loss and are not suitable for all investors. Past performance is not indicative of future results. Carefully consider if trading is suitable for you in light of your circumstances, knowledge, and financial resources. You may lose all or more of your initial investment. Opinions, market data, and recommendations are subject to change at any time.

Important: Trading commodity futures and options involves a substantial risk of loss. The recommendations contained in this article are opinions only and do not guarantee any profits. This article is for educational purposes. Past performances are not necessarily indicative of future results.

This article has been generated with the help of AI Technology and modified for accuracy and compliance.

Follow us on all socials: @cannontrading

All Eyes on NFP: U.S. Growth and Gold Rally Amid Key Jobs Data Release This Friday

Join our Private Facebook group

Subscribe to our YouTube Channel

Listen to our podcast: Subscribe on AppleSpotify, Amazon, or wherever you listen to podcasts!

Gold T


All Roads lead to NFP This Friday

By Mark O’Brien, Senior Broker

General:  


The U.S. economy continued its recent strong stretch of growth this summer, bolstered by strong consumer and government spending.  The Commerce Department reported this morning that the nation’s Gross domestic product increased at a 2.8% annual rate in the third quarter, adjusted for seasonality and inflation.

Despite the report showing a slight slowdown from the second quarter’s 3% rate, and coming in below economists’ expectations for a 3.1% pace, and even in the face of the historically high borrowing costs that carried into the period, the July-to-September quarter marked a continuation of a roughly two-year streak of strong growth for the U.S. economy.


Indeed, the economy has outperformed expectations over the past couple of years.  A much-anticipated recession has yet to materialize, even though the Federal Reserve raised interest rates aggressively to curb inflation in recent years. Wednesday’s report points to an economy that is still humming, with strong consumer spending supported by a robust labor market, and business investment that remains solid.


Metals:  


We’re blogging like a broken record when it comes to covering gold futures.  The price of the front month December contract touched another all-time record high last night, trading briefly over $2,800 per ounce and it’s looking like it’ll post a close above there based on its old 10:30 A.M., Central Time pit session close today.


Much of the credit for the increased demand can be tied to simmering tensions in the Middle East and the uncertainty over the upcoming presidential election in the U.S., now just six days away.


Kudos to analysts at Citi who raised their three-month forecast for gold prices to $2,800 per ounce earlier this month.  They’re still looking for a move to $3,000 over the next 6–12 months.


Soy Complex: 


January soybeans, which is now the most actively traded contract, closed at $9.79 per bushel on Monday.  That put prices within striking distance of that futures contract’s intraday life-of-contract low at 973½ posted on August 14th.


Heads up: 


It’s that time of the month again: we’re a couple of days from when the Labor Dept. releases its monthly Non-farm payrolls report.  It’s widely considered to be one of the most important and influential measures of the U.S. economy and the report is released at 7:30 A.M., Central Time on the first Friday of the month.


To review, the Labor Dept.’s Bureau of Labor Statistics surveys about 141,000 businesses and government agencies, representing approximately 486,000 individual work sites.  The report excludes farm workers, private household employees, domestic household workers and non-profit organization employees.  The report also includes other detailed industry data including the overall unemployment rate as a percentage of the total labor force that is unemployed but actively seeking work, wages, wage growth and average workday hours.


stars

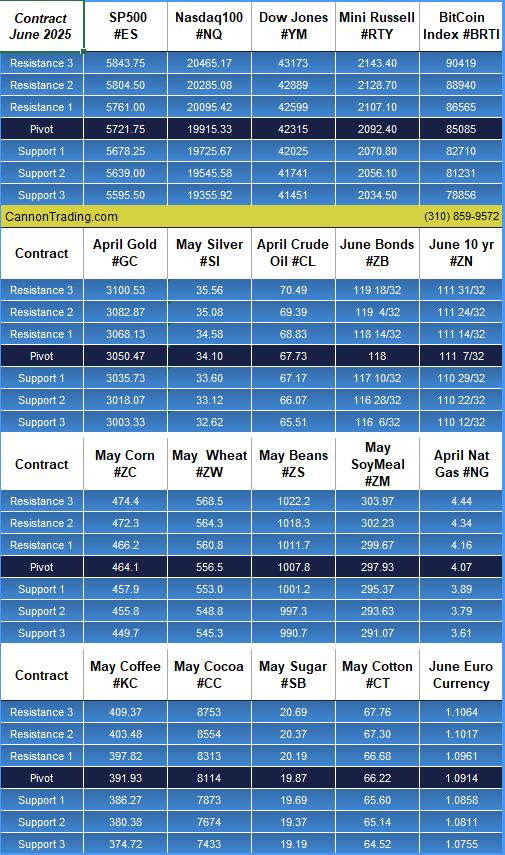
Daily Levels for Oct. 31st 2024

7f12c620 72d2 49b1 a8b2 efa992ba54ab

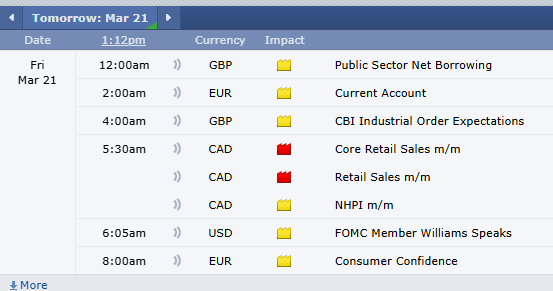
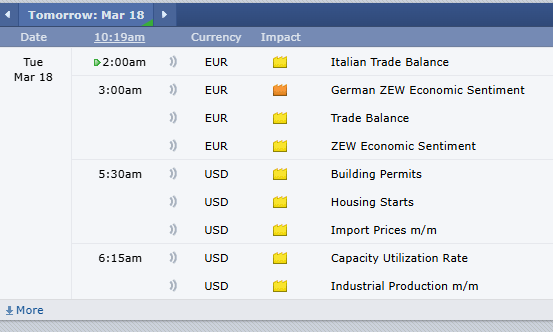
Economic Reports
provided by:ForexFactory.com
All times are Eastern Time ( New York)
dbe9044b 5358 4f67 b34c f37a07ab4342
Good Trading!
About: Cannon Trading is an independent futures brokerage firm established in 1988 in Los Angeles. Our mission is to provide reliable service along with the latest technological advances and choices while keeping our clients informed and educated in the field of futures and commodities trading.
Trading Futures, Options on Futures, and retail off-exchange foreign currency transactions involves substantial risk of loss and is not suitable for all investors. You should carefully consider whether trading is suitable for you in light of your circumstances, knowledge, and financial resources. You may lose all or more of your initial investment. Opinions, market data, and recommendations are subject to change at any time.
Contact
S
Cannon Trading Company
12100 Wilshire Boulevard
Suite 1640
Los Angeles, CA 90025
(800) 454-9572
Follow Us
Facebook  Twitter  Instagram
Visit Our Website


Metals Retreat, Stocks Drop 1.6%: Market Slump Amid Rate Speculation – Gold Hits Record High Before Pullback

Join our Private Facebook group

Subscribe to our YouTube Channel

Listen to our podcast: Subscribe on AppleSpotify, Amazon, or wherever you listen to podcasts!

Gold T

Metals Off Highs, Stocks Fall 1.6%

By Mark O’Brien, Senior Broker

General / Indexes:


Stock index futures slumped today with the Dec. E-mini Dow Jones futures contract losing over 650 points (a ±$3,250 per contract move) at its intraday low around 1:00 Central Time.  The E-mini S&P 500 shed over 90 points (a ±$4,500 per contract move) at its lows and the E-mini Nasdaq lost over 450 points (a $9,000 move) intraday.  The latter erased two weeks of higher closing prices.

The rally in stocks has stalled as investors debate how quickly the Federal Reserve will cut interest rates over the next year and sowed worry of rates staying higher for longer.


Metals:


Gold futures are getting shinier by the day.  The price of the front month December contract touched another all-time record high overnight, trading briefly at $2,772.60 per ounce before heading on a ±$50 pull-back into its old 10:30 A.M., Central Time pit session close this morning.


Since the start of this year, gold prices have risen by a third, hovering over the $2,700 per ounce mark in the last few trading sessions.  Much of the credit for the increased demand can be tied to simmering tensions in the Middle East and the uncertainty over the upcoming presidential elections in the U.S.


The 2024 gains have unfolded after uninspiring price movement over the last ten years.  The price of gold reached the vicinity of $1,900 per ounce in 2011, swooned for nearly eight years trading not far from $1,000 per ounce much of the time, then started advancing back to ±$1,900 around mid-2020 where it vacillated little into 2022.  After being subdued for so long, gold prices shot up, delivering a 70% jump in the past two years.  Looking at the institutional interest in gold several large commercial banks have forecast the current upward price move continuing into next year.

Analysts at Citi raised their three-month forecast for gold prices to $2,800 per ounce.  They look for a move to $3,000 over the next 6–12 months.  J.P. Morgan has also proposed that gold’s fundamentals point to further upside.


stars

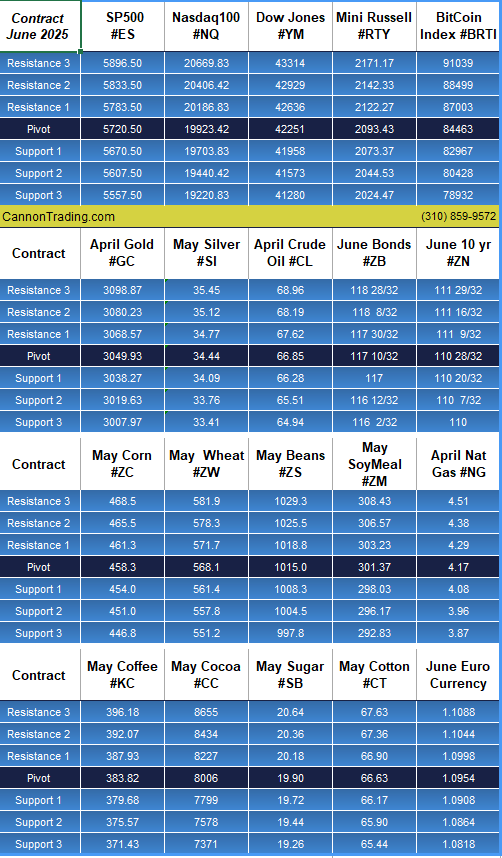
Daily Levels for Oct. 24th 2024

614e103a 360c 4fe9 802f a8f36668fe33

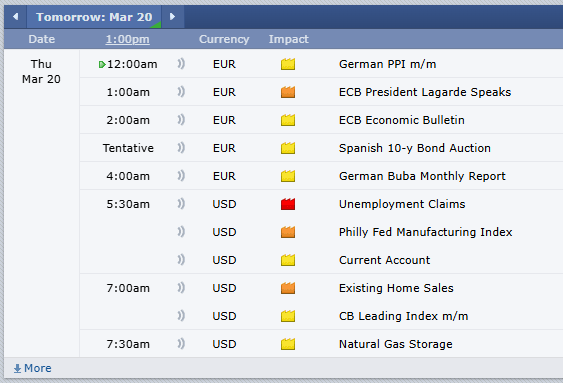
Economic Reports
provided by:ForexFactory.com
All times are Eastern Time ( New York)
255af178 0d49 493d ba71 2493a555370c
Good Trading!
About: Cannon Trading is an independent futures brokerage firm established in 1988 in Los Angeles. Our mission is to provide reliable service along with the latest technological advances and choices while keeping our clients informed and educated in the field of futures and commodities trading.
Trading Futures, Options on Futures, and retail off-exchange foreign currency transactions involves substantial risk of loss and is not suitable for all investors. You should carefully consider whether trading is suitable for you in light of your circumstances, knowledge, and financial resources. You may lose all or more of your initial investment. Opinions, market data, and recommendations are subject to change at any time.
Contact
S
Cannon Trading Company
12100 Wilshire Boulevard
Suite 1640
Los Angeles, CA 90025
(800) 454-9572
Follow Us
Facebook  Twitter  Instagram
Visit Our Website


Gold Futures Hit All-Time Highs: Margin Updates and Chart Review

Join our Private Facebook group

Subscribe to our YouTube Channel

Listen to our podcast: Subscribe on AppleSpotify, Amazon, or wherever you listen to podcasts!

Gold Futures

All time highs on gold futures today!

See both daily and weekly charts below.

On a different note, as the CME raises margins, the day trading margins may be higher as well.

Depending on the trading platform you are using, your day trading margins may be a percent of the overnight margins. If you are using the E-Futures International, then your day trading margins between 7:45 AM central and 3:30 PM central are as below:

0e7bab50 b9f3 4646 8319 513832198a9e
Any questions, please reach out to your broker.

Gold Daily and Weekly Charts below for review:

cd76fe04 1943 431a b57b c6064909cdb0
1de04609 46a5 4566 8910 c4a18f4ddeb9
Any questions, please reach out to your broker.


stars
 

Daily Levels for Oct. 18th 2024

2a7873ec b985 4c8f a624 5891ad69c4ec

Economic Reports
provided by:ForexFactory.com
All times are Eastern Time ( New York)
81f8a3d4 6971 4c2f a701 d3644685743f
Good Trading!
About: Cannon Trading is an independent futures brokerage firm established in 1988 in Los Angeles. Our mission is to provide reliable service along with the latest technological advances and choices while keeping our clients informed and educated in the field of futures and commodities trading.
Trading Futures, Options on Futures, and retail off-exchange foreign currency transactions involves substantial risk of loss and is not suitable for all investors. You should carefully consider whether trading is suitable for you in light of your circumstances, knowledge, and financial resources. You may lose all or more of your initial investment. Opinions, market data, and recommendations are subject to change at any time.
Contact
S
Cannon Trading Company
12100 Wilshire Boulevard
Suite 1640
Los Angeles, CA 90025
(800) 454-9572
Follow Us
Facebook  Twitter  Instagram
Visit Our Website


OPEC Meeting + Futures Trading Levels for April 3rd

Get Real Time updates and more by joining our Private Facebook Group!
Subscribe to our YouTube Channel


C36


OPEC Meeting tomorrow

  • OPEC+ JMMC meets on Wednesday at 1100 GMT
  • Producers earlier agreed to extend output cuts
  • Oil rallies to $89 a barrel, highest this year

LONDON, April 2 (Reuters) – An OPEC+ ministerial panel is unlikely to recommend any oil output policy changes at a meeting on Wednesday, five OPEC+ sources told Reuters, as oil prices hit their highest this year.

The Organization of the Petroleum Exporting Countries and allies led by Russia, known as OPEC+, will hold an online joint ministerial monitoring committee meeting (JMMC) on April 3 to review the market and members’ implementation of output cuts they have already agreed to extend.

Gold hit all time highs!

Gold chart for your review below.


9d030a51 bab9 46e6 89ea f013c8027406


Plan your trade and trade your plan


stars

e35cb555 9ff3 4f00 9fe8 0655b28fbd90

Daily Levels for April 3rd, 2024

be9e5c9c a5a5 4cac 9bfb aa780f8e5287

thumbnail?url=http%3A%2F%2Fi.ytimg.com%2Fvi%2FJnHAMUGdNoM%2Fhqdefault

Economic Reports
provided by: ForexFactory.com
All times are Eastern Time ( New York)
28be01ed 32e0 4782 9729 af04dbcb3640

Improve Your Trading Skills

Get access to proprietary indicators and trading methods, consult with an experienced broker at 1-800-454-9572.

Explore trading methods. Register Here

3b644da2 2bee 4d39 8d98 5208a20bec39

* This is not a solicitation of any order to buy or sell, but a current market view provided by Cannon Trading Inc. Any statement of facts here in contained are derived from sources believed to be reliable, but are not guaranteed as to accuracy, nor they purport to be complete. No responsibility is assumed with respect to any such statement or with respect to any expression of opinion herein contained. Readers are urged to exercise their own judgement in trading.

Gold Outlook + Futures Trading Levels for April 2, 2024

Get Real Time updates and more by joining our Private Facebook Group!
Subscribe to our YouTube Channel


C35


First Week of Q2!

  • Heavy Fed Speeches, 19 Count ’em, Tuesday thru Friday with JPowell on Wednesday @ 11:10 a.m. CDT from Stanford.
  • Earnings season will officially begin the middle of April.
  • Economic Data Highlights : Jobless Claims early Thursday and NonFarm Payrolls headline Friday pre-opening
  • Gold Chart for your viewing below


9d030a51 bab9 46e6 89ea f013c8027406


4ee7278b 3e12 4019 8b79 e3382861f0be

Plan your trade and trade your plan


stars

e35cb555 9ff3 4f00 9fe8 0655b28fbd90

Daily Levels for April 2nd, 2024

b6b1a0dd 2eaf 4af9 bcd8 7c8b7e9715d7

thumbnail?url=http%3A%2F%2Fi.ytimg.com%2Fvi%2FJnHAMUGdNoM%2Fhqdefault

Economic Reports
provided by: ForexFactory.com
All times are Eastern Time ( New York)
76a21941 8f5f 45be 8344 a285dcf4b0e7

Improve Your Trading Skills

Get access to proprietary indicators and trading methods, consult with an experienced broker at 1-800-454-9572.

Explore trading methods. Register Here

3b644da2 2bee 4d39 8d98 5208a20bec39

* This is not a solicitation of any order to buy or sell, but a current market view provided by Cannon Trading Inc. Any statement of facts here in contained are derived from sources believed to be reliable, but are not guaranteed as to accuracy, nor they purport to be complete. No responsibility is assumed with respect to any such statement or with respect to any expression of opinion herein contained. Readers are urged to exercise their own judgement in trading.

Markets Post FOMC + Levels for March 21st 2024

Get Real Time updates and more by joining our Private Facebook Group!
Subscribe to our YouTube Channel


C6


Life After FOMC …..

by Mark O’Brien, Senior Broker

General: 


The Federal Reserve took center stage today.  With inflation proving stickier than expected, the central bank has found itself balancing between a hawkish and dovish view.  The policy-setting FOMC held interest rates steady at the 5.25%-5.50% range for the fifth straight meeting.  The bigger indicator traders were eager to see was the Fed governors’ so-called dot plot that updated their rate and economic projections – for the first time since December.  Turns out, it didn’t deviate from the three rate cuts they previously penciled in by the end of 2024.


Indexes: 


As of this typing, the June E-mini S&P 500 is trading at new all-time highs around 5280.  As well, the June E-mini Dow Jones is trading at its own all-time highs, barely 100 points away from 40,000!


Metals: 


April gold is on the verge of eking out its own all-time high close above last Monday’s closing price of $2,188.60 per ounce.  It’s currently trading ±$2,191.00 per ounce


General pt. II: 


Over the weekend, Japan ended its negative interest rate policy, marking a historic shift away from an aggressive monetary easing program that was implemented years ago to fight chronic deflation.  As part of the decision, the Bank of Japan (BOJ) raised interest rates for the first time in 17 years, lifting its short-term rate to “around zero to 0.1%” from minus 0.1%.


Plan your trade and trade your plan


stars

e35cb555 9ff3 4f00 9fe8 0655b28fbd90

Daily Levels for March 21st, 2024

6d8c1969 faeb 45ef 86a7 555be3b55b38

b0ba1776 c0cd 4536 92c1 eef6595d7173

Economic Reports
provided by: ForexFactory.com
All times are Eastern Time ( New York)
f2a43cd3 379e 4c80 890c 0fe7e5f0d898

Improve Your Trading Skills

Get access to proprietary indicators and trading methods, consult with an experienced broker at 1-800-454-9572.

Explore trading methods. Register Here

3b644da2 2bee 4d39 8d98 5208a20bec39

* This is not a solicitation of any order to buy or sell, but a current market view provided by Cannon Trading Inc. Any statement of facts here in contained are derived from sources believed to be reliable, but are not guaranteed as to accuracy, nor they purport to be complete. No responsibility is assumed with respect to any such statement or with respect to any expression of opinion herein contained. Readers are urged to exercise their own judgement in trading.

Weekly Newsletter: Understanding Price Banding, May Bean Oil Outlook and Automated Gold System

Get Real Time updates and more by joining our Private Facebook Group!
Subscribe to our YouTube Channel

C27

Cannon Futures Weekly Letter Issue # 1186

In this issue:
  •  Important Notices – FOMC Next Week
  • Trading Resource of the Week – Understanding Price Limits and Banding
  • Hot Market of the Week – May Bean Oil
  • Broker’s Trading System of the Week – Gold Swing System
  • Trading Levels for Next Week
  • Trading Reports for Next Week


Important Notices –

  • FOMC Meeting next week. Announcement on Wednesday.
  • Light data most of the week. Housing sales
  • Very few earnings
  • June is front month for indices, currencies and financials.: M = June
  • USA is on daylight savings time – most international countries have NOT changed yet.


Trading Resource of the Week : What are Price Limits and Price Banding? by CMEgroup.com

As a trader, you want to know that there are mechanisms in place to ensure an orderly market. A regulated marketplace like CME Group provides this order by setting price limits and price banding.
Price Limits
Price limits are the maximum price range permitted for a futures contract in each trading session. These price limits are measured in ticks and vary from product to product. When markets hit the price limit, different actions occur depending on the product being traded. Some markets may temporarily halt until price limits can be expanded or trading may be stopped for the day based on regulatory rules. Different futures contracts will have different price limit rules; i.e. Equity Index futures have different rules than Agricultural futures.
Example
Equity Indexes futures have a three level expansion: 7%, 13% and 20% to the downside, and a 7% limit up and down in overnight trading.
When price reaches any of those levels the market will go limit up or limit down.
Calculating Price Limits
Price limits are re-calculated daily and remain in effect for all trading days except in certain physically-deliverable markets, where price limits are lifted prior to expiration so that futures prices are not prevented from converging on prices for the underlying commodity.
Typically, Agricultural futures will go limit up or down most often compared to Equity Index futures which very rarely if ever go limit up or down. When trading a specific product, it is important to be aware of price limits and the mechanisms that occur when limits are hit. Traders also know that it is possible for limits to be reached for more than one session in a row, however the expansion of limit thresholds over the last few years have reduced this occurrence.
Price Banding
Price banding is a similar mechanism which subjects all orders to price validation and rejects orders outside the given band to maintain orderly markets. Bands are calculated dynamically for each product based on the last price, plus or minus a fixed band value. Thus, if markets quickly move in one direction, the price bands dynamically adjust to accommodate new trading ranges.
Conclusion
The rules for each market can be found on cmegroup.com.
It is important to note that traders can place trades outside the daily price limits. These trades will be executed when price limits and price bands move within the specified range. So, traders still have the ability to place good-til-canceled or good-til-date orders inside and outside daily price limits.
In the last few years there are fewer and fewer times that markets will actually go limit up or down, but it is important to be aware of these pricing rules when you trade.
efa302e7 662d 4483 85eb 5655e4b45680


stars

3b644da2 2bee 4d39 8d98 5208a20bec39


  • Hot Market of the Week – May Bean Oil
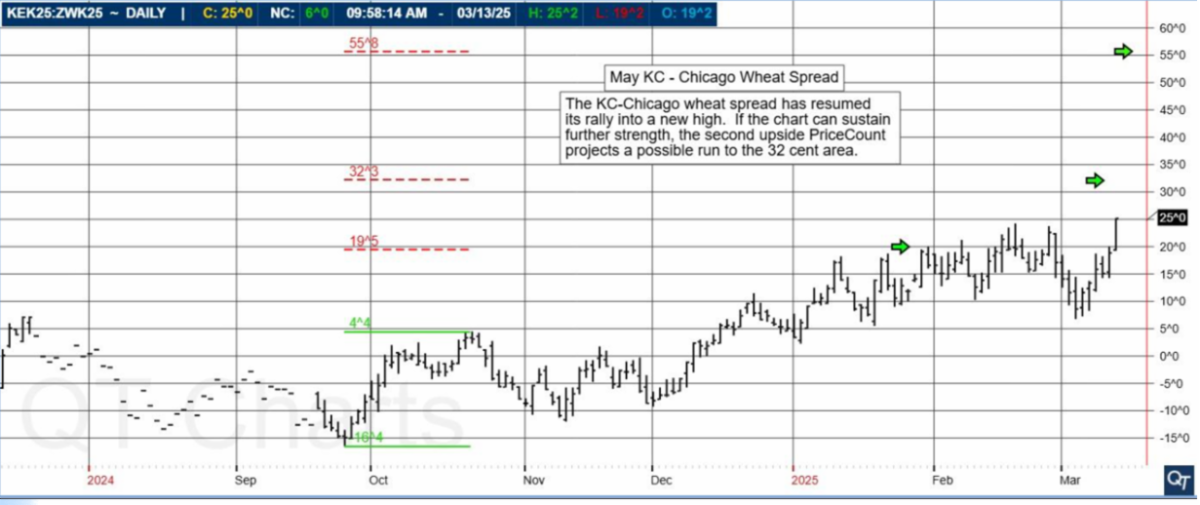
Hot market of the week is provided by QT Market Center, A Swiss army knife charting package that’s not just for Hedgers, Cooperatives and Farmers alike but also for Spread traders, Swing traders and shorter time frame application for intraday traders with a unique proprietary indicator that can be applied to your specific trading needs.
May Bean Oil
The rally in May soybean oil accelerated to its second upside PriceCount objective and now the chart is correcting. At this point, IF you can resume the rally with new sustained highs, the third count would project a possible run to the 50.87 area.
PriceCounts – Not about where we’ve been , but where we might be going next!
5bd46875 4f13 4f46 8290 888342486818
The PriceCount study is a tool that can help to project the distance of a move in price. The counts are not intended to be an ‘exact’ science but rather offer a target area for the four objectives which are based off the first leg of a move with each subsequent count having a smaller percentage of being achieved. It is normal for the chart to react by correcting or consolidating at an objective and then either resuming its move or reversing trend. Best utilized in conjunction with other technical tools, PriceCounts offer one more way to analyze charts and help to manage your positions and risk. Learn more at www.qtchartoftheday.com
Trading in futures, options, securities, derivatives or OTC products entails significant risks which must be understood prior to trading and may not be appropriate for all investors. Past performance of actual trades or strategies is not necessarily indicative of future results.
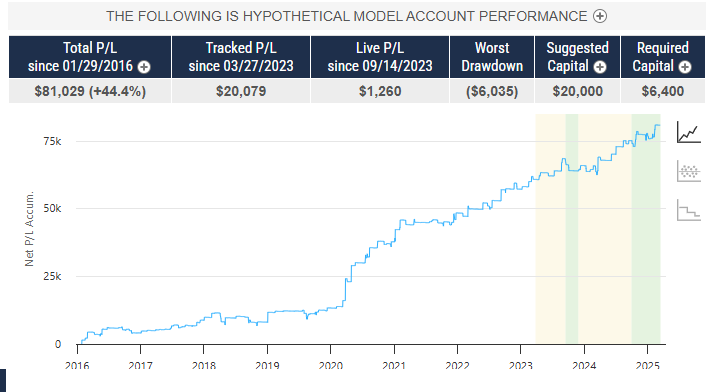
  • Broker’s Trading System of the Week

With algorithmic trading systems becoming more prevalent in portfolio diversification, the following system has been selected as the broker’s choice for this month.
Spartan Gold
PRODUCT
SYSTEM TYPE
Swing
COST
USD 75 / monthly
Recommended Cannon Trading Starting Capital
$20,000
846f5ed4 d467 4de2 9c1d 75acf0c4f4af
The performance shown above is hypothetical in that the chart represents returns in a model account. The model account rises or falls by the average single contract profit and loss achieved by clients trading actual money pursuant to the listed system’s trading signals on the appropriate dates (client fills), or if no actual client profit or loss available – by the hypothetical single contract profit and loss of trades generated by the system’s trading signals on that day in real time (real‐time) less slippage, or if no real time profit or loss available – by the hypothetical single contract profit and loss of trades generated by running the system logic backwards on back adjusted data. Please read full disclaimer HERE.
Would you like to receive daily support & resistance levels?
Yes
S
No
S


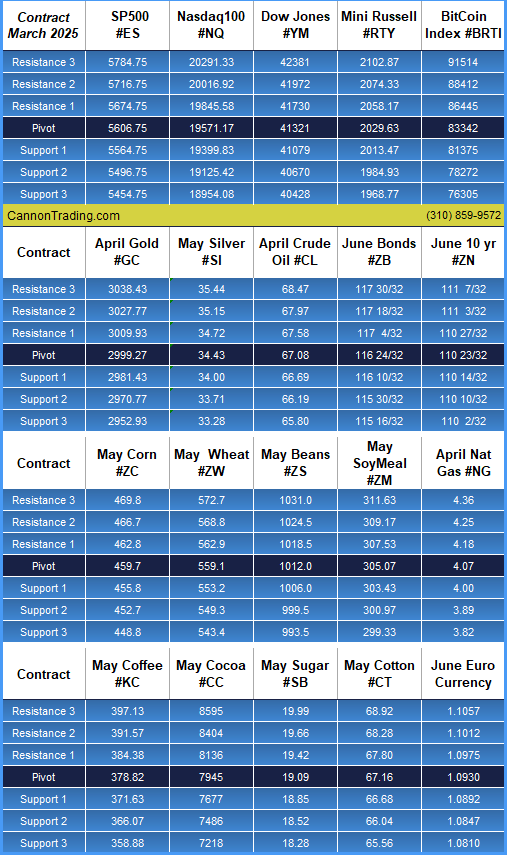
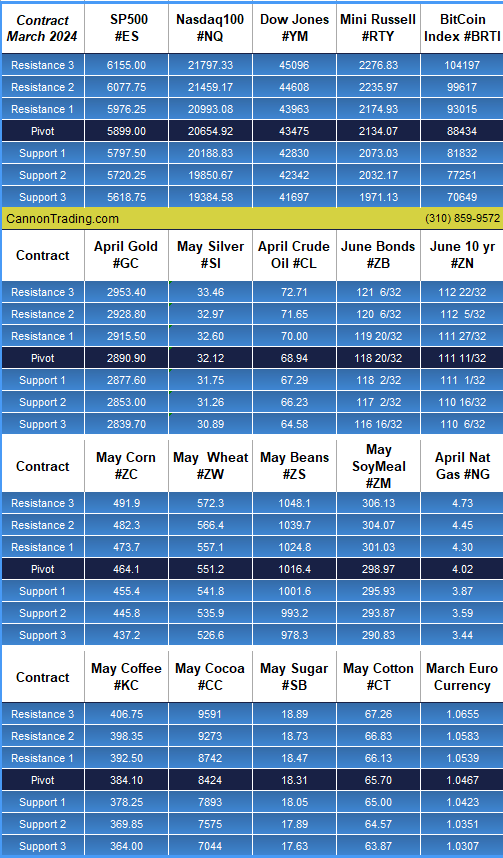
Daily Levels for March 18th 2024

b6a2bf3a a499 4edd 8d8e e4d3d22769b4

Trading Reports for Next Week

58d4627d b4e3 4117 a10c 1ddf826463a9
First Notice (FN), Last trading (LT) Days for the Week:

Improve Your Trading Skills

Get access to proprietary indicators and trading methods, consult with an experienced broker at 1-800-454-9572.

Explore trading methods. Register Here

871e501d 3a1d 4e83 8ee9 a2be76e7992f

* This is not a solicitation of any order to buy or sell, but a current market view provided by Cannon Trading Inc. Any statement of facts here in contained are derived from sources believed to be reliable, but are not guaranteed as to accuracy, nor they purport to be complete. No responsibility is assumed with respect to any such statement or with respect to any expression of opinion herein contained. Readers are urged to exercise their own judgement in trading.

Ahead of NFP + Futures Trading Levels for 03.06.2024

Get Real Time updates and more by joining our Private Facebook Group!
Subscribe to our YouTube Channel


C21


Bullet Points, Highlights, Announcements


Heads up: 


Keep an eye out for Friday (7:30 A.M., Central Time) for the release of the monthly Non-farm Payrolls report by the Labor Department.  It’s widely considered to be one of the most important and influential measures of the U.S. economy.


To review, the Labor Dept.’s Bureau of Labor Statistics surveys about 141,000 businesses and government agencies, representing approximately 486,000 individual work sites.  The report excludes farm workers, private household employees, domestic household workers and non-profit organization employees.  The report also includes other detailed industry data including the overall unemployment rate as a percentage of the total labor force that is unemployed but actively seeking work, wages, wage growth and average workday hours.


General:  


It was truly an historical day yesterday.  Both the decades-old 100-oz gold futures contract and the seven-year-old Bitcoin futures contracts traded up to all-time highs.  Apart from any of the stock index futures contracts, rarely do we see simultaneous all-time highs for futures contracts.  April gold touched $2,150.50 per ounce (and is trading at new all-time highs again today), while the March Bitcoin futures hit 70,195 – before a significant ±10,000-point sell-off in a span of four hours around mid-session.


But wait, there’s more!  May cocoa traded up to its own all-time high yesterday as well, hitting $6,660/metric ton intra-day.  This is a ±$26,000 move for cocoa in a little more than two months, having closed at $4,048 on Jan. 8.


Three consecutive all-time highs in futures: gold, Bitcoin and cocoa.  Oh my!


Energy:  


Managing Director and Global Head of Commodity Strategy at Royal Bank of Canada’s Capital Markets Division.  That’s quite a title and it’s how Helima Croft’s business card reads.  She’s well regarded as a specialist in geopolitics and energy and along with her team of commodity strategists who cover energy and metals are seeing signs of the higher supply/lower demand imbalance in crude oil tipping in the other direction.  This is a macro prediction and not forecasting any sort of breakneck move to $100/barrel and it rests in part on the view that the U.S. will be unable to replicate its “blockbuster” output of 2023.  It also anticipates OPEC+ will look to press on with its aggressive production cuts having already committed to extending its 2.2 million barrel-a-day production cut through June.  The projection also sees the conflict in the Middle East as instilling a risk premium in energy prices that isn’t going away soon and may increase if the region sees a spread of hostilities.


Plan your trade and trade your plan


stars

e35cb555 9ff3 4f00 9fe8 0655b28fbd90

Daily Levels for March 7th, 2024

aa2ec8ad 1144 45ca ad54 757166fc8d2d

b0ba1776 c0cd 4536 92c1 eef6595d7173

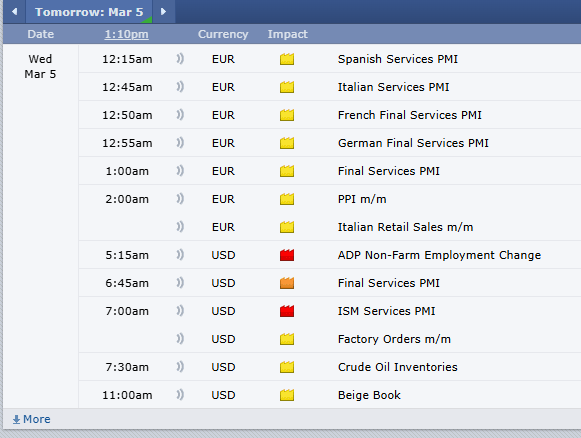
Economic Reports
provided by: ForexFactory.com
All times are Eastern Time ( New York)
123ef476 aa2f 4eac bbe8 67d6dc23d5bf

Improve Your Trading Skills

Get access to proprietary indicators and trading methods, consult with an experienced broker at 1-800-454-9572.

Explore trading methods. Register Here

3b644da2 2bee 4d39 8d98 5208a20bec39

* This is not a solicitation of any order to buy or sell, but a current market view provided by Cannon Trading Inc. Any statement of facts here in contained are derived from sources believed to be reliable, but are not guaranteed as to accuracy, nor they purport to be complete. No responsibility is assumed with respect to any such statement or with respect to any expression of opinion herein contained. Readers are urged to exercise their own judgement in trading.

Analysis of gold as we hit all time highs!

Get Real Time updates and more by joining our Private Facebook Group!
Subscribe to our YouTube Channel


C20


Gold’s Performance Against U.S., Asian Equities the Past Century

By Erik Norland of CMEGroup.com

Is gold a more profitable investment than equities over the long term? Our finding is that the value of gold has mostly held its own against the U.S. equity market since the S&P 500 time series began over 94 years ago (Figure 1). A well-defined picture of their performance through peaks and troughs is evident when the S&P 500 dollar value is repriced in gold, which is done by dividing the S&P 500 by the U.S. dollar price of one troy ounce of bullion (Figure 2).

Figure 1: Overall, gold has nearly held its own versus equities over the past 100 years.


4499bac2 55ef 41f7 a541 21479a9e17a1


9c1e2f79 fcaf 47e3 99b1 0d460c5f0683


The S&P 500/gold ratio has been subject to extremely strong trends and occasional periods of consolidation which correspond with different economic and geopolitical situations, some of which benefitted equities relative to gold and vice versa. Generally, equities have done better than gold during periods of geopolitical stability, disinflation and steady economic growth, while gold tends to outperform during periods of instability. Switching from one circumstance to another can set off powerful trends in the S&P 500/gold ratio that can last for years, even decades. The same goes for Asian equity markets when compared to gold, although the price history isn’t as long and the patterns differ both in equity market performance and trends in the currency market.

Since the equity market’s peak on September 3, 1929, the S&P 500/gold ratio has been through six distinct eras:

  • 1929-1942: The Great Depression and the Rise of the Axis Powers: Between 1929 and 1933 S&P 500 fell by 86% in U.S. dollar terms. In 1933, the incoming Roosevelt Administration’s first action was to devalue the dollar versus gold from $23 to $35 per ounce, a 52% gain for anyone who was still able to hold on to gold. Between 1933 and 1942, equities stagnated as the U.S. struggled to recover from the Depression and as the Axis Powers of Germany, Italy and Japan reached their peak of expansion in 1942.
  • 1942-1968: Allied Victory, Bretton Woods and Superpower Parity: as the Allies turned the tide in the war, equity markets began to rally. Stocks continued upward with only brief pauses around the time of the Korean War and the Cuban missile crisis. Under the post-war Bretton Woods system of fixed exchange rates, the dollar remained fixed at $35 per ounce and foreign currencies were pegged to the dollar. The S&P 500 soared 1,165% versus the dollar and gold.
  • 1968-1980: Overheating and Stagflation: The combination of the Great Society program and Vietnam War overheated the U.S. economy, leading to successive waves of inflation. Amid rising prices, the U.S. dollar peg to gold was no longer tenable. In 1971, the Nixon Administration pulled the plug on Bretton Woods, setting off a rally in gold prices that took the yellow metal from $35 to $800 per ounce by the end of the decade. Equity prices traded sideways in a wide range during this period of uncertainty which also featured the U.S. withdrawal from Vietnam, the 1973 Arab Embargo, the Iranian Revolution and the Soviet invasion of Afghanistan. Relative to gold, the S&P 500 fell by 95%.
  • 1980-2000: Disinflation and Pax Americana: Over the course of two decades the S&P 500 rose by 4,137% versus gold as stock prices soared and precious metals retreated amid tight money, falling inflation and improved economic growth.
  • 2000-2011: The Tech Wreck, War on Terror and the Global Financial Crisis: during this period, the S&P 500 lost 89% in gold terms.
  • 2011-2021: Pax Americana Part 2: From 2011-2019 equities soared amid a slow, low-inflation recovery in the U.S. that sent the price of gold substantially lower. While equities fell in the early stages of the Covid-19 pandemic, fiscal stimulus and $4.9 trillion of Federal Reserve quantitative easing (QE) purchases initially benefitted equities more than gold. Overall, the S&P 500 outperformed gold by 337% during this time.

What’s next? The S&P fell 28% versus gold from late 2021 through 2022, and despite its 2023 rebound led by mega-cap companies dubbed the Magnificent Seven, it remains 5% lower versus gold as of late February 2024 despite being about 6% above its 2021 highs when expressed in dollar terms. A few points are clear:

  • The S&P has lost its upside momentum versus gold.
  • The world may have entered a lasting period of geopolitical instability with Russia and other powers challenging the U.S.-led order.
  • It’s not clear if the U.S. and its peers will return to lastingly low levels of inflation or not.
  • Central banks have conducted the biggest tightening cycle in over 40 years, which may increase the risk of a global economic downturn and subsequent monetary easing.

These points have the potential to turn the tide against U.S. equities, which are highly valued (see our related article here), in favor of hard assets like gold. But what about much less expensive equity markets like those in China, Japan and Korea? South Korea’s KOSPI Index, Japan’s Nikkei 225 and Hong Kong’s Hang Seng Index have their own strong trends versus gold.

READ THE REST


Plan your trade and trade your plan


stars

e35cb555 9ff3 4f00 9fe8 0655b28fbd90

d52986c1 1df3 42ae a9c9 81a1636d587e

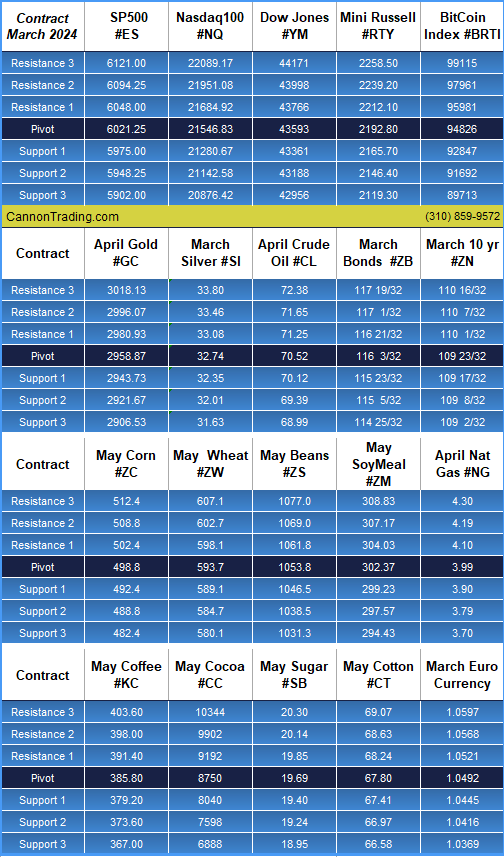
Daily Levels for March 6th, 2024

e138b1c7 ee6d 49ff 8cd9 3e8c2466355e

b0ba1776 c0cd 4536 92c1 eef6595d7173

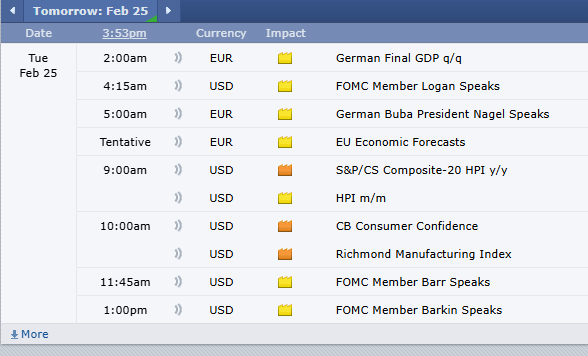
Economic Reports
provided by: ForexFactory.com
All times are Eastern Time ( New York)
3a89076e 8ed6 45ad 9a26 5adbf7a41c4b

Improve Your Trading Skills

Get access to proprietary indicators and trading methods, consult with an experienced broker at 1-800-454-9572.

Explore trading methods. Register Here

3b644da2 2bee 4d39 8d98 5208a20bec39

* This is not a solicitation of any order to buy or sell, but a current market view provided by Cannon Trading Inc. Any statement of facts here in contained are derived from sources believed to be reliable, but are not guaranteed as to accuracy, nor they purport to be complete. No responsibility is assumed with respect to any such statement or with respect to any expression of opinion herein contained. Readers are urged to exercise their own judgement in trading.