NQ Futures Contract

The NQ futures contract, also known as the Nasdaq-100 futures contract or the E-mini Nasdaq-100 futures contract, is a cornerstone of modern futures trading. Representing 100 of the largest non-financial companies listed on the Nasdaq stock exchange, this contract is highly favored for its liquidity, volatility, and utility in both speculative and hedging strategies. In this article, we delve into the origins, evolution, and impact of the NQ futures contract, exploring its top historical turning points, contract size evolution, hedging applications, and why Cannon Trading Company stands out as a premier choice among futures brokers.

The Top 5 Major Turning Points in the History of the NQ Futures Contract

  1. Introduction of the Nasdaq-100 Index and Futures Contracts (1985)
    The foundation of the NQ futures contract began with the launch of the Nasdaq-100 index in 1985. This index represented a weighted basket of 100 non-financial companies, offering investors a way to track the performance of technology and growth-driven sectors. Shortly thereafter, the introduction of the Nasdaq-100 futures contract allowed investors to speculate on the index’s movement. At its inception, the contract size was much larger than the current E-mini Nasdaq-100 futures contract, catering primarily to institutional investors.
  2. The Dot-Com Boom and Bust (1990s–2000s)
    The late 1990s saw a surge in tech stock valuations, which dramatically impacted the Nasdaq-100 futures contract. During the dot-com boom, the NQ futures contract became a key vehicle for speculative trading, as traders sought to capitalize on the astronomical rise in tech stocks. However, the bust that followed in the early 2000s underscored the contract’s volatility. This era highlighted the need for smaller, more accessible contracts for retail traders, leading to the creation of the E-mini Nasdaq-100 futures contract in 1997.
  3. Introduction of E-mini Nasdaq-100 Futures (1997)
    The launch of the E-mini Nasdaq-100 futures contract marked a transformative moment in futures trading. Designed to be one-fifth the size of the original contract, the E-mini lowered the barrier to entry for individual traders and smaller institutional players. This innovation democratized trading and spurred a surge in participation, cementing the NQ futures contract’s reputation as a versatile tool for trading Nasdaq-linked securities.
  4. Global Financial Crisis (2008)
    During the 2008 financial crisis, the NQ futures contract experienced unprecedented volatility. Investors and fund managers turned to futures markets to hedge their equity positions against sharp declines. The crisis underscored the importance of liquidity and robust market access, which the E-mini contracts provided in abundance. This period also saw the introduction of advanced electronic trading platforms, enabling rapid execution of trades—a trend embraced by top futures brokers like Cannon Trading Company.
  5. Rise of Algorithmic Trading and Micro E-mini Contracts (2019)
    In 2019, the Chicago Mercantile Exchange (CME) introduced the Micro E-mini Nasdaq-100 futures contract, offering an even smaller notional value (one-tenth the size of the E-mini). This evolution catered to novice traders and those seeking greater precision in their trading strategies. Combined with advancements in algorithmic trading, this development has cemented the NQ futures contract’s role as a versatile instrument in modern markets.

Contract Size: Then and Now

At its inception, the Nasdaq-100 futures contract was designed with a larger notional value, making it suitable primarily for institutional investors. With the introduction of the E-mini Nasdaq-100 futures contract, the size was reduced to 20 times the index’s value, significantly increasing accessibility.

Today, traders can choose from multiple contract sizes:

  • E-mini Nasdaq-100 Futures Contract: 20 times the index value.
  • Micro E-mini Nasdaq-100 Futures Contract: 2 times the index value.

This tiered structure ensures that traders of all scales—from retail investors to institutional hedgers—can find a product that aligns with their risk tolerance and trading objectives.

Hedging with NQ Futures Contracts: Practical Applications

The NQ futures contract is not just for speculation—it’s a powerful hedging tool. For investors with significant exposure to Nasdaq-listed equities, trading the NQ futures contract or its options can mitigate potential losses during market downturns.

Example 1: Protecting a Technology-Heavy Portfolio

Imagine an investor with a $500,000 portfolio heavily concentrated in technology stocks like Apple, Microsoft, and Nvidia. If the investor anticipates a short-term decline in the tech sector, they can sell NQ futures contracts to offset potential losses. A single E-mini Nasdaq-100 futures contract moves in $20 increments for each point change in the index, offering precise risk management.

Example 2: Using Options on NQ Futures

Options on the Nasdaq-100 futures contract provide additional flexibility. For example:

  • A call option can be purchased to speculate on a market rebound without committing to a full futures position.
  • A put option can protect against significant downturns, acting as a form of insurance for the investor’s portfolio.

Options on E-mini Nasdaq-100 futures contracts are particularly popular due to their smaller contract size and manageable margin requirements, making them an excellent tool for hedging Nasdaq exposure.

Why Choose Cannon Trading Company?

When trading Nasdaq-100 futures contracts, selecting the right futures broker is critical. Cannon Trading Company consistently earns accolades from traders for several compelling reasons:

  • Free Trading Platform
    Cannon Trading offers a free, robust trading platform, ensuring that traders have access to advanced tools for charting, analytics, and trade execution. This cost-effective solution is particularly attractive for those trading the E-mini Nasdaq-100 futures contract or the Micro version.
  • 5-Star Ratings on TrustPilot
    The company’s exceptional reputation is reflected in its perfect 5-star ratings on TrustPilot. From seamless customer service to efficient trade execution, Cannon Trading is consistently praised by clients for delivering a top-tier trading experience.
  • Dedicated Brokers with Decades of Experience
    Unlike many futures brokers, Cannon Trading provides access to a team of seasoned professionals with decades of expertise in futures trading. These dedicated brokers guide clients through complex markets, ensuring informed decision-making and personalized support.
  • Regulatory Excellence
    A stellar reputation with regulatory bodies ensures that traders can trust Cannon Trading to operate with integrity and transparency. Compliance and client protection are central to their operations, making them a trusted partner for trading Nasdaq-100 futures contracts.
  • Superior Customer Service and Resources
    Cannon Trading excels in client education, offering webinars, market analysis, and one-on-one consultations. This commitment to client success sets it apart from other futures brokers, solidifying its reputation as a leader in the industry.

The NQ futures contract has evolved from its origins as a tool for institutional hedging to a versatile instrument accessible to all levels of traders. From the introduction of the Nasdaq-100 index to the launch of Micro E-mini contracts, the product’s history is marked by innovation and adaptation to market needs. Today, the combination of diverse contract sizes, robust hedging applications, and user-friendly platforms makes the Nasdaq-100 futures contract a cornerstone of futures trading.

For those seeking a reliable futures broker to navigate this dynamic market, Cannon Trading Company stands out. With its free trading platform, 5-star TrustPilot ratings, experienced brokers, and commitment to regulatory excellence, Cannon Trading offers unparalleled support for traders of E-mini Nasdaq-100 futures contracts and beyond. Whether hedging a portfolio or exploring speculative opportunities, partnering with a trusted broker like Cannon Trading ensures a seamless and rewarding trading experience.

For more information, click here.

Ready to start trading futures? Call us at 1(800)454-9572 – Int’l (310)859-9572 (International), or email info@cannontrading.com to speak with one of our experienced, Series-3 licensed futures brokers and begin your futures trading journey with Cannon Trading Company today.

Disclaimer: Trading Futures, Options on Futures, and retail off-exchange foreign currency transactions involve substantial risk of loss and are not suitable for all investors. Past performance is not indicative of future results. Carefully consider if trading is suitable for you in light of your circumstances, knowledge, and financial resources. You may lose all or more of your initial investment. Opinions, market data, and recommendations are subject to change at any time.

Important: Trading commodity futures and options involves a substantial risk of loss. The recommendations contained in this article are opinions only and do not guarantee any profits. This article is for educational purposes. Past performances are not necessarily indicative of future results.

This article has been generated with the help of AI Technology and modified for accuracy and compliance.

Follow us on all socials: @cannontrading

Weekly Newsletter: Elections, FOMC, Volatile Week Ahead+ Trading Levels for Nov. 4th

Get Real Time updates and more by joining our Private Facebook Group!
Subscribe to our YouTube Channel

C101

Cannon Futures Weekly Letter Issue # 1215

In this issue:

  •  Important Notices – Elections, FOMC – Volatile Week ahead.
  • Futures 102 – Crude Oil Outlook + Premium Daily Research
  • Hot Market of the Week – March sugar
  • Broker’s Trading System of the Week – Nikkei 225 Swing System
  • Trading Levels for Next Week
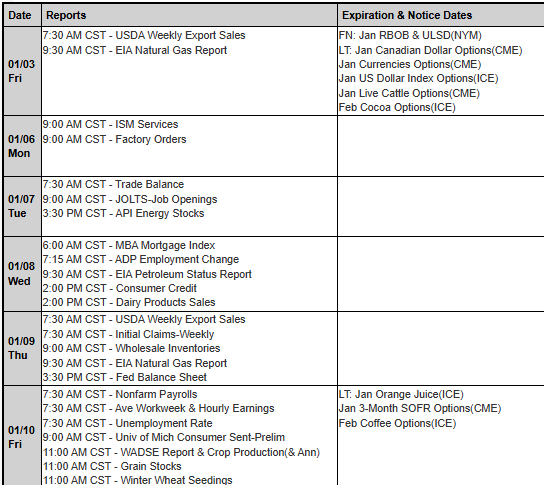
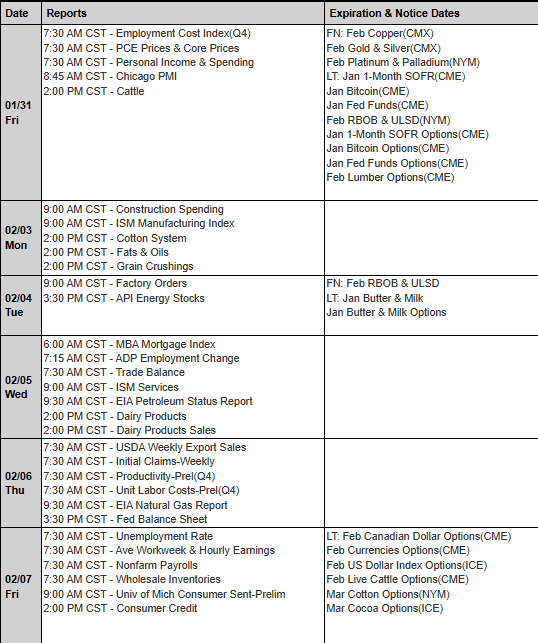
  • Trading Reports for Next Week


Important Notices – Next Week Highlights:


The Week Ahead

By John Thorpe, Senior Broker

Time change, Clocks “Fall Back” 1 hour in U.S. Nov. 2nd, US Presidential Election Nov 5th, Fed Rate announcement (expectations are .25 cut), 3756 corporate earnings reports and a few Economic data releases. To wit, Market volatility could be very high next week.

Many clearing firms will be raising margins to protect from and for the undercapitalized in what could be extreme moves related to the US Election outcomes which may not be known for hours or days following poll closings Tuesday evening.


Tuesday is the 60th U.S. Quadrennial Presidential Election, Polls close @ 7:00 P.M. in each of the 4 time zones. (a recent Nevada Supreme Court Ruling allows un-postmarked mail-in ballots received within 3 days past the official poll closing may be counted)


Prominent Earnings this Week:

  • The following are the largest cap stocks reporting and for those that are little known, however their market cap is in the billions of dollars, I have provided lists of their core services, you will agree they fulfill critical roles in our internet of things infrastructure.
  • Wed. Qualcomm, ARM Holdings (operates as a holding company, which engages in the licensing, marketing, research, and development of microprocessors, systems IP, graphics processing units, physical IP and associated systems IP, software, and tools.) Gilead Sciences report post close.
  • Thu. Arista Networks (engages in the development, marketing, and sale of cloud networking solutions. Its solutions include EOS, a set of network applications, and Gigabit Ethernet switching and routing platforms. Its product categories include Core, Cognitive Adjacencies, and Network Software and Services) AirBNB


FED SPEECHES:

  • Mon. quiet
  • Tue. quiet
  • Wed. Day 1 FOMC
  • Thu. Day 2 FOMC Rate Decision 1pm CST, Powell Presser @ 1:30 pm CST
  • Fri. quiet


Big Economic Data week:

  • Mon. Factory Orders
  • Tues. U.S. Trade Balance, ISM Services PMI, Redbook
  • Wed. Quiet
  • Thur. Retail Inventories, Jobless Claims, FED RATE Decision
  • Fri. Michigan Consumer Sentiment, agricultural numbers>WASDE 11:00 a.m. CST


Futures 101: Ask a Broker!!

Ask a Broker: Bollinger Bands?

Bollinger Bands


Futures 102: Crude Oil In Depth Analysis

Please click here to instantly view a PDF with Crude Oil outlook for the short, medium and long term.

With tensions in Middle East yoyoing…you may want o read and view the outlook provided by Artac Advisory!

Crude Oil PDF Outlook HERE.


stars

3b644da2 2bee 4d39 8d98 5208a20bec39


    • Hot Market of the Week – March Sugar

    Hot market of the week is provided by QT Market Center, A Swiss army knife charting package that’s not just for Hedgers, Cooperatives and Farmers alike but also for Spread traders, Swing traders and shorter time frame application for intraday traders with a unique proprietary indicator that can be applied to your specific trading needs.
    FREE TRIAL AVAILABLE

    March Sugar

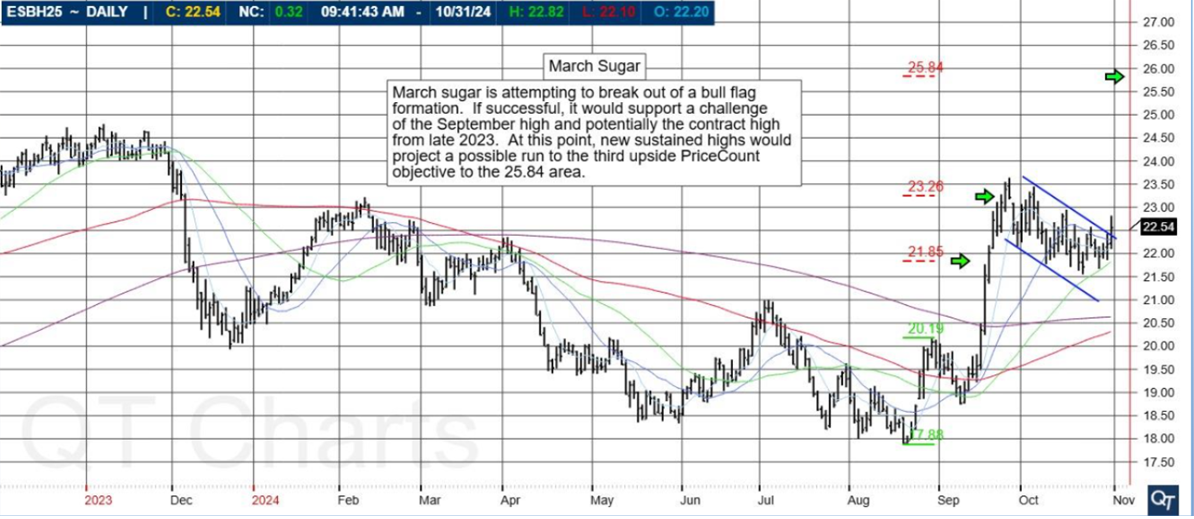
    March sugar is attempting to break out of a bull flag formation. If successful, it would support a challenge of the September high and potentially the contract high from late 2023. At this point, new sustained highs would project a possible run to the third upside PriceCount objective to the 25.84 area.


    PriceCounts – Not about where we’ve been , but where we might be going next!

    dbfaff1d a7a1 407d 9b9b ac58d7a723c2

The PriceCount study is a tool that can help to project the distance of a move in price. The counts are not intended to be an ‘exact’ science but rather offer a target area for the four objectives which are based off the first leg of a move with each subsequent count having a smaller percentage of being achieved. It is normal for the chart to react by correcting or consolidating at an objective and then either resuming its move or reversing trend. Best utilized in conjunction with other technical tools, PriceCounts offer one more way to analyze charts and help to manage your positions and risk. Learn more at www.qtchartoftheday.com
Trading in futures, options, securities, derivatives or OTC products entails significant risks which must be understood prior to trading and may not be appropriate for all investors. Past performance of actual trades or strategies is not necessarily indicative of future results.
   Broker’s Trading System of the Week

With algorithmic trading systems becoming more prevalent in portfolio diversification, the following system has been selected as the broker’s choice for this month.
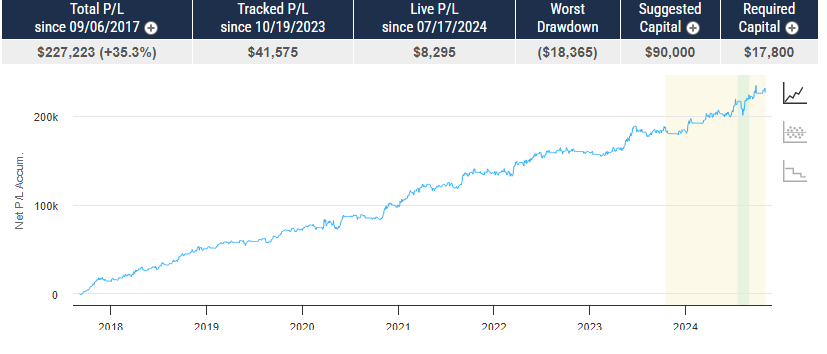
QuantumFusion ProMax

PRODUCT

NK – Nikkei 225


SYSTEM TYPE

Swing Trading


Recommended Cannon Trading Starting Capital

$50,000


COST

USD 165 / monthly


Get Started

Learn More

1b80c371 48c5 4acb bf0f 5b6a463a8dc7

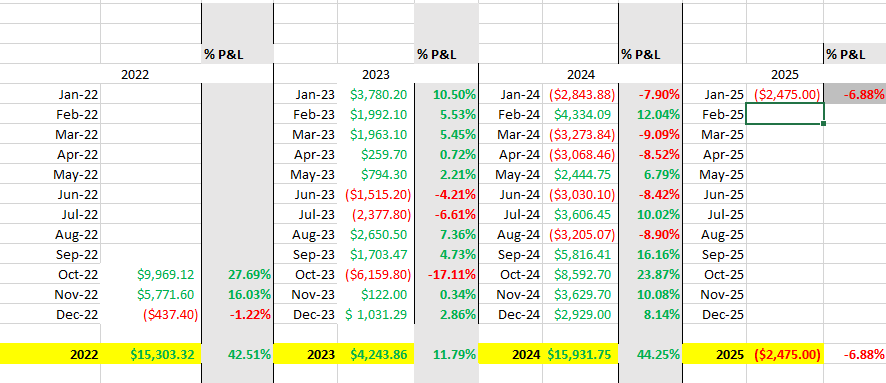
The performance shown above is hypothetical in that the chart represents returns in a model account. The model account rises or falls by the average single contract profit and loss achieved by clients trading actual money pursuant to the listed system’s trading signals on the appropriate dates (client fills), or if no actual client profit or loss available – by the hypothetical single contract profit and loss of trades generated by the system’s trading signals on that day in real time (real‐time) less slippage, or if no real time profit or loss available – by the hypothetical single contract profit and loss of trades generated by running the system logic backwards on back adjusted data. Please read full disclaimer HERE.
Would you like to receive daily support & resistance levels?
Yes
S
No
S

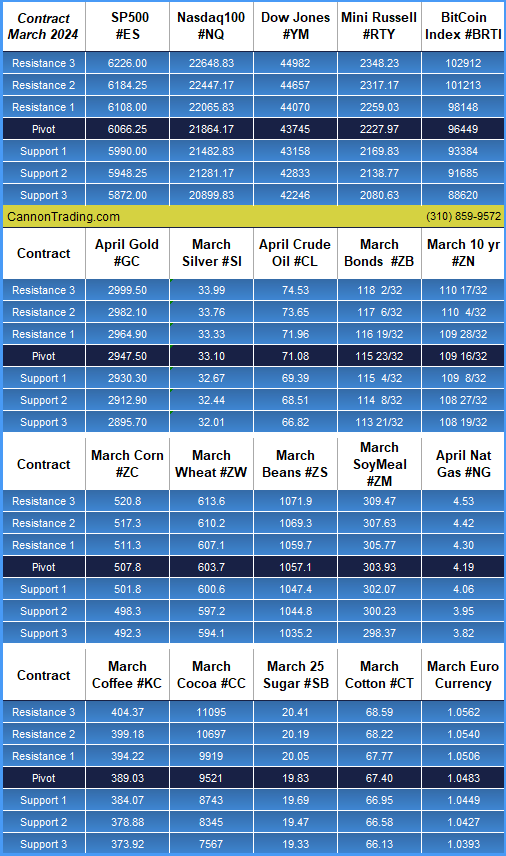
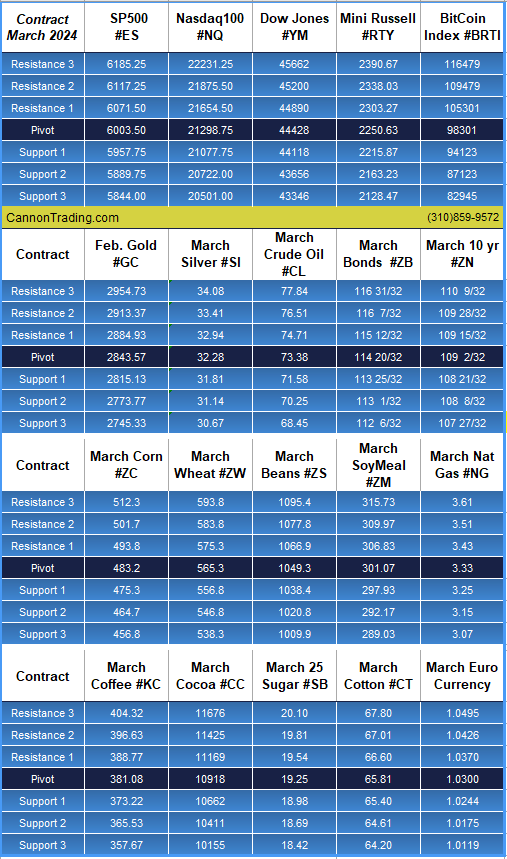
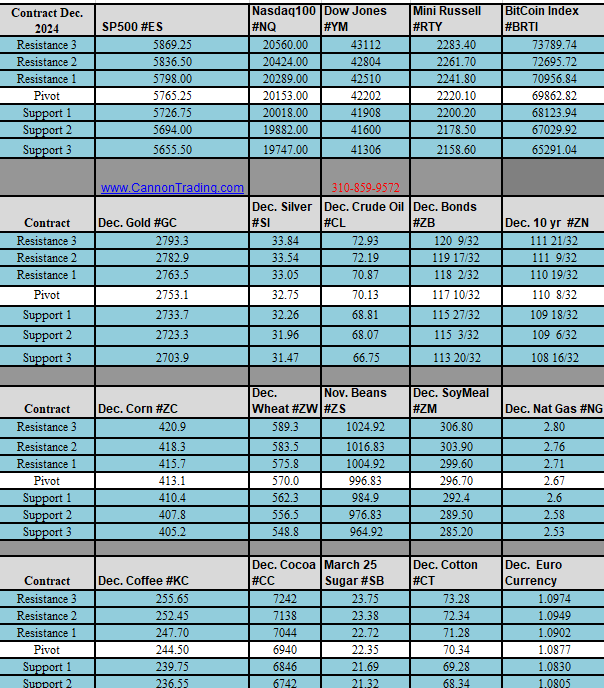
Daily Levels for November 4th, 2024

ba59adaa 213f 430c 90cc 5bb758bfd7e9

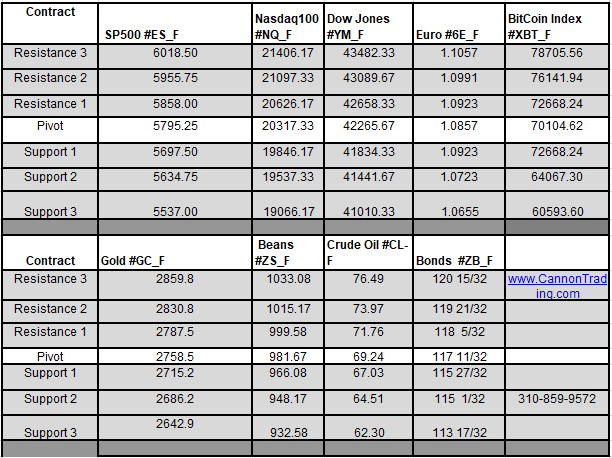
Weekly Levels for the week of November 4th, 2024

d3fb33b3 1817 41bd 88c5 f150949c7217


bf9b3e0d 9c23 44e8 980c a8c01bfbe2cf

Trading Reports for Next Week

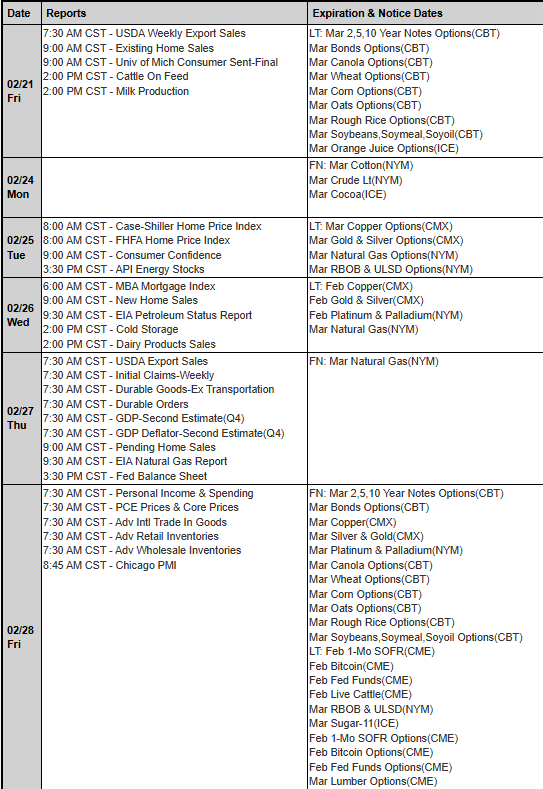
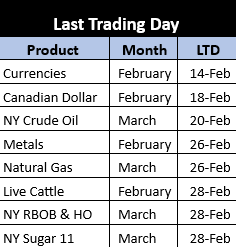
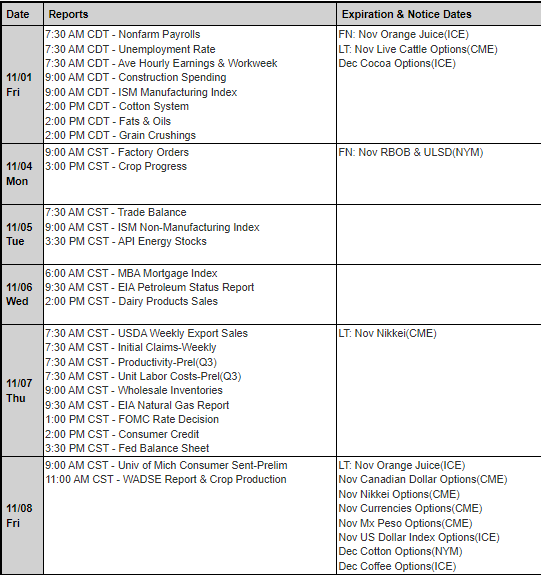
First Notice (FN), Last trading (LT) Days for the Week:
4b4c4fb2 3241 43c0 a073 bf7aab53c942

Improve Your Trading Skills

Get access to proprietary indicators and trading methods, consult with an experienced broker at 1-800-454-9572.

Explore trading methods. Register Here

* This is not a solicitation of any order to buy or sell, but a current market view provided by Cannon Trading Inc. Any statement of facts here in contained are derived from sources believed to be reliable, but are not guaranteed as to accuracy, nor they purport to be complete. No responsibility is assumed with respect to any such statement or with respect to any expression of opinion herein contained. Readers are urged to exercise their own judgement in trading.

Weekly Newsletter: Learn about Tick Size, Copper System, Sugar Chart + Trading Levels for Sept. 23rd

Get Real Time updates and more by joining our Private Facebook Group!
Subscribe to our YouTube Channel

C93

Cannon Futures Weekly Letter Issue # 1209

In this issue:

  • Important Notices – Heavy Fed Speaking, Active Data, Few Earnings
  • Futures 101 – Tick Size & Minimum Fluctuations
  • Hot Market of the Week – March Sugar
  • Broker’s Trading System of the Week – Copper Swing Trading System
  • Trading Levels for Next Week
  • Trading Reports for Next Week


Important Notices – Next Week Highlights:


The Week Ahead

Heavy Fed Speak Week, active data and a few earnings highlight the week ahead.


Light Earnings, by largest Market Cap

  • Wed, Micron Technologies After the close
  • Thursday, Accenture pre-open, Costco after the close


Fed Speak schedule

  • Mon. Goolsbee 9:15am CDT, Kashkari Noon CDT
  • Tues. Bowman 8:00am CDT
  • Wed. Kugler 3:00pm CDT
  • Thu. Collins 8:10amCDT, Powell 8:20am CDT, Williams 8:25 CDT, Treasury Sec. Yellen 10:15am CDT


Big Economic Data week:

  • Mon. S&P PMI Flash
  • Tues. Case-Shiller Home prices, CB Consumer Confidence, Redbook, Richmond Fed.
  • Wed. Building Permits, New Home Sales
  • Thur. Jobless Claims, Core PCE Final, GDP Final, Durable goods, Pending Home sales
  • Fri. Personal Income, Retail and Wholesale Inventories, Michigan consumer sentiment


How to Rollover on the E-Futures Platform video below

thumbnail?url=https%3A%2F%2Fi.vimeocdn


  • Futures 101: Tick Movements: Understanding How They Work

    Minimum Price Fluctuation

    All futures contracts have a minimum price fluctuation also known as a tick. Tick sizes are set by the exchange and vary by contract instrument.

    E-min S&P 500 tick

    For example, the tick size of an E-Mini S&P 500 Futures Contract is equal to one quarter of an index point. Since an index point is valued at $50 for the E-Mini S&P 500, a movement of one tick would be

    .25 x $50 = $12.50

    NYMEX WTI Crude Oil

    The tick size of the NYMEX WTI Crude Oil contract is equal to 1 cent and the WTI contract size is 1,000 barrels. Therefore, the value of a one tick move is $10.

    Summary

    Tick sizes are defined by the exchange and vary depending on the size of the financial instrument and requirements of the marketplace. Tick sizes are set to provide optimal liquidity and tight bid-ask spreads.

    The minimum price fluctuation for any CME Group contract can be found on the product specification pages.


stars

3b644da2 2bee 4d39 8d98 5208a20bec39


    • Hot Market of the Week – December Gold

    Hot market of the week is provided by QT Market Center, A Swiss army knife charting package that’s not just for Hedgers, Cooperatives and Farmers alike but also for Spread traders, Swing traders and shorter time frame application for intraday traders with a unique proprietary indicator that can be applied to your specific trading needs.

    FREE TRIAL AVAILABLE

    March 2025 Sugar

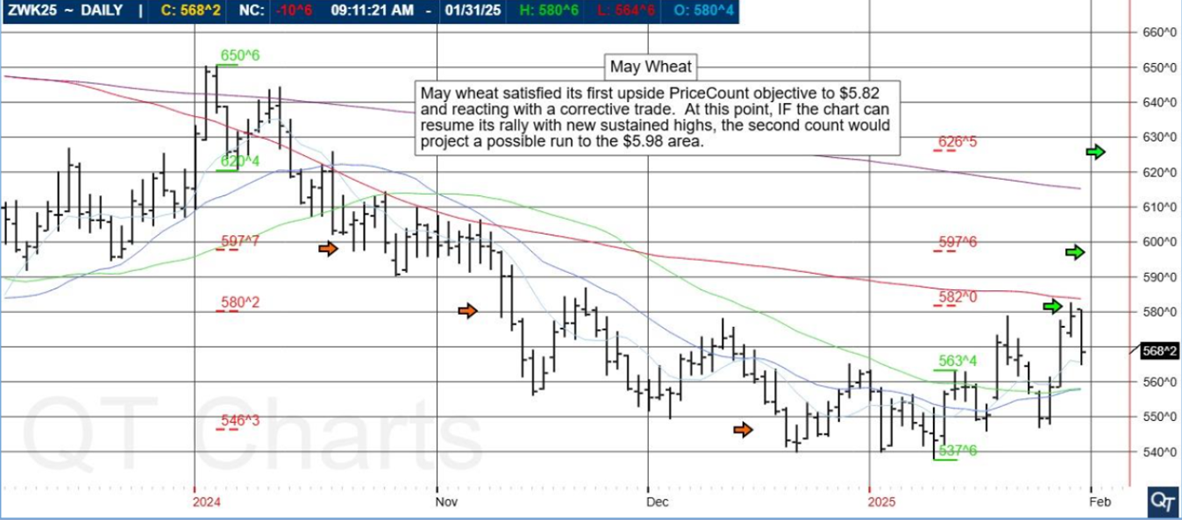
    March sugar has shifted its formation back to the topisde and activated upside PriceCount objectives in the process. The chart accelerated to its first upside count to the 21.85 area. It would be normal to get a near term reaction form theis level in the form of a consolidation or corrective trdae. IF you can sustain further strength, the second count projects a possible run to the 23.26 area.


    PriceCounts – Not about where we’ve been, but where we might be going next!

1e5f6ba4 5ab1 4978 9add 01c8cc561e77
The PriceCount study is a tool that can help to project the distance of a move in price. The counts are not intended to be an ‘exact’ science but rather offer a target area for the four objectives which are based off the first leg of a move with each subsequent count having a smaller percentage of being achieved. It is normal for the chart to react by correcting or consolidating at an objective and then either resuming its move or reversing trend. Best utilized in conjunction with other technical tools, PriceCounts offer one more way to analyze charts and help to manage your positions and risk. Learn more at www.qtchartoftheday.com
Trading in futures, options, securities, derivatives or OTC products entails significant risks which must be understood prior to trading and may not be appropriate for all investors. Past performance of actual trades or strategies is not necessarily indicative of future results.

   Broker’s Trading System of the Week

With algorithmic trading systems becoming more prevalent in portfolio diversification, the following system has been selected as the broker’s choice for this month.

Balance Cont. v.22

PRODUCT

HG – Copper
SYSTEM TYPE

Day Trading


Recommended Cannon Trading Starting Capital

$25,000.00


COST

USD 150 / monthly

Get Started

Learn More

86422252 8f48 4ff8 83d2 83943ca53099

The performance shown above is hypothetical in that the chart represents returns in a model account. The model account rises or falls by the average single contract profit and loss achieved by clients trading actual money pursuant to the listed system’s trading signals on the appropriate dates (client fills), or if no actual client profit or loss available – by the hypothetical single contract profit and loss of trades generated by the system’s trading signals on that day in real time (real‐time) less slippage, or if no real time profit or loss available – by the hypothetical single contract profit and loss of trades generated by running the system logic backwards on back adjusted data. Please read full disclaimer HERE.
Would you like to receive daily support & resistance levels?
Yes
S
No
S

Daily Levels for September 23rd 2024

5f2ead23 5c67 4d34 94a9 f65f637a95b1


Trading Reports for Next Week

435212a9 6b73 4c73 a2f0 fcb1ef3233f7

bf9b3e0d 9c23 44e8 980c a8c01bfbe2cf

Trading Reports for Next Week

First Notice (FN), Last trading (LT) Days for the Week:
174942e6 4ea7 461f aa6d db529188220c

Improve Your Trading Skills

Get access to proprietary indicators and trading methods, consult with an experienced broker at 1-800-454-9572.

Explore trading methods. Register Here

* This is not a solicitation of any order to buy or sell, but a current market view provided by Cannon Trading Inc. Any statement of facts here in contained are derived from sources believed to be reliable, but are not guaranteed as to accuracy, nor they purport to be complete. No responsibility is assumed with respect to any such statement or with respect to any expression of opinion herein contained. Readers are urged to exercise their own judgement in trading.

GDP Tomorrow, Earnings Season in Full Play  + Levels for April 25th

Get Real Time updates and more by joining our Private Facebook Group!
Subscribe to our YouTube Channel


C30


A few tips for tomorrow:

  • If you are trading stock index futures, note price action has been VERY choppy during the day session as most earnings come out after the close…
  • Coffee and Coca volatility is as high as I have seen in recent months. Large intraday and overnight moves in both, as much as +/- 8% per day!
  • We have GDP and home sales tomorrow.
  • Big pullback in both silver and gold and the key question is: Was this profit taking/ deflation of geo political fear and GOOD entry to the long side? OR…is this the near term top for both markets??
  • Corn daily chart for your review below.

91d5fe9f befc 4c02 b5d6 4fe775ba7b0e


stars

e35cb555 9ff3 4f00 9fe8 0655b28fbd90

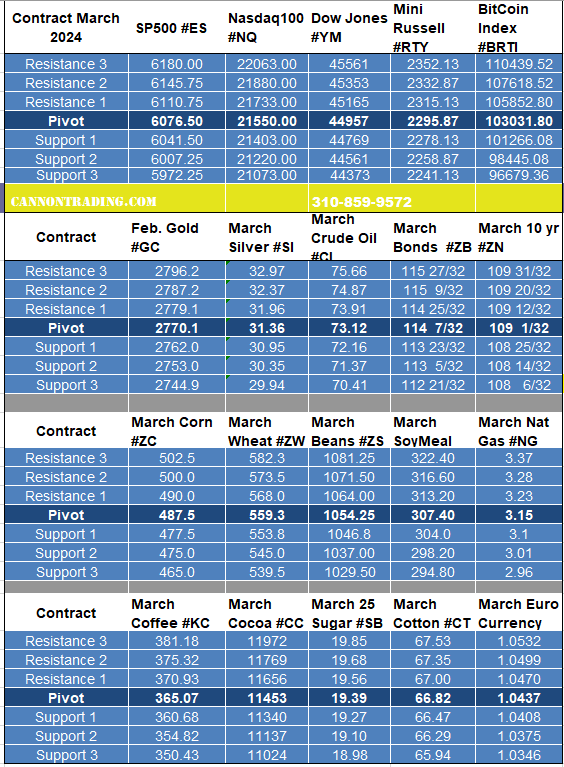
Daily Levels for April 25th, 2024

c966fcd9 e95b 47a3 a4d4 aa6f33599e0a

thumbnail?url=http%3A%2F%2Fi.ytimg.com%2Fvi%2FJnHAMUGdNoM%2Fhqdefault

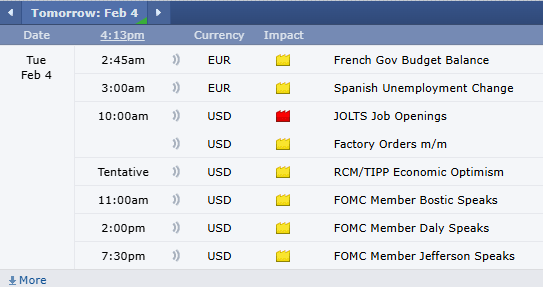
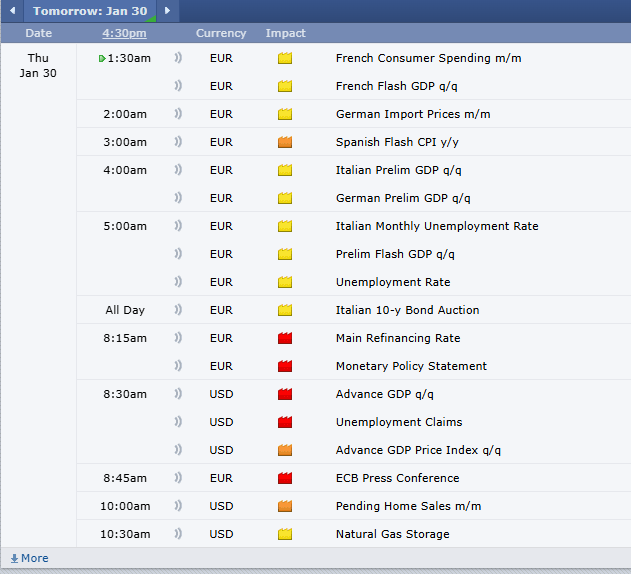
Economic Reports
provided by: ForexFactory.com
All times are Eastern Time ( New York)
7d0dfe51 9084 4e90 9e70 216bff610617

Improve Your Trading Skills

Get access to proprietary indicators and trading methods, consult with an experienced broker at 1-800-454-9572.

Explore trading methods. Register Here

3b644da2 2bee 4d39 8d98 5208a20bec39

* This is not a solicitation of any order to buy or sell, but a current market view provided by Cannon Trading Inc. Any statement of facts here in contained are derived from sources believed to be reliable, but are not guaranteed as to accuracy, nor they purport to be complete. No responsibility is assumed with respect to any such statement or with respect to any expression of opinion herein contained. Readers are urged to exercise their own judgement in trading.

Coffee Outlook, Beige Book and Crude Oil Numbers + Levels for April 17th

Get Real Time updates and more by joining our Private Facebook Group!
Subscribe to our YouTube Channel


C33


Powell spoke and stock index futures traded in a volatile, zig zag type of trading most of the day unable to break one way or the other and closing near the unchange.

On the daily chart, both the SP and NASDAQ are noticing more pressure to the downside.

One of the keys for day Traders is to try and establish early on what type of day trading environment they are in.

Is this going to be a trend day it is this going to be a choppy low volatility trading day? is the day unfolding has a potential to be a volatile two-sided type of trading day?

Being aware of the top of trading day that is unfolding in front of you can help you decide which strategies to apply on that trading day.

Knowing what reports are coming out. the general direction of the long term charts can help you.

Different strategies will work better in different type of trading environments.

On a different note, softs, i.e. Cocoa, cotton, Coffee , Sugar, OJ are experiencing much higher volatility than historical norms. Cocoa just dropped close to 8% today after trading above the historical mark of $100 per metric ton.

below you will see a daily chart of Coffee futures and possible future direction.


62d19d5f caa4 41f4 9c2e dacb47995f39


stars

e35cb555 9ff3 4f00 9fe8 0655b28fbd90

Daily Levels for April 17th, 2024

535aeb7d 56cc 4a29 baec 89cf769d0efe

thumbnail?url=http%3A%2F%2Fi.ytimg.com%2Fvi%2FJnHAMUGdNoM%2Fhqdefault

Economic Reports
provided by: ForexFactory.com
All times are Eastern Time ( New York)
611bf28a 191a 4e89 bb29 ea18ac3b07a0

Improve Your Trading Skills

Get access to proprietary indicators and trading methods, consult with an experienced broker at 1-800-454-9572.

Explore trading methods. Register Here

3b644da2 2bee 4d39 8d98 5208a20bec39

* This is not a solicitation of any order to buy or sell, but a current market view provided by Cannon Trading Inc. Any statement of facts here in contained are derived from sources believed to be reliable, but are not guaranteed as to accuracy, nor they purport to be complete. No responsibility is assumed with respect to any such statement or with respect to any expression of opinion herein contained. Readers are urged to exercise their own judgement in trading.

How Important is Hedging for Farmers? + Levels for April 16th

Get Real Time updates and more by joining our Private Facebook Group!
Subscribe to our YouTube Channel


C42


This week we will see a number of fed speakers,

Tomorrow

Live @ 12:15CDT Link to Discussion With Jerome Powell we are providing this link for those that will watch the market and listen simultaneously


A bit of a departure from the usual Monday blog bites. The planting season in the northern hemisphere is under way so a quick review of the importance of Hedging follows:

How Important is Hedging for Farmers?

For farmers, especially those involved in producing commodities like wheat, corn, soybeans, and livestock, the prices of these products can fluctuate significantly due to various factors such as weather conditions, global demand, geopolitical events, and market speculation. These fluctuations can directly impact a farmer’s profitability and financial stability. Here’s why hedging is so important:

  • Price Stability: Futures trading allows farmers to lock in prices for their produce or livestock at predetermined levels, providing them with a sense of stability and predictability in their revenue streams.
  • Risk Management: By hedging, farmers can protect themselves against adverse price movements. For example, if a farmer expects the price of corn to decrease before their harvest, they can take a short position in corn futures to offset potential losses.
  • Budgeting and Planning: Knowing the approximate revenue from their crops or livestock enables farmers to budget effectively, plan future investments, and manage expenses with more confidence.
  • Access to Capital: Having predictable revenue streams through hedging can make it easier for farmers to secure financing from lenders as they demonstrate a more stable financial outlook.
  • Competitive Advantage: Farmers who hedge can often compete more effectively in the market by offering consistent pricing to buyers, thereby securing long-term contracts and relationships.
  • Futures trading serves as a powerful tool for farmers to manage price risk and ensure a more stable financial outlook. By hedging their crops like wheat, corn, soybeans, and livestock, farmers can mitigate the impact of market volatility, plan their budgets effectively, and compete more confidently in the agricultural sector. Understanding and implementing various hedging strategies empower farmers to navigate unpredictable market conditions while safeguarding their profitability.


stars

e35cb555 9ff3 4f00 9fe8 0655b28fbd90

Daily Levels for April 16th, 2024

a238bad2 46e6 4ed7 83ee e36679069fb8

thumbnail?url=http%3A%2F%2Fi.ytimg.com%2Fvi%2FJnHAMUGdNoM%2Fhqdefault

Economic Reports
provided by: ForexFactory.com
All times are Eastern Time ( New York)
96cb8e6d 9394 4713 8637 00f35f70a350

Improve Your Trading Skills

Get access to proprietary indicators and trading methods, consult with an experienced broker at 1-800-454-9572.

Explore trading methods. Register Here

3b644da2 2bee 4d39 8d98 5208a20bec39

* This is not a solicitation of any order to buy or sell, but a current market view provided by Cannon Trading Inc. Any statement of facts here in contained are derived from sources believed to be reliable, but are not guaranteed as to accuracy, nor they purport to be complete. No responsibility is assumed with respect to any such statement or with respect to any expression of opinion herein contained. Readers are urged to exercise their own judgement in trading.

Weekly Newsletter: Understanding Price Banding, May Bean Oil Outlook and Automated Gold System

Get Real Time updates and more by joining our Private Facebook Group!
Subscribe to our YouTube Channel

C27

Cannon Futures Weekly Letter Issue # 1186

In this issue:
  •  Important Notices – FOMC Next Week
  • Trading Resource of the Week – Understanding Price Limits and Banding
  • Hot Market of the Week – May Bean Oil
  • Broker’s Trading System of the Week – Gold Swing System
  • Trading Levels for Next Week
  • Trading Reports for Next Week


Important Notices –

  • FOMC Meeting next week. Announcement on Wednesday.
  • Light data most of the week. Housing sales
  • Very few earnings
  • June is front month for indices, currencies and financials.: M = June
  • USA is on daylight savings time – most international countries have NOT changed yet.


Trading Resource of the Week : What are Price Limits and Price Banding? by CMEgroup.com

As a trader, you want to know that there are mechanisms in place to ensure an orderly market. A regulated marketplace like CME Group provides this order by setting price limits and price banding.
Price Limits
Price limits are the maximum price range permitted for a futures contract in each trading session. These price limits are measured in ticks and vary from product to product. When markets hit the price limit, different actions occur depending on the product being traded. Some markets may temporarily halt until price limits can be expanded or trading may be stopped for the day based on regulatory rules. Different futures contracts will have different price limit rules; i.e. Equity Index futures have different rules than Agricultural futures.
Example
Equity Indexes futures have a three level expansion: 7%, 13% and 20% to the downside, and a 7% limit up and down in overnight trading.
When price reaches any of those levels the market will go limit up or limit down.
Calculating Price Limits
Price limits are re-calculated daily and remain in effect for all trading days except in certain physically-deliverable markets, where price limits are lifted prior to expiration so that futures prices are not prevented from converging on prices for the underlying commodity.
Typically, Agricultural futures will go limit up or down most often compared to Equity Index futures which very rarely if ever go limit up or down. When trading a specific product, it is important to be aware of price limits and the mechanisms that occur when limits are hit. Traders also know that it is possible for limits to be reached for more than one session in a row, however the expansion of limit thresholds over the last few years have reduced this occurrence.
Price Banding
Price banding is a similar mechanism which subjects all orders to price validation and rejects orders outside the given band to maintain orderly markets. Bands are calculated dynamically for each product based on the last price, plus or minus a fixed band value. Thus, if markets quickly move in one direction, the price bands dynamically adjust to accommodate new trading ranges.
Conclusion
The rules for each market can be found on cmegroup.com.
It is important to note that traders can place trades outside the daily price limits. These trades will be executed when price limits and price bands move within the specified range. So, traders still have the ability to place good-til-canceled or good-til-date orders inside and outside daily price limits.
In the last few years there are fewer and fewer times that markets will actually go limit up or down, but it is important to be aware of these pricing rules when you trade.
efa302e7 662d 4483 85eb 5655e4b45680


stars

3b644da2 2bee 4d39 8d98 5208a20bec39


  • Hot Market of the Week – May Bean Oil
Hot market of the week is provided by QT Market Center, A Swiss army knife charting package that’s not just for Hedgers, Cooperatives and Farmers alike but also for Spread traders, Swing traders and shorter time frame application for intraday traders with a unique proprietary indicator that can be applied to your specific trading needs.
May Bean Oil
The rally in May soybean oil accelerated to its second upside PriceCount objective and now the chart is correcting. At this point, IF you can resume the rally with new sustained highs, the third count would project a possible run to the 50.87 area.
PriceCounts – Not about where we’ve been , but where we might be going next!
5bd46875 4f13 4f46 8290 888342486818
The PriceCount study is a tool that can help to project the distance of a move in price. The counts are not intended to be an ‘exact’ science but rather offer a target area for the four objectives which are based off the first leg of a move with each subsequent count having a smaller percentage of being achieved. It is normal for the chart to react by correcting or consolidating at an objective and then either resuming its move or reversing trend. Best utilized in conjunction with other technical tools, PriceCounts offer one more way to analyze charts and help to manage your positions and risk. Learn more at www.qtchartoftheday.com
Trading in futures, options, securities, derivatives or OTC products entails significant risks which must be understood prior to trading and may not be appropriate for all investors. Past performance of actual trades or strategies is not necessarily indicative of future results.
  • Broker’s Trading System of the Week

With algorithmic trading systems becoming more prevalent in portfolio diversification, the following system has been selected as the broker’s choice for this month.
Spartan Gold
PRODUCT
SYSTEM TYPE
Swing
COST
USD 75 / monthly
Recommended Cannon Trading Starting Capital
$20,000
846f5ed4 d467 4de2 9c1d 75acf0c4f4af
The performance shown above is hypothetical in that the chart represents returns in a model account. The model account rises or falls by the average single contract profit and loss achieved by clients trading actual money pursuant to the listed system’s trading signals on the appropriate dates (client fills), or if no actual client profit or loss available – by the hypothetical single contract profit and loss of trades generated by the system’s trading signals on that day in real time (real‐time) less slippage, or if no real time profit or loss available – by the hypothetical single contract profit and loss of trades generated by running the system logic backwards on back adjusted data. Please read full disclaimer HERE.
Would you like to receive daily support & resistance levels?
Yes
S
No
S


Daily Levels for March 18th 2024

b6a2bf3a a499 4edd 8d8e e4d3d22769b4

Trading Reports for Next Week

58d4627d b4e3 4117 a10c 1ddf826463a9
First Notice (FN), Last trading (LT) Days for the Week:

Improve Your Trading Skills

Get access to proprietary indicators and trading methods, consult with an experienced broker at 1-800-454-9572.

Explore trading methods. Register Here

871e501d 3a1d 4e83 8ee9 a2be76e7992f

* This is not a solicitation of any order to buy or sell, but a current market view provided by Cannon Trading Inc. Any statement of facts here in contained are derived from sources believed to be reliable, but are not guaranteed as to accuracy, nor they purport to be complete. No responsibility is assumed with respect to any such statement or with respect to any expression of opinion herein contained. Readers are urged to exercise their own judgement in trading.

Weekly Newsletter: Understanding Open Interest, May Wheat Outlook and Automated System of the Week

Get Real Time updates and more by joining our Private Facebook Group!
Subscribe to our YouTube Channel

C23

Cannon Futures Weekly Letter Issue # 1185

In this issue:
  • Important Notices – Change Your Clocks!
  • Trading Resource of the Week – Trade Alerts Via Email/Text
  • Hot Market of the Week – May Wheat
  • Broker’s Trading System of the Week – MidCap SP Swing System
  • Trading Levels for Next Week
  • Trading Reports for Next Week


Important Notices –

  • FED Blackout Period Begins Sat. 9th, lasts for 9 business days
  • A smattering of earnings. Mostly Microcap to Midcap: Adobe Reports
  • Tuesday and Thursday Data: CPI, Jobless claim , Retail sales and PPI
  • Begin Trading June indices if you haven’t already: M = June
  • Spring your Clocks forward for those countries that subscribe to Daylight Savings. 


Trading Resource of the Week : Understanding Open Interest by CMEgroup.com

Understanding Open Interest
Open interest is the total number of futures contracts held by market participants at the end of the trading day. It is used as an indicator to determine market sentiment and the strength behind price trends.
Unlike the total issued shares of a company, which typically remain constant, the number of outstanding futures contracts varies from day to day.
Open interest is calculated by adding all the contracts from opened trades and subtracting the contracts when a trade is closed.
For example, Sharon, Cynthia and Kurt are trading the same futures contract. If Sharon buys one contract to enter a long trade, open interest increases by one. Cynthia also goes long and buys six contracts, thereby increasing open interest to seven. If Kurt decides to short the market and sells three contracts, open interest again increases to 10.
Open interest would remain at 10 until the traders exit their positions, at which point open interest declines. For example, open interest declines to nine when Sharon sells one contract. When Kurt decides to exit his position, he buys back his three contracts and brings open interest down to six. At this point, until Cynthia decides to sell her six contracts, open interest will remain constant at six.
Open interest and volume are related concepts, one key difference is that volume counts all contracts that have been traded, while open interest is a total of contracts that remain open in the market.
Traders can think of open interest as the cash flowing to the market. As open interest increases, more money is moving into the futures contract and as open interest declines money is moving out of the futures contract.
CME Group products with the largest open interest include Eurodollars, Treasuries and stock index futures.
Open Interest Analysis
Analysts typically use open interest to confirm the strength of a trend. Increasing open interest is typically a confirmation of the trend whereas decreasing open interest can be a signal that the trend is losing strength.
The idea is that traders are supporting the trend by entering the market that increases the open interest. As traders lose faith in the trend they exit the market and open interest declines.
Open interest data is published at the end of each day. Additionally, every Friday afternoon, the CFTC publishes a report called the Commitment of Traders.
This report details open interest from different classes of market participants and whether they are holding a long or short position. This breakdown offers valuable insights into what producers, merchants, processors, users, swap dealers and money managers are doing in the market for a futures contract.
Open interest is one variable that many futures traders use in their analysis of the markets used in conjunction with other analysis to support trade decisions. Large changes in open interest can be an indicator when certain participants are entering or leaving the market and may give clues to market direction.
ad83516b 9c21 4cd5 96b3 4bfd13f3e278


stars

3b644da2 2bee 4d39 8d98 5208a20bec39


  • Hot Market of the Week – May Wheat
Hot market of the week is provided by QT Market Center, A Swiss army knife charting package that’s not just for Hedgers, Cooperatives and Farmers alike but also for Spread traders, Swing traders and shorter time frame application for intraday traders with a unique proprietary indicator that can be applied to your specific trading needs.
May Wheat
May wheat in Chicago broke down into a new contract low yesterday where the chart satisfied its third downside PriceCount objective. It would be normal to get a near term reaction from this level in the form of a consolidation or corrective trade, at least. At this point, IF you can sustain further weakness, we are left with the low percentage fourth objective to aim for around $4.20.
PriceCounts – Not about where we’ve been , but where we might be going next!
381b2d7e 1da0 45e7 a8d0 0539ddb9ef76
The PriceCount study is a tool that can help to project the distance of a move in price. The counts are not intended to be an ‘exact’ science but rather offer a target area for the four objectives which are based off the first leg of a move with each subsequent count having a smaller percentage of being achieved. It is normal for the chart to react by correcting or consolidating at an objective and then either resuming its move or reversing trend. Best utilized in conjunction with other technical tools, PriceCounts offer one more way to analyze charts and help to manage your positions and risk. Learn more at www.qtchartoftheday.com
Trading in futures, options, securities, derivatives or OTC products entails significant risks which must be understood prior to trading and may not be appropriate for all investors. Past performance of actual trades or strategies is not necessarily indicative of future results.
  • Broker’s Trading System of the Week

With algorithmic trading systems becoming more prevalent in portfolio diversification, the following system has been selected as the broker’s choice for this month.
PRODUCT
MidCap SP
SYSTEM TYPE
Swing
COST
USD 110 / monthly
Recommended Cannon Trading Starting Capital
$50,000
41a6ba2d f1d1 4d2f b583 dbce27945e46
The performance shown above is hypothetical in that the chart represents returns in a model account. The model account rises or falls by the average single contract profit and loss achieved by clients trading actual money pursuant to the listed system’s trading signals on the appropriate dates (client fills), or if no actual client profit or loss available – by the hypothetical single contract profit and loss of trades generated by the system’s trading signals on that day in real time (real‐time) less slippage, or if no real time profit or loss available – by the hypothetical single contract profit and loss of trades generated by running the system logic backwards on back adjusted data. Please read full disclaimer HERE.
Would you like to receive daily support & resistance levels?
Yes
S
No
S


Daily Levels for March 11th 2024

e931a058 9249 4af7 98b5 3cf281d77937

Trading Reports for Next Week

5f09951a c6ff 4d65 bdc6 214abc40d6eb
First Notice (FN), Last trading (LT) Days for the Week:

Improve Your Trading Skills

Get access to proprietary indicators and trading methods, consult with an experienced broker at 1-800-454-9572.

Explore trading methods. Register Here

5f0f93cb 90d8 4493 8191 9bfde18d550c

* This is not a solicitation of any order to buy or sell, but a current market view provided by Cannon Trading Inc. Any statement of facts here in contained are derived from sources believed to be reliable, but are not guaranteed as to accuracy, nor they purport to be complete. No responsibility is assumed with respect to any such statement or with respect to any expression of opinion herein contained. Readers are urged to exercise their own judgement in trading.

Weekly Newsletter: Trading Alerts Via text! , 1099s and levels for Feb. 12th

Get Real Time updates and more by joining our Private Facebook Group!
Subscribe to our YouTube Channel

Abstract financial candlestick chart with line graph and stock numbers in Double exposure style background

Cannon Futures Weekly Letter Issue # 1181

In this issue:
  • Important Notices –  1099 Forms, Valentines Day, Chinese New year
  • Trading Resource of the Week – Trade Alerts via Text/email
  • Hot Market of the Week – March SoyMeal
  • Broker’s Trading System of the Week – Unleaded Gasoline Swing Trading System
  • Trading Levels for Next Week
  • Trading Reports for Next Week


Important Notices –

    • 1099 forms will be generated for all futures trading accounts held by US clients that placed any trades during the 2023 calendar year. Traders should expect to receive their 1099 forms via mail, email or through their portal in early February.
    1099 forms will be provided directly from the FCM to the client.
Important Events Coming Up:
  • Chinese New Year
  • CPI
  • Valentines day
  • Earnings
  • Fed Speakers
  • More Data including PPI


Trading Resource of the Week : Real Time Email Alerts Directly to your Phone!

Self-Study Guide to Hedging with Grain and Oilseed Futures and Options. Regardless if you are a farmer, rancher or simply looking to trade grains and livestock futures, this guide will help you understand the ins and outs of trading and hedging using futures and options.
  • You will receive an email each time there is an entry or exit in a simple language along with the current price for that specific market.
  • A licensed series 3 broker at your fingertips
  • Email alerts available to US and Canada and Int’l clients
  • Alerts available for: Stock Indices, Grains, Metals, Rates, Currencies, Meats & Softs
  • Open an account* and receive the Trade Alerts free for 3 months ($357 value)
  • See an example of a recent trade alert for Coffee Futures in the image below


1cdfd658 2c3a 45f2 8cac f3f8126057e9


stars

3b644da2 2bee 4d39 8d98 5208a20bec39


  • Hot Market of the Week – March Soymeal
Hot market of the week is provided by QT Market Center, A Swiss army knife charting package that’s not just for Hedgers, Cooperatives and Farmers alike but also for Spread traders, Swing traders and shorter time frame application for intraday traders with a unique proprietary indicator that can be applied to your specific trading needs.
March Meal
March soymeal resumed its slide where the chart is approaching its third downside PriceCount objective in the $340 area. It would be normal to get a reaction after completing the objective in the form of a near term consolidation or corrective trade, at least. The low percentage fourth count to $231 is not shown here for relevancy but the weekly chart shows significant downside potential remains on a longer term basis.
PriceCounts – Not about where we’ve been , but where we might be going next!
518b9594 5976 414d 9b1b 85573720c2e0
The PriceCount study is a tool that can help to project the distance of a move in price. The counts are not intended to be an ‘exact’ science but rather offer a target area for the four objectives which are based off the first leg of a move with each subsequent count having a smaller percentage of being achieved. It is normal for the chart to react by correcting or consolidating at an objective and then either resuming its move or reversing trend. Best utilized in conjunction with other technical tools, PriceCounts offer one more way to analyze charts and help to manage your positions and risk. Learn more at www.qtchartoftheday.com
Trading in futures, options, securities, derivatives or OTC products entails significant risks which must be understood prior to trading and may not be appropriate for all investors. Past performance of actual trades or strategies is not necessarily indicative of future results.
  • Broker’s Trading System of the Week

With algorithmic trading systems becoming more prevalent in portfolio diversification, the following system has been selected as the broker’s choice for this month.
PRODUCT
SYSTEM TYPE
Swing
COST
USD 160 / monthly
Recommended Cannon Trading Starting Capital
$20,000
4cad38e6 221c 48e1 89cd bdb56306c583
The performance shown above is hypothetical in that the chart represents returns in a model account. The model account rises or falls by the average single contract profit and loss achieved by clients trading actual money pursuant to the listed system’s trading signals on the appropriate dates (client fills), or if no actual client profit or loss available – by the hypothetical single contract profit and loss of trades generated by the system’s trading signals on that day in real time (real‐time) less slippage, or if no real time profit or loss available – by the hypothetical single contract profit and loss of trades generated by running the system logic backwards on back adjusted data. Please read full disclaimer HERE.
Would you like to receive daily support & resistance levels?
Yes
S
No
S


Daily Levels for February 5th 2024

10d11613 d5ca 43cf 9695 562ec2d7cf28

Trading Reports for Next Week

18aabfe9 1021 419a b50e a39a26af08fa
First Notice (FN), Last trading (LT) Days for the Week:
08f73578 cef1 4260 a3b2 3e334caded13

Improve Your Trading Skills

Get access to proprietary indicators and trading methods, consult with an experienced broker at 1-800-454-9572.

Explore trading methods. Register Here

* This is not a solicitation of any order to buy or sell, but a current market view provided by Cannon Trading Inc. Any statement of facts here in contained are derived from sources believed to be reliable, but are not guaranteed as to accuracy, nor they purport to be complete. No responsibility is assumed with respect to any such statement or with respect to any expression of opinion herein contained. Readers are urged to exercise their own judgement in trading.

High Volatility + Futures Trading Levels for Oct. 13th

Get Real Time updates and more on our private FB group!

What you need to know before trading futures tomorrow – October 13th 2023

by Ilan Levy-Mayer, VP

  1. War in Israel and news coming from the region can create sharp fast moves in variety of markets like gold, crude oil, stocks and bonds.
  2. Univ. of Michigan prelim report is tomorrow.
  3. Soybeans broke to the upside in what seems to be a temporary bottom (see daily chart below)
  4. Bonds resumed downside selling after today’s bond action
  5. Fed member Harker is speaking at 9 Am central time


Plan your trade and trade your plan.

12dd0a1b e261 4582 8b32 01cc7a345824

Trading Futures, Options on Futures, and retail off-exchange foreign currency transactions involves substantial risk of loss and is not suitable for all investors.  You should carefully consider whether trading is suitable for you in light of your circumstances, knowledge, and financial resources. You may lose all or more of your initial investment. Opinions, market data, and recommendations are subject to change at any time when it comes to Futures Trading.

3b644da2 2bee 4d39 8d98 5208a20bec39

Futures Trading Levels

10-13-2023

#ES, #NQ, #YM, #RTY, #XBT, #GC, #SI, #CL, #ZB, #6E, #ZC, #ZW, #ZS, #ZM, #NG


Download your FREE copy of Order Flow Essentials!

b0ba1776 c0cd 4536 92c1 eef6595d7173


Improve Your Trading Skills

Get access to proprietary indicators and trading methods, consult with an experienced broker
 1-800-454-9572 Explore trading methods. Register Here


Economic Reports, Source: 

Forexfactory.com


d2d61803 a952 44f4 9149 91e452464f25

This is not a solicitation of any order to buy or sell, but a current market view provided by Cannon Trading Inc. Any statement of facts here in contained are derived from sources believed to be reliable, but are not guaranteed as to accuracy, nor they purport to be complete. No responsibility is assumed with respect to any such statement or with respect to any expression of opinion herein contained. Readers are urged to exercise their own judgement in trading.