Different grains are traded on the Index, as commodities. Wheat, corn, soybeans, canola and soybean meal are just a few examples. They can be either a short-hedge or a long-hedge. One of the most traded grain futures is corn.
Basically, buying or selling these forms of futures enables the buyers and sellers to lock in prices of the specified grain today for the items that are to be delivered in the future. Therefore, all those who are interested in grains futures must track the performance of the grain on the demand and supply graph as well as its performance on the index. Though it is not tough to understand grains futures, the calculation of risk and returns is something that an average person may leave for an expert to do.
We at Cannon Trading are there to help you to not just understand the markets well, but to act as your personal advisors when it comes to trading futures. And, that’s something that applies for grain futures as well. However, information and awareness come before anything else. That is why, we want you to read through all of these blogs and articles carefully before you decide whether you want to trade grain futures or not.
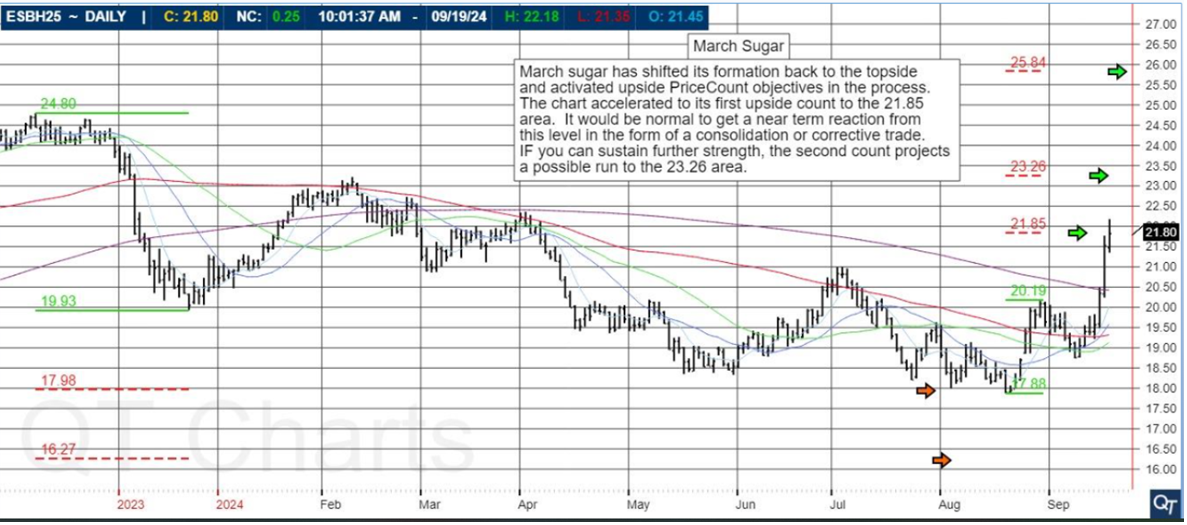
Hot market of the week is provided by QT Market Center, A swiss army knife charting package that’s not just for Hedgers, Cooperatives and Farmers alike but also for Spread traders, Swing traders and shorter time frame application for intraday traders with a unique proprietary indicator that can be applied to your specific trading needs.
December soybean oil slowed its rally last months against the fall high and corrected. Now, the chart has recovered and is poised for another challenge of the fall and July highs. If we can break out to the upside with new sustained highs, we have a first upside PriceCount projection to the 68.51 area to aim for.
PriceCounts – Not about where we’ve been , but where we might be going next!
The PriceCount study is a tool that can help to project the distance of a move in price. The counts are not intended to be an ‘exact’ science but rather offer a target area for the four objectives which are based off the first leg of a move with each subsequent count having a smaller percentage of being achieved. It is normal for the chart to react by correcting or consolidating at an objective and then either resuming its move or reversing trend. Best utilized in conjunction with other technical tools, PriceCounts offer one more way to analyze charts and help to manage your positions and risk. Learn more at www.qtchartoftheday.com
Trading in futures, options, securities, derivatives or OTC products entails significant risks which must be understood prior to trading and may not be appropriate for all investors. Past performance of actual trades or strategies is not necessarily indicative of future results.
Broker’s Trading System of the Week
Are you interested in seeing how two different intraday trading systems perform in real time, live trading?
Cannon Trading offers you weekly updates on the results of these systems, which trade the MNQ (micro mini Nasdaq) and the ES (mini SP) respectively.
You can compare and contrast their strategies, risks, and returns, and decide which one suits your trading goals better. All you need is a minimum account size of $10,000 for the MNQ system and $25,000 for the ES system.
Questions about the markets? trading? platforms? technology? trading systems? Get answers with a complimentary, confidential consultation with a Cannon Trading Company series 3 broker.
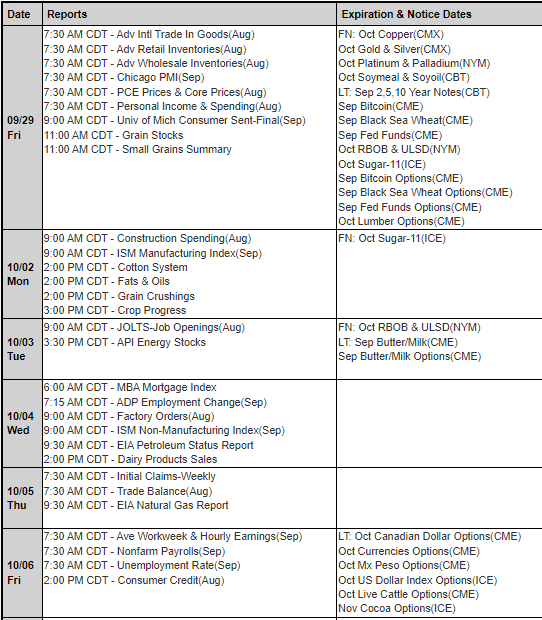
First Notice (FN), Last trading (LT) Days for the Week: www.mrci.com
This is not a solicitation of any order to buy or sell, but a current market view provided by Cannon Trading Inc. Any statement of facts herein contained are derived from sources believed to be reliable but are not guaranteed as to accuracy, nor they purport to be complete. No responsibility is assumed with respect to any such statement or with respect to any expression of opinion herein contained. Readers are urged to exercise their own judgment in trading.
Good Trading!
Trading Futures, Options on Futures, and retail off-exchange foreign currency transactions involves substantial risk of loss and is not suitable for all investors. You should carefully consider whether trading is suitable for you in light of your circumstances, knowledge, and financial resources. You may lose all or more of your initial investment. Opinions, market data, and recommendations are subject to change at any time.
Rest of the Trading Week, by Mark O’Brien, Senior Broker
General:
The answer is: Germany, Denmark, Netherlands, Sweden, Norway, Switzerland, Luxembourg, Singapore and Australia.
The question is: name the remaining countries whose credit is rated AAA by all three ratings companies – S&P Global, Fitch and Moody’s – after Fitch downgraded the United States’ debt rating from its top-tier AAA, down to AA+.
Among the contributing factors leading to the downgrade, Fitch cited, “the expected fiscal deterioration over the next three years, a high and growing general government debt burden, and the erosion of governance . . . that has manifested in repeated debt limit standoffs and last-minute resolutions.”
Remember in 2011, even though at that time a debt-limit deal was reached, S&P Global lowered the U.S.’s credit rating from AAA down to AA+ and it has not recovered since.
Canada is rated AAA by two of the ratings companies.
Stock Indexes:
Probably not surprisingly, as of this typing, stock indexes reacted negatively to the ratings news with the E-mini Dow Jones losing more than 300 points, roughly a 2% haircut. The E-mini Nasdaq is off ±325 points, a similar 2% correction.
Energy:
As the stock market foundered, crude oil felt weak in the knees as well and by mid-session, the September contract had sold off $3.00 per barrel from its Sunday opening. This despite today’s EIA crude oil stocks report showing a 17 million barrel reduction in U.S. crude stocks; the largest drop in inventories since 1982.
Grains:
After trading within 13 cents of its April 2022 highs last week, November soybeans factored in an expected conga line of wet weather fronts moving broadly over the U.S. Midwest and sold off ±$1.00 down to ±$13.25/bushel, a $5,000 per contract move, the bulk of which comprised just three trading sessions. Estimates for this year’s crop are a virtual wild card given the approach of August, its most critical growing period, so expect volatile price movement throughout.
Trading Futures, Options on Futures, and retail off-exchange foreign currency transactions involves substantial risk of loss and is not suitable for all investors. You should carefully consider whether trading is suitable for you in light of your circumstances, knowledge, and financial resources. You may lose all or more of your initial investment. Opinions, market data, and recommendations are subject to change at any time when it comes to Futures Trading.
This is not a solicitation of any order to buy or sell, but a current market view provided by Cannon Trading Inc. Any statement of facts here in contained are derived from sources believed to be reliable, but are not guaranteed as to accuracy, nor they purport to be complete. No responsibility is assumed with respect to any such statement or with respect to any expression of opinion herein contained. Readers are urged to exercise their own judgement in trading.
As expected, today Federal Reserve officials raised interest rates by 25 basis points. This puts the Federal Funds Rate – the central bank’s key borrowing rate – at a range of 5.25 to 5.50. This is the highest level at which Fed Funds have been set since 2001. The vote was unanimous among the Fed governors to take this latest step in the bank’s efforts to rein in inflation and cool the economy. This increase is the latest in the fed’s months-long effort to rachet up borrowing costs resulting in a reduction in demand for goods, services and labor in the economy.
WTI crude oil has been repeatedly plumbing its lows of the year between $67 and $70 per barrel the entire second quarter. Yesterday it traded within 10 cents of $80.00 per barrel intraday (basis Sept.) to 3-month highs – a solid ±$12 per barrel move this month; a ±$12,000 per contract move. Analysts largely attribute the increase to recently announced output cuts by Saudi Arabia and Russia.
September soybeans traded up 21 ¼ cents today to this crop year’s and life-of-contract highs, closing at $15.56 ½ per bushel. The current rally off it’s late-May lows just above $12.00 per bushel (a ±$17,500 per contract move) reflect the continued sentiment that U.S. soybean crop conditions will continue to deteriorate as harvest approaches.
Trading Futures, Options on Futures, and retail off-exchange foreign currency transactions involves substantial risk of loss and is not suitable for all investors. You should carefully consider whether trading is suitable for you in light of your circumstances, knowledge, and financial resources. You may lose all or more of your initial investment. Opinions, market data, and recommendations are subject to change at any time when it comes to Futures Trading.
This is not a solicitation of any order to buy or sell, but a current market view provided by Cannon Trading Inc. Any statement of facts here in contained are derived from sources believed to be reliable, but are not guaranteed as to accuracy, nor they purport to be complete. No responsibility is assumed with respect to any such statement or with respect to any expression of opinion herein contained. Readers are urged to exercise their own judgement in trading.
Sign up for the Cannon Trading via clearing partner StoneX + CME Group Equity Index Futures Trading Challenge for your chance to sizzle the competition this summer – Trade Micro, E-mini, and Standard size contracts on the S&P, NASDAQ, Russell, and Dow Jones in a risk-free environment while competing with fe11ow traders for a cash prize•.
Use the Cannon Futures Trader Simulated Trading Environment and a virtual account of $100,000 to trade CME Group Equity Index futures. Increase your balance as much as possible between July 9th and July 21st for your chance to win!
Trading Futures, Options on Futures, and retail off-exchange foreign currency transactions involves substantial risk of loss and is not suitable for all investors. You should carefully consider whether trading is suitable for you in light of your circumstances, knowledge, and financial resources. You may lose all or more of your initial investment. Opinions, market data, and recommendations are subject to change at any time
Trading in futures, options, securities, derivatives or OTC products entails significant risks which must be understood prior to trading and may not be appropriate for all investors. Past performance of actual trades or strategies is not necessarily indicative of future results.
Hot market of the week is provided by QT Market Center, A swiss army knife charting package that’s not just for Hedgers, Cooperatives and Farmers alike but also for Spread traders, Swing traders and shorter time frame application for intraday traders with a unique proprietary indicator that can be applied to your specific trading needs.
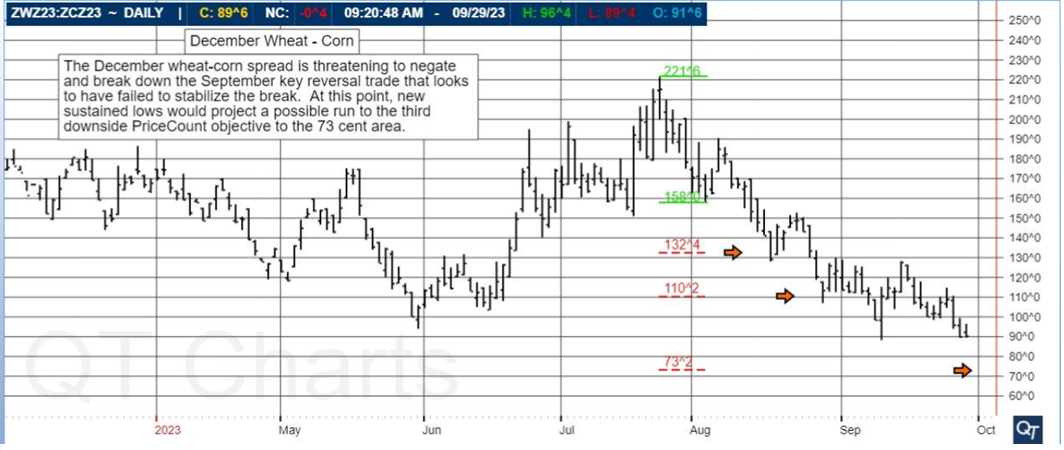
The September Kansas City- Chicago wheat spread completed its second downside PriceCount objective and responded with a key reversal and corrective trade. At this point, IF the chart can resume its break with new sustained laws, the third count would project a possible run to the 43 Cent area.
PriceCounts – Not about where we’ve been , but where we might be going next!
The PriceCount study is a tool that can help to project the distance of a move in price. The counts are not intended to be an ‘exact’ science but rather offer a target area for the four objectives which are based off the first leg of a move with each subsequent count having a smaller percentage of being achieved. It is normal for the chart to react by correcting or consolidating at an objective and then either resuming its move or reversing trend. Best utilized in conjunction with other technical tools, PriceCounts offer one more way to analyze charts and help to manage your positions and risk. Learn more at www.qtchartoftheday.com
Trading in futures, options, securities, derivatives or OTC products entails significant risks which must be understood prior to trading and may not be appropriate for all investors. Past performance of actual trades or strategies is not necessarily indicative of future results.
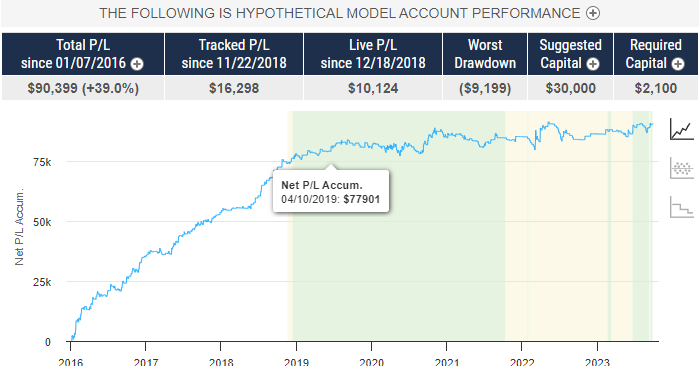
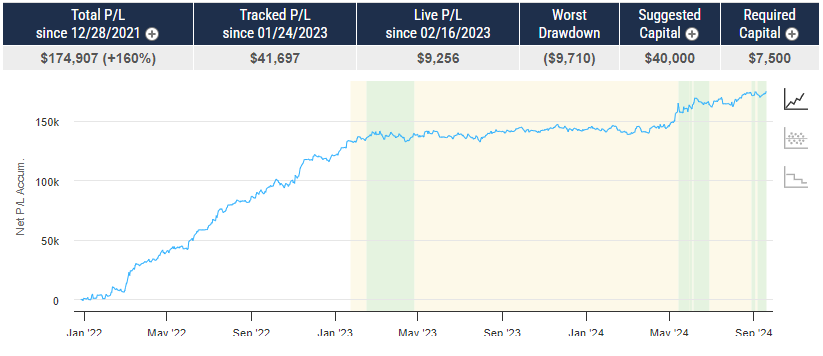
With algorithmic trading systems becoming more prevalent in portfolio diversification, the following system has been selected as the broker’s choice for this month.
The performance shown above is hypothetical in that the chart represents returns in a model account. The model account rises or falls by the average single contract profit and loss achieved by clients trading actual money pursuant to the listed system’s trading signals on the appropriate dates (client fills), or if no actual client profit or loss available – by the hypothetical single contract profit and loss of trades generated by the system’s trading signals on that day in real time (real‐time) less slippage, or if no real time profit or loss available – by the hypothetical single contract profit and loss of trades generated by running the system logic backwards on back adjusted data. Please read full disclaimer HERE.
Questions about the markets? trading? platforms? technology? trading systems? Get answers with a complimentary, confidential consultation with a Cannon Trading Company series 3 broker.
First Notice (FN), Last trading (LT) Days for the Week: www.mrci.com
This is not a solicitation of any order to buy or sell, but a current market view provided by Cannon Trading Inc. Any statement of facts herein contained are derived from sources believed to be reliable but are not guaranteed as to accuracy, nor they purport to be complete. No responsibility is assumed with respect to any such statement or with respect to any expression of opinion herein contained. Readers are urged to exercise their own judgment in trading.
Good Trading!
Trading Futures, Options on Futures, and retail off-exchange foreign currency transactions involves substantial risk of loss and is not suitable for all investors. You should carefully consider whether trading is suitable for you in light of your circumstances, knowledge, and financial resources. You may lose all or more of your initial investment. Opinions, market data, and recommendations are subject to change at any time.
Trading Resource of the Week – Trading 101 Video: Where are my Targets?
Hot Market of the Week – July Oats
Broker’s Trading System of the Week – NEW Crude Oil Trading System
Trading Levels for Next Week
Trading Reports for Next Week
Important Notices – Juneteenth Holiday Hours
Monday, June 19, 2023 US bank will be closed in observance of Juneteenth. There will be no money transactions Wires, ACH, Internal transfer and or currency conversion.
Watch the video below to get an idea on how to use Fibonacci extensions along with candle sticks to project possible price targets.
Try a FREE demo of the platform used to show the charts in this educational article. The platform is FREE and has charts, news, DOM, T&S, Alerts, advanced order entry, options and MUCH MORE!
A Cannon broker will be able to assist, provide feedback and answer any questions.
Hot market of the week is provided by QT Market Center, A swiss army knife charting package that’s not just for Hedgers, Cooperatives and Farmers alike but also for Spread traders, Swing traders and shorter time frame application for intraday traders with a unique proprietary indicator that can be applied to your specific trading needs.
July Oats finally stabilized their slide last month and then activated upside PriceCount objectives on the correction higher. Chart is satisfied its first count to $3.81 where it would be normal to get a near-term reaction in a form of consolidation or corrective trade. If you can sustain for the strength from here, the second count would project the possible run to the $4.10 area
PriceCounts – Not about where we’ve been , but where we might be going next!
The PriceCount study is a tool that can help to project the distance of a move in price. The counts are not intended to be an ‘exact’ science but rather offer a target area for the four objectives which are based off the first leg of a move with each subsequent count having a smaller percentage of being achieved. It is normal for the chart to react by correcting or consolidating at an objective and then either resuming its move or reversing trend. Best utilized in conjunction with other technical tools, PriceCounts offer one more way to analyze charts and help to manage your positions and risk. Learn more at www.qtchartoftheday.com
Trading in futures, options, securities, derivatives or OTC products entails significant risks which must be understood prior to trading and may not be appropriate for all investors. Past performance of actual trades or strategies is not necessarily indicative of future results.
With algorithmic trading systems becoming more prevalent in portfolio diversification, the following system has been selected as the broker’s choice for this month.
The performance shown above is hypothetical in that the chart represents returns in a model account. The model account rises or falls by the average single contract profit and loss achieved by clients trading actual money pursuant to the listed system’s trading signals on the appropriate dates (client fills), or if no actual client profit or loss available – by the hypothetical single contract profit and loss of trades generated by the system’s trading signals on that day in real time (real‐time) less slippage, or if no real time profit or loss available – by the hypothetical single contract profit and loss of trades generated by running the system logic backwards on back adjusted data. Please read full disclaimer HERE.
Questions about the markets? trading? platforms? technology? trading systems? Get answers with a complimentary, confidential consultation with a Cannon Trading Company series 3 broker.
First Notice (FN), Last trading (LT) Days for the Week: www.mrci.com
This is not a solicitation of any order to buy or sell, but a current market view provided by Cannon Trading Inc. Any statement of facts herein contained are derived from sources believed to be reliable but are not guaranteed as to accuracy, nor they purport to be complete. No responsibility is assumed with respect to any such statement or with respect to any expression of opinion herein contained. Readers are urged to exercise their own judgment in trading.
Good Trading!
Trading Futures, Options on Futures, and retail off-exchange foreign currency transactions involves substantial risk of loss and is not suitable for all investors. You should carefully consider whether trading is suitable for you in light of your circumstances, knowledge, and financial resources. You may lose all or more of your initial investment. Opinions, market data, and recommendations are subject to change at any time.
Join our private Facebook group for additional insight into trading and the futures markets!
In this issue:
Important Notices – Win 1 OZ Gold Bar!
Trading Resource of the Week – Why Do Most Future traders lose?
Hot Market of the Week – July Copper
Broker’s Trading System of the Week – Browse Hundreds of “Hands Free” Systems
Trading Levels for Next Week
Trading Reports for Next Week
Important Notices –
Are you ready to go for gold?
Then here is your golden opportunity. CME Group will be launching the Go for Gold Precious Metals Trading Challenge coming this June.
You’ll have the opportunity to practice trading highly liquid Precious Metals products while competing against other traders for the chance to win the grand prize of a 1 oz. bar of gold*.
During the challenge, you’ll explore our suite of precious metals contracts and test-drive strategies in a simulated environment. We’ll send you exclusive, daily education materials on precious metals contracts in order for you to feel prepared to trade and confidently compete against your peers.
Hot market of the week is provided by QT Market Center, A swiss army knife charting package that’s not just for Hedgers, Cooperatives and Farmers alike but also for Spread traders, Swing traders and shorter time frame application for intraday traders with a unique proprietary indicator that can be applied to your specific trading needs.
July copper collapsed to a new low for the move where the chart has met its second downside PriceCount objective. It would be normal to get a near term reaction in the form of a consolidation or corrective trade upon completing the objective. At this point, IF the chart can sustain further weakness, the third count would project a run to the 3.54 area.
PriceCounts – Not about where we’ve been , but where we might be going next!
The PriceCount study is a tool that can help to project the distance of a move in price. The counts are not intended to be an ‘exact’ science but rather offer a target area for the four objectives which are based off the first leg of a move with each subsequent count having a smaller percentage of being achieved. It is normal for the chart to react by correcting or consolidating at an objective and then either resuming its move or reversing trend. Best utilized in conjunction with other technical tools, PriceCounts offer one more way to analyze charts and help to manage your positions and risk. Learn more at www.qtchartoftheday.com
Trading in futures, options, securities, derivatives or OTC products entails significant risks which must be understood prior to trading and may not be appropriate for all investors. Past performance of actual trades or strategies is not necessarily indicative of future results.
Hundreds of “Hands Free” Automated Systems to Choose from!
Are you too busy to trade? Perhaps you’re not confident enough and you’re trading. Maybe you’re looking to the diversify your own trading with algorithmic trading or what we call automated trading. Browse over 500 trading systems. Review back test results, live results, drawdowns, returns and much more!!
Questions about the markets? trading? platforms? technology? trading systems? Get answers with a complimentary, confidential consultation with a Cannon Trading Company series 3 broker.
Trading Levels for Next Week
Daily Levels for May 15th, 2022
Weekly Levels
Trading Reports for Next Week
First Notice (FN), Last trading (LT) Days for the Week:
This is not a solicitation of any order to buy or sell, but a current market view provided by Cannon Trading Inc. Any statement of facts herein contained are derived from sources believed to be reliable but are not guaranteed as to accuracy, nor they purport to be complete. No responsibility is assumed with respect to any such statement or with respect to any expression of opinion herein contained. Readers are urged to exercise their own judgment in trading
Join our private Facebook group for additional insight into trading and the futures markets!
In this issue:
Important Notices – CPI, PPI, Crop Reports is this Week!
Trading Resource of the Week – FREE Trading Psychology Course
Hot Market of the Week – July Bean Meal
Broker’s Trading System of the Week – Browse Hundreds of “Hands Free” Systems
Trading Levels for Next Week
Trading Reports for Next Week
Important Notices
This week we have CPI, PPI and crop report!
Trading Resource of the Week – Get An Edge With the Trading Psychology Course FREE
Trading 102: Commitment of Traders Report – What Lies beneath
Many experienced traders say that the stiffest challenge you’ll face in becoming a futures trader is conquering your own psyche. Why? Because losing is part of trading, and people hate to lose.
In this “Trading Psychology” Course you will learn:
How to examine your patterns and behaviors and recognize when they are holding you back
Maintaining self-confidence as a trader even in the face of inexperience
The mathematical expectation model and how it can decrease your losses
Determining the trading plan that is right for your trading personality
Understanding and using Motivation – Risk – Reward to its full advantage
Hot market of the week is provided by QT Market Center, A swiss army knife charting package that’s not just for Hedgers, Cooperatives and Farmers alike but also for Spread traders, Swing traders and shorter time frame application for intraday traders with a unique proprietary indicator that can be applied to your specific trading needs.
July soybean meal completed its second downside PriceCount objective in March and corrected higher. Now, the chart is threatening to break down where new sustained lows from here would project a run to the third count in the $412 area where it will be normal to see some consolidation price action.
PriceCounts – Not about where we’ve been , but where we might be going next!
The PriceCount study is a tool that can help to project the distance of a move in price. The counts are not intended to be an ‘exact’ science but rather offer a target area for the four objectives which are based off the first leg of a move with each subsequent count having a smaller percentage of being achieved. It is normal for the chart to react by correcting or consolidating at an objective and then either resuming its move or reversing trend. Best utilized in conjunction with other technical tools, PriceCounts offer one more way to analyze charts and help to manage your positions and risk. Learn more at www.qtchartoftheday.com
Trading in futures, options, securities, derivatives or OTC products entails significant risks which must be understood prior to trading and may not be appropriate for all investors. Past performance of actual trades or strategies is not necessarily indicative of future results.
Hundreds of “Hands Free” Automated Systems to Choose from!
Are you too busy to trade? Perhaps you’re not confident enough and you’re trading. Maybe you’re looking to the diversify your own trading with algorithmic trading or what we call automated trading. Browse over 500 trading systems. Review back test results, live results, drawdowns, returns and much more!!
Questions about the markets? trading? platforms? technology? trading systems? Get answers with a complimentary, confidential consultation with a Cannon Trading Company series 3 broker.
This is not a solicitation of any order to buy or sell, but a current market view provided by Cannon Trading Inc. Any statement of facts herein contained are derived from sources believed to be reliable but are not guaranteed as to accuracy, nor they purport to be complete. No responsibility is assumed with respect to any such statement or with respect to any expression of opinion herein contained. Readers are urged to exercise their own judgment in trading
For the USDA prospective plantings report on Friday, the average trade expectation for US soybean plantings is
88.3 million acres, with a range of expectations from 87.4 to 89.6 million. This would be up from 87.5 million last
year. The USDA Outlook Forum had planted area at 87.5 million acres as well.
For the Quarterly Grain Stocks report, US March 1 soybean stocks are expected to come in around 1.728 billion bushels (range 1.600-1.910 billion) versus 1.932 billion last year. Brazil may need to supply up to half of the soybeans that Argentina will import after the worst drought in 100 years devastated its fields and cut 2023 output nearly in half.
Argentina may need to import up to 10 million tonnes of soybeans. For the weekly export sales report, traders see soybean sales near 100,000-600,000 tonnes for old crop and another 50,000-300,000 tonnes for new crop. Meal sales are expected near 75,000-250,000 tonnes and oil sales are expected near zero-20,000 tonnes.
TODAY’S MARKET IDEAS:
Look for support in November Soybeans at 1291 3/4, with 1316 and then 1337 1/2 as key resistance. July Soybean support is at 1443, with 1464 3/4 as next key resistance. July Soybean Meal support is at 447.30, with 459.10 and 465.70 as resistance.
For the USDA planted acreage report on Friday, traders see US corn plantings near 90.9 million acres, 87.7-92.1 range, as compared with 91 million acres from the USDA Outlook forum and from 88.6 million last year. We lean to the higher end of estimates.
Traders see March 1 corn stocks at 7.474 billion bushels which would be the lowest since 2014. The range of estimates is 7.240-7.830, as compared with 7.758 billion last year. For the weekly export sales report, traders see corn sales near 600,000-1.8 million tonnes for old crop and 50,000-300,000 tonnes for new crop.
For the USDA planted acreage report on Friday, traders see all wheat planted area at 48.9 million acres, 45.7-50.0 range, as compared with 49.5 million acres from the USDA Outlook Forum. Spring wheat planted area is expected near 10.9 million acres, 9.8-12.0 range, as compared with 10.8 million acres last year. Winter wheat plantings are expected near 36.3 million acres from 33.3 million in 2022. Traders see wheat stocks as of March 1 at 929 million bushels, 875-1.020 billion range, as compared with stocks last March at 1.029 billion bushels last year. For the weekly export sales report, traders see wheat sales near 125,000-300,000 tons for old crop and 0-150,000 tons for new crop.
Trading Futures, Options on Futures, and retail off-exchange foreign currency transactions involves substantial risk of loss and is not suitable for all investors. You should carefully consider whether trading is suitable for you in light of your circumstances, knowledge, and financial resources. You may lose all or more of your initial investment. Opinions, market data, and recommendations are subject to change at any time when it comes to Futures Trading.
This is not a solicitation of any order to buy or sell, but a current market view provided by Cannon Trading Inc. Any statement of facts here in contained are derived from sources believed to be reliable, but are not guaranteed as to accuracy, nor they purport to be complete. No responsibility is assumed with respect to any such statement or with respect to any expression of opinion herein contained. Readers are urged to exercise their own judgement in trading.
This Friday is First Notice Day for April gold. Holding long positions in this futures contract into Friday subjects you to receiving a delivery notice from the exchange for 100 ounces of gold. You would then be required to have the full notional value of each 100-ounce futures contract on deposit in your account.
This upcoming event may not apply to any positions in your account this time, but if you ever take a long position in a futures contract where the method of settlement for that contract is the exchange of the actual physical asset, for example 100 ounces of gold, 5,000 bushels of oats, 37,500 pound of Arabica coffee, then you need to be mindful of those dates on the calendar that relate to the futures contracts you trade – Like First Notice Day. It can be a costly mistake even if you overlook an important date and find yourself in need of having to change your mind. After being informed that your account has received a delivery notice and you move to do an about-face – called retendering in futures parlance – the exchange may present you with a fine for your disregard of the calendar. Be careful.
For the grain markets and impact on livestock prices, Friday will mark the once a year prospective plantings report.
For our Grain Traders and Bona Fide Hedgers
This piece of information from one of our partners,
QTMarketCenter ( sign up for a free trial and enjoy plathora of information!)
Offers expectations for Friday’s big and all important USDA Prospective Plantings report and USDA Quarterly Grain Stocks —
Ahead of this week’s USDA quarterly grain stocks report, analysts are forecasting as of March 1, US Soybean stockpiles at 1.73 bln bu, that compares with the 1.93 bln bu on March 1, 2022
— Ahead of this week’s USDA quarterly grain stocks report, analysts are forecasting as of March 1, US Corn stockpiles at 7.47 bln bu, that compares with the 7.76 bln bu on March 1, 2022
— Grain traders and analysts are forecasting next week’s USDA prospective planting report to show US Soybean acres at 88.3 mln, that compares with last season’s 87.5 mln acres. The data will be released Friday, March 31 around 11:00 am CT.
— Grain traders and analysts are forecasting next week’s USDA prospective planting report to show US Corn acres at 90.9 mln, that compares with last season’s 88.6 mln acres. The data will be released Friday, March 31 around 11:00 am CT.
Trading Futures, Options on Futures, and retail off-exchange foreign currency transactions involves substantial risk of loss and is not suitable for all investors. You should carefully consider whether trading is suitable for you in light of your circumstances, knowledge, and financial resources. You may lose all or more of your initial investment. Opinions, market data, and recommendations are subject to change at any time when it comes to Futures Trading.
This is not a solicitation of any order to buy or sell, but a current market view provided by Cannon Trading Inc. Any statement of facts here in contained are derived from sources believed to be reliable, but are not guaranteed as to accuracy, nor they purport to be complete. No responsibility is assumed with respect to any such statement or with respect to any expression of opinion herein contained. Readers are urged to exercise their own judgement in trading.
There are few reports with market-moving potential in the March 27 week for the financials, However, for the grain markets and impact on livestock prices, Friday will mark the once a year prospective plantings report.
The third and final estimate of GDP for the fourth quarter 2022 will be reported at 7:30 CDT on Thursday. With the first quarter 2023 already nearing its end, there is far more interest in economic conditions in the January-March period.
Meanwhile, Fed policymakers will be back in public after the end of the communications blackout period from the March 21-22 FOMC meeting. No comments will be more closely attended to than Vice Chair of Supervision Michael Barr’s appearance before the House Financial Services Committee on Wednesday at 9:00 CDT. Aside from the committee’s posturing, Barr’s written testimony and responses to questioning will be a warning to other banks to clean up their risk management and any overreliance on narrow business sectors.
For our Grain Traders and Bona Fide Hedgers
This piece of information from one of our partners,
Offers expectations for Friday’s big and all important USDA Prospective Plantings report and USDA Quarterly Grain Stocks —
Ahead of this week’s USDA quarterly grain stocks report, analysts are forecasting as of March 1, US Soybean stockpiles at 1.73 bln bu, that compares with the 1.93 bln bu on March 1, 2022
— Ahead of this week’s USDA quarterly grain stocks report, analysts are forecasting as of March 1, US Corn stockpiles at 7.47 bln bu, that compares with the 7.76 bln bu on March 1, 2022
— Grain traders and analysts are forecasting next week’s USDA prospective planting report to show US Soybean acres at 88.3 mln, that compares with last season’s 87.5 mln acres. The data will be released Friday, March 31 around 11:00 am CT.
— Grain traders and analysts are forecasting next week’s USDA prospective planting report to show US Corn acres at 90.9 mln, that compares with last season’s 88.6 mln acres. The data will be released Friday, March 31 around 11:00 am CT.
Trading Futures, Options on Futures, and retail off-exchange foreign currency transactions involves substantial risk of loss and is not suitable for all investors. You should carefully consider whether trading is suitable for you in light of your circumstances, knowledge, and financial resources. You may lose all or more of your initial investment. Opinions, market data, and recommendations are subject to change at any time when it comes to Futures Trading.
This is not a solicitation of any order to buy or sell, but a current market view provided by Cannon Trading Inc. Any statement of facts here in contained are derived from sources believed to be reliable, but are not guaranteed as to accuracy, nor they purport to be complete. No responsibility is assumed with respect to any such statement or with respect to any expression of opinion herein contained. Readers are urged to exercise their own judgement in trading.
RISK DISCLOSURE: Past results are not necessarily indicative of future results. The risk of loss in futures trading can be substantial, carefully consider the inherent risks of such an investment in light of your financial condition.