Currency & Stock Index Futures: Avoid Costly Mistakes with these 3 Critical Deadlines

7cfe5b36 db9f 4933 824a 7f264613e7fe

Cannon Futures Weekly Letter

In Today’s Issue #1234

  • Rollover
  • The Week Ahead – FOMC, Housing
  • Futures 102 – Can you handle Drawdowns??
  • Hot Market of the Week – May KC/ Chi Wheat Spread
  • Broker’s Trading System of the Week – NQ intraday System
  • Trading Levels for Next Week
  • Trading Reports for Next Week

currency

Currencies Last Trading Day & Stock Index rollover

Time to start trading June Stock Index futures like MESM25 and MNQM25.

Symbol for June is M.

Monday, March 17th is Last Trading Day for all currency futures contracts, except the Canadian Dollar (Last Trading Day for the Canadian Dollar is Tuesday, March 18th). Currency futures contracts are DELIVERABLE CONTRACTS. You need to exit ALL LONG and SHORT open positions or be required to deliver or take delivery of the ACTUAL NOMINAL VALUE of the respective futures contract, i.e. $12,500 Euros, or $12,500,000 Japanese Yen. DO NOT put your account is this position. Exit all March ‘25 currency futures. Start trading currency futures with the June ’25 futures contracts.

Friday, March. 21st is Last Trading Day for March stock index futures contracts, i.e., the E-mini S&P, E-mini NASDAQ, E-mini Dow Jones and their Micro relatives. These futures contracts will halt trading at 8:30 A.M., Central Time and are cash settled, meaning any remaining open positions will be offset/settled using a to-be-determined settlement price. It is recommended that all new positions be placed in the June ‘25 futures contracts as of this Sunday night’s opening of trading. Volume in the March ‘25 contracts will begin to drop off until their expiration Friday, March. 21th.

Important Notices: The Week Ahead

By John Thorpe, Senior Broker

FOMC Week!

Indices traders roll to June, —M25

The Senate will vote today on a continuing resolution spending bill to keep the govt. open until Sept. 30. It must be on the Presidents desk by 11:59 pm EST to avoid a shut down, This may occur during market hours or after.

More volatility to come as next week all markets will be reacting to the potential for tariff implementations creating uncertainty in the marketplace. Therefore, increased volatility expectations.

Highlights next week will include Housing Data as well as the Wednesday Rate decision. Earnings reports continue to dwindle with 271 total reports while we are in the top of the 9th inning of earnings season, the reports will be impacting the indices much less than in past weeks Highlighted by many Chinese corp. reports. Finally, for Indices traders, contract rollover Monday. June will become the front month. M25. If you are on the new StoneX Platform, click on your current month tab at the top of your DOM or HOT to open the menu. Then slide down to Replace, now type in EPM25 if you are trading the Mini-S&P or ENQM25 for the Mini Nasdaq.

Earnings Next Week:

  • Mon. Quiet
  • Tue. Quiet
  • Wed. Tencent
  • Thu. Micron, Nike
  • Fri. Quiet

FED SPEECHES:

  • Mon.     Fed Blackout period
  • Tues.     Fed Blackout Period persists
  • Wed.     Fed Rate Decision 3/19/25 Chair Powell will Speak, 30 minutes after the rate decision.
  • Thu.      Last day of Fed Blackout period
  • Fri.       Williams 8:05 am CDT

Economic Data week:

  • Mon. Empire State Mfg., NAHB Housing Market Index
  • Tue. Bldg. Permits, Housing Starts, Redbook, Industrial Production
  • Wed. EIA Crude Stocks, FOMC I.R. Decision 1:00 pm followed by Fed Presser 1:30 pm CDT
  • Thur. Initial Jobless Claims, Philly Fed, Existing Home Sales, EIA Nat Gas
  • Fri Quiet

Futures 102: System Traders: Can you handle the drawdowns?

Many investors may think, “I can handle drawdown”, but honestly you have no idea how much drawdown you can handle until you have been stuck in the eye of a number of your own personal drawdown storms.

While drawdown is a natural part of trading and investing, what does differ is how much drawdown each investor can mentally handle. As humans, we all ‘see’ the world differently. What appears as something normal to one person can appear completely disastrous to another. While a 10% portfolio drawdown could be extreme for one investor, the next investor may be able to trade through periods of 50% plus drawdown.

From the behavioral finance point of view, some of the main negative facts of the human brain related to trading are:

  1. The fact that weak traders tend to be reluctant to realize losses and quick to realize gains. They are more risk averse when dealing with profitable positions and more risk seeking when dealing with losses.
  2. The fact that weak traders make inconsistent and irrational economic decisions over the same scenario depending on how it is described.
  3. The fact that weak traders deals with positions as if they were expecting mean reversion of prices. They are expecting the price to return to a long term average. This is the principle that makes them think they are buying expensive positions on volatility breakout or trend following strategies.

It is out of the scope of this article to talk much more about this science, but I will just point that:

  1. Weak traders know nothing about behavioral finance, so they think that his gut feeling is right and base their decisions on his gut feeling.
  2. Smart traders knows about behavioral finance. A smart trader has already studied about this and trained himself to overcome this limitations.  At least they know how to deal with their brain to avoid most of the damage it can create on their trading accounts. The best traders knows even how to monetize from this herd behavior.

Are drawdown periods a bad thing?


In my opinion, they are not a bad thing, in fact I believe that drawdown periods are a very sane and good thing for any solid strategy. Drawdown periods are very efficient to shake out weak traders from the strategy while smarter traders can pick up their money (which is the name of the game after all).

The time that passes since the first equity high until we reach a new equity high is the drawdown period.

So a drawdown period has two dimensions:

  • The drawdown depth
  • The drawdown length

Most people mostly care about the drawdown depth as this is what is easier to see on back tests. But human the brain is much more affected by drawdown length. During live trading, it is easier to deal with a 10% drawdown for one week than with a 5% drawdown for five months.

  • Detailed statistical information about the strategy: Expected profit, expected drawdown, maximal drawdown depth and length, average win percentage, reward to risk ratio, …
  • Different scenarios and the actions to take (if any): intense and/or deep drawdown periods and what to do (or do nothing), whether to trade during Christmas time or summer time, whether to keep opened positions during weekends or not, what to do after a losing year (or do nothing), funding and withdrawing plan, …
  • A very clear worst case scenario: it is basically the “line in the sand” where we know that the strategy has lost it’s edge and something must be done (stop trading the strategy, adapting parameters, …). There are many ways to calculate it (double the max historical drawdown, using montecarlo simulations, using regression lines multiplied by x times the standard deviation on the equity curve, …). In the end it is a number. The important thing is to have it written in the trading plan.

When facing a problem that generates pain or panic such as a sudden deep drawdown, most of the time, when analyzed with rigor and care, the problem is not so important, and everything is within expected statistics. You will see that there were many periods in the past with similar characteristics.

Hot Market of the Week

Hot market of the week is provided by QT Market Center, A Swiss army knife charting package that’s not just for Hedgers, Cooperatives and Farmers alike but also for Spread traders, Swing traders and shorter time frame application for intraday traders with a unique proprietary indicator that can be applied to your specific trading needs.

Free Trial Available

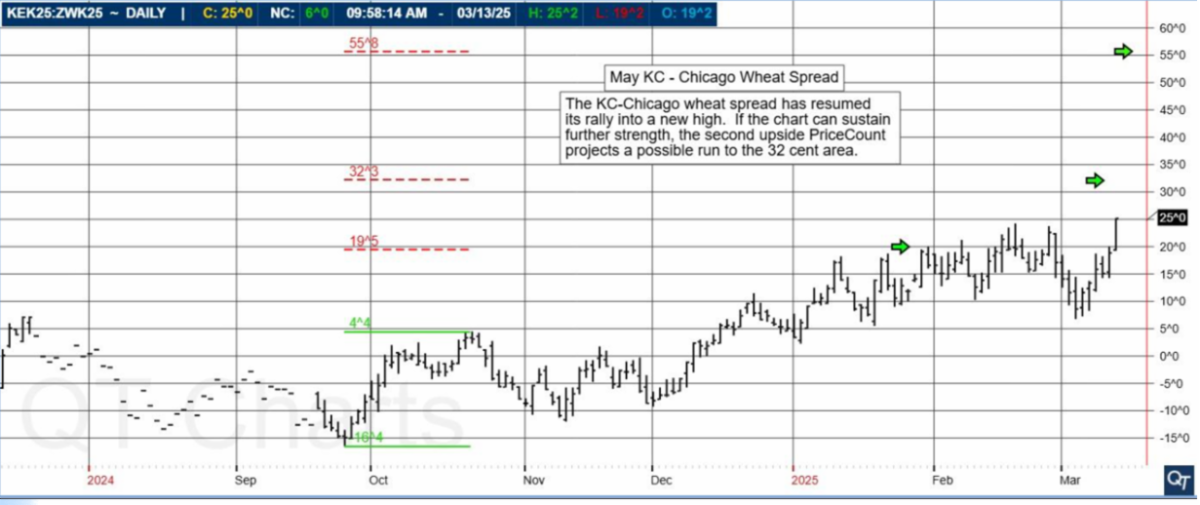
May KC – Chicago Wheat Spread

The KC-Chicago wheat spread has resumed its rally into a new high. If the chart can sustain further strength, the second upside PriceCount projects a possible run to the 32-cent area.

04f865a9 1c11 4576 b13a 867dcc05b204

The PriceCount study is a tool that can help to project the distance of a move in price. The counts are not intended to be an ‘exact’ science but rather offer a target area for the four objectives which are based off the first leg of a move with each subsequent count having a smaller percentage of being achieved. It is normal for the chart to react by correcting or consolidating at an objective and then either resuming its move or reversing trend. Best utilized in conjunction with other technical tools, PriceCounts offer one more way to analyze charts and help to manage your positions and risk. Learn more at www.qtchartoftheday.com

Trading in futures, options, securities, derivatives or OTC products entails significant risks which must be understood prior to trading and may not be appropriate for all investors. Past performance of actual trades or strategies is not necessarily indicative of future results.

Brokers Trading System of the Week

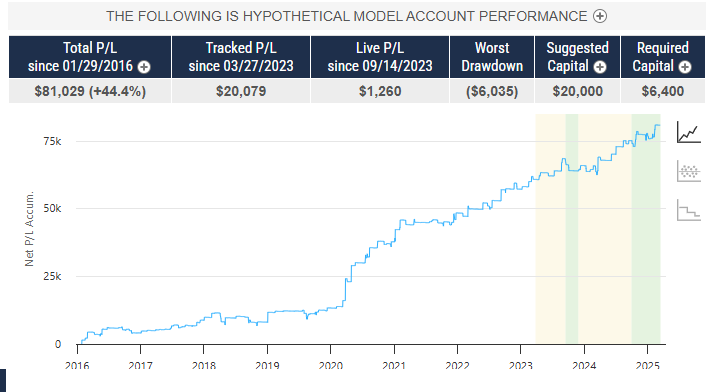
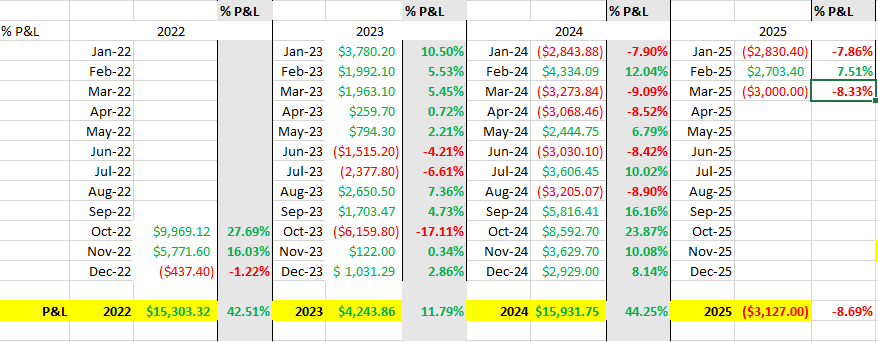
With algorithmic trading systems becoming more prevalent in portfolio diversification, the following system has been selected as the broker’s choice for this month.

Intra Nasdaq

PRODUCT

Mini NASDAQ

SYSTEM TYPE

Day Trading

Recommended Cannon Trading Starting Capital

$20,000

COST

USD 85 / monthly

Get Started

Learn More

98f6920d d939 4f0b a401 19b6cebb6155

The performance shown above is hypothetical in that the chart represents returns in a model account. The model account rises or falls by the average single contract profit and loss achieved by clients trading actual money pursuant to the listed system’s trading signals on the appropriate dates (client fills), or if no actual client profit or loss available – by the hypothetical single contract profit and loss of trades generated by the system’s trading signals on that day in real time (real‐time) less slippage, or if no real time profit or loss available – by the hypothetical single contract profit and loss of trades generated by running the system logic backwards on back adjusted data. Please read full disclaimer HERE.

Would you like to get weekly updates on real-time, results of systems mentioned above?
Yes
No

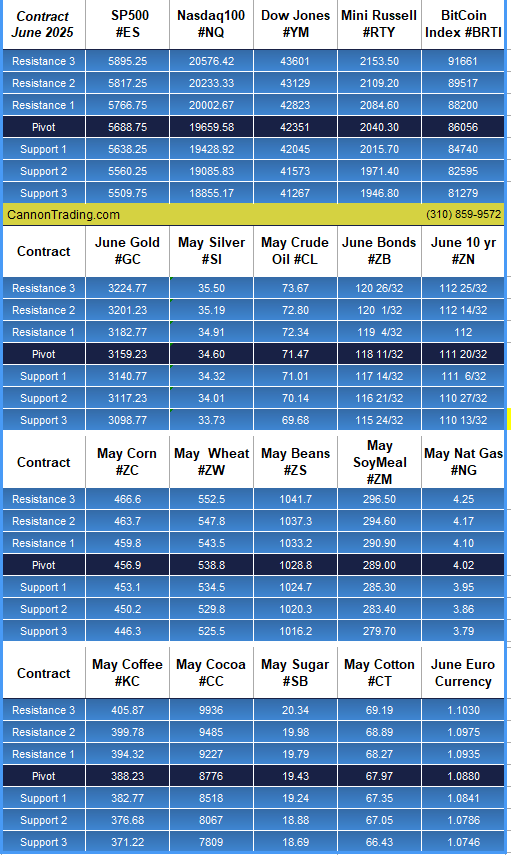
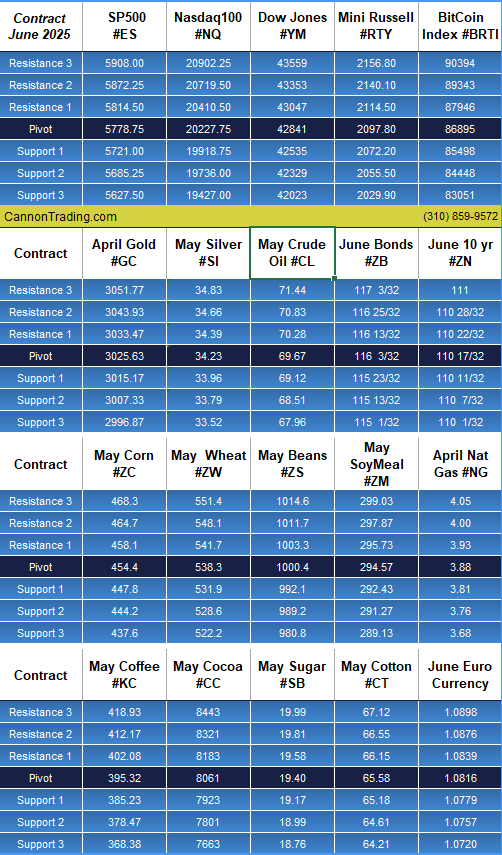
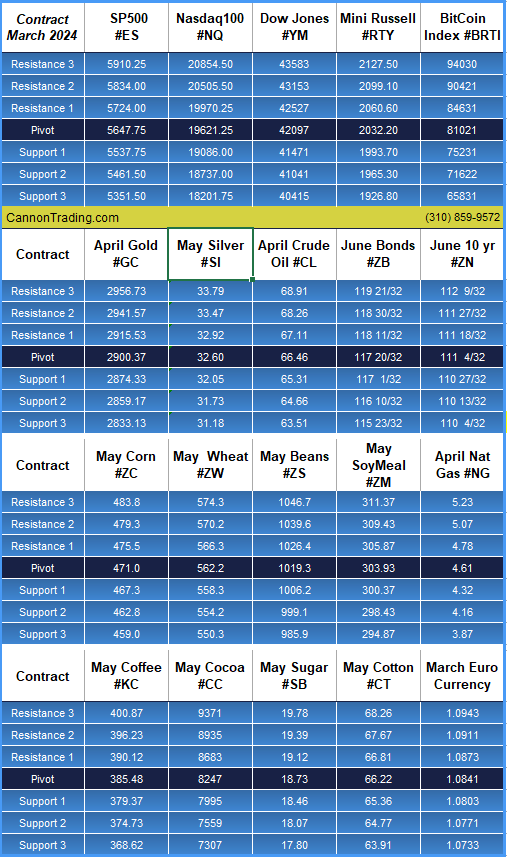
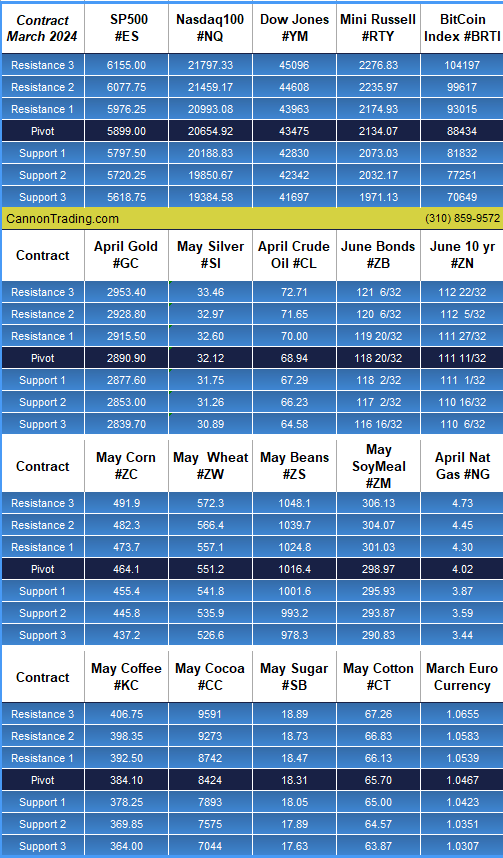
Trading Levels for Next Week

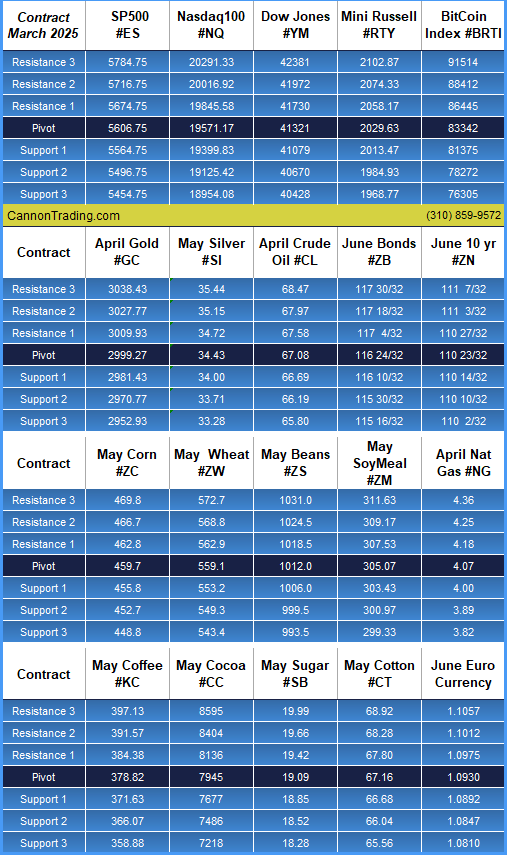
Daily Levels for March 17th, 2025

68e10b2b d361 4459 99e9 c157f620ce96

Would you like to receive daily support & resistance levels?
Yes
No

Trading Reports for Next Week

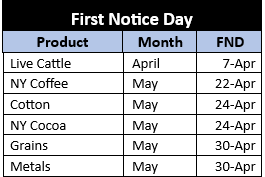
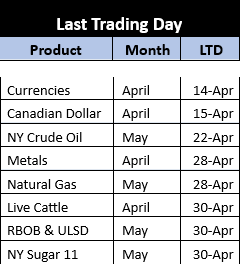
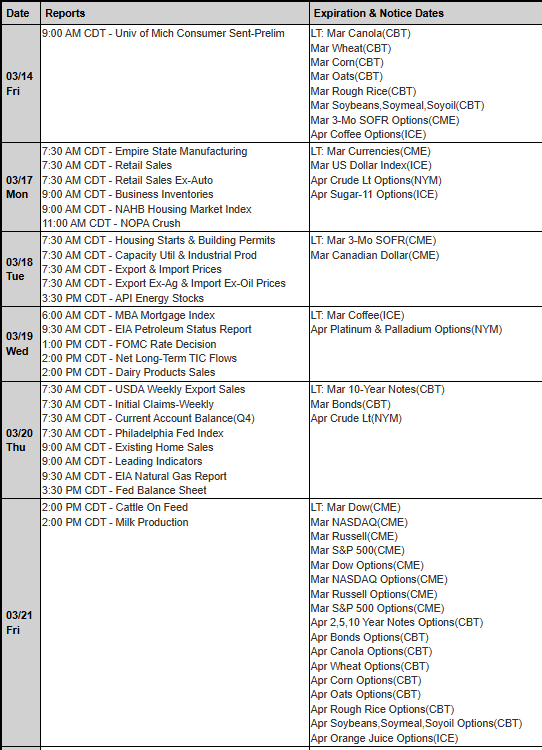
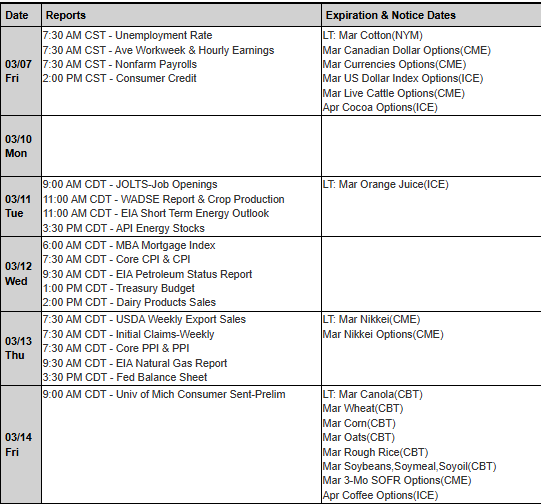
First Notice (FN), Last trading (LT) Days for the Week:

www.mrci.com 

b74635bd 884f 41ea b758 e4a8b904d3f3

Find us on Trustpilot

stars

Trading Futures, Options on Futures, and retail off-exchange foreign currency transactions involves substantial risk of loss and is not suitable for all investors. You should carefully consider whether trading is suitable for you in light of your circumstances, knowledge, and financial resources. You may lose all or more of your initial investment. Opinions, market data, and recommendations are subject to change at any time.

Call Now

Join our Private Facebook group

Subscribe to our YouTube Channel

Listen to our podcast: Subscribe on AppleSpotify, Amazon

or wherever you listen to podcasts!

S
Facebook  Instagram  LinkedIn
S
ef3ab1c9 8d6d 4e60 a3f1 af5d9d4ecbb3
Services
Software
Tools
Community
Contact

Volatility Warning: 3 Crucial Adjustments to Avoid Devastating Losses in High Volatility!

9dc1e02e d5f7 4ff4 abf7 1df60775f196

Volatility Expands

volatility 2

Volatility is high!!

Volatility alert: The “bands” are expanding, consider reducing trading size? Possibly trading MICROS?

Evaluating your stops and targets to make sure they adjust to volatility?

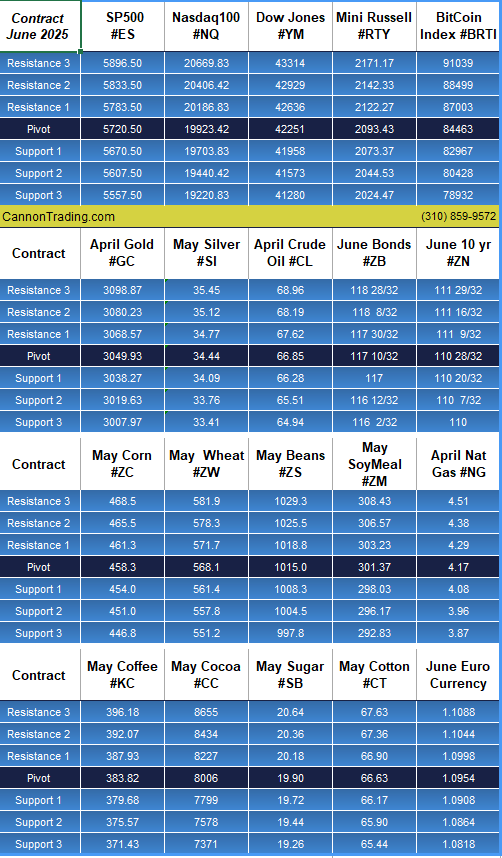
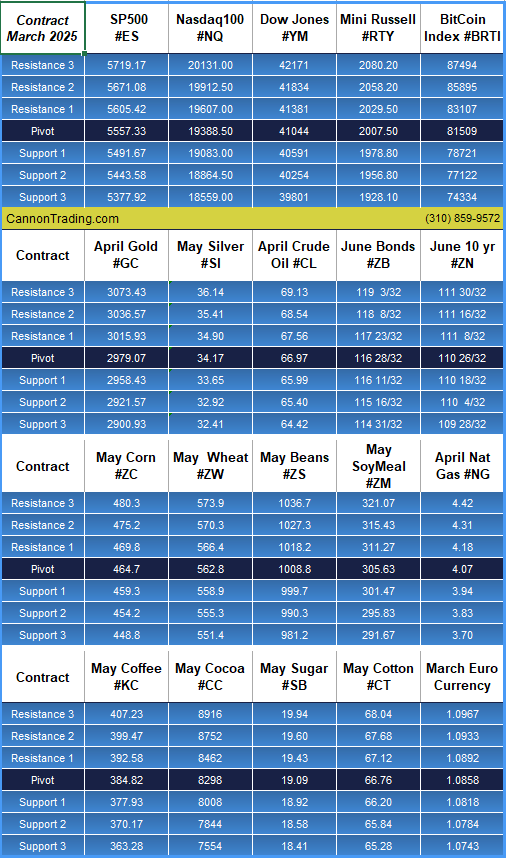
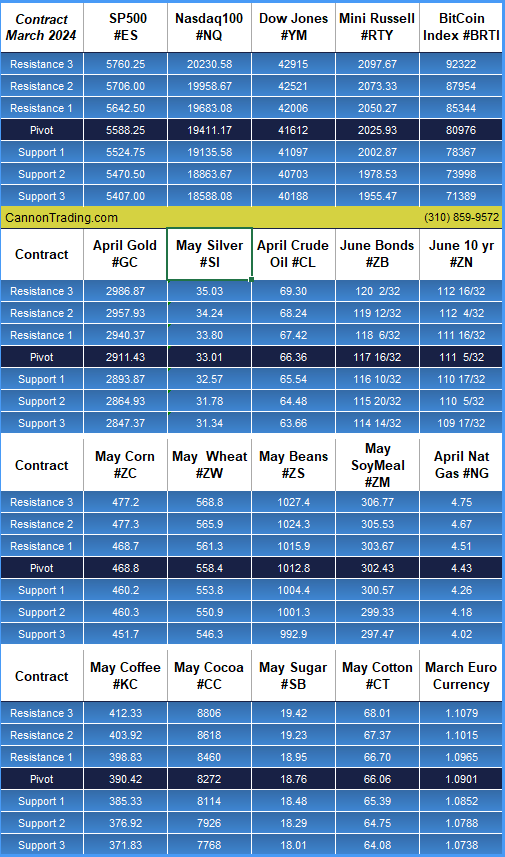
Daily Levels for March 14th, 2025

a2976065 b56b 4444 b745 f2da20f3b7f8

Want to feature our updated trading levels on your website? Simply paste a small code, and they’ll update automatically every day!

 Click here for quick and easy instructions.

822b33c5 2339 45ed bc84 e9c8f8c7358e

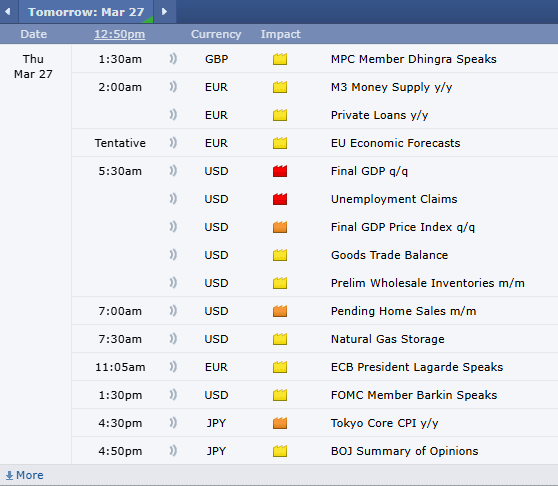
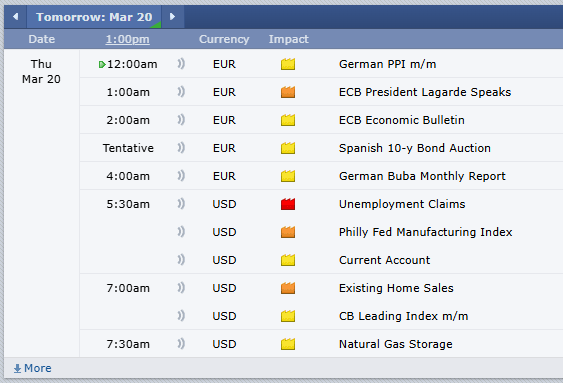
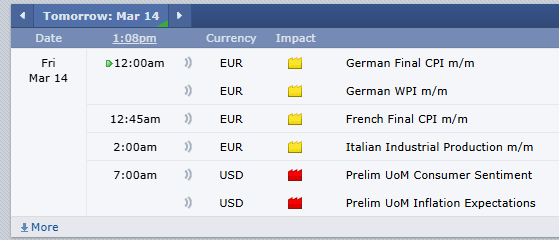
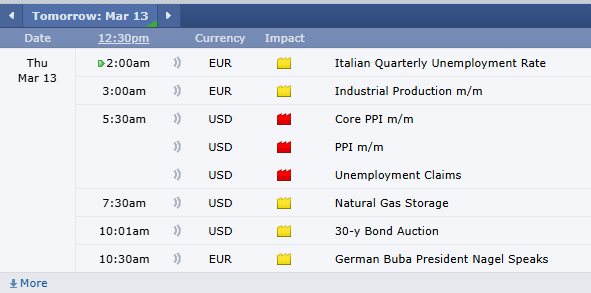
Economic Reports

provided by: ForexFactory.com

All times are Eastern Time (New York)

1d8ea8d0 dea7 449c 81f2 9ee6b25ac0a2

Find us on Trustpilot

stars

Trading Futures, Options on Futures, and retail off-exchange foreign currency transactions involves substantial risk of loss and is not suitable for all investors. You should carefully consider whether trading is suitable for you in light of your circumstances, knowledge, and financial resources. You may lose all or more of your initial investment. Opinions, market data, and recommendations are subject to change at any time.

Call Now

Join our Private Facebook group

Subscribe to our YouTube Channel

Listen to our podcast: Subscribe on AppleSpotify, Amazon

or wherever you listen to podcasts!

S
Facebook  Instagram  LinkedIn
S
ef3ab1c9 8d6d 4e60 a3f1 af5d9d4ecbb3
Services
Software
Tools
Community
Contact

Standard and Poor 500’s Brutal 10% Drop: Is a Rebound or a Bigger Crash Coming?

9dc1e02e d5f7 4ff4 abf7 1df60775f196

Markets Highlights

by

Mark O’Brien, Senior Broker

Standard and Poor 500 Futures: Market Next Move?

standard and poor 500

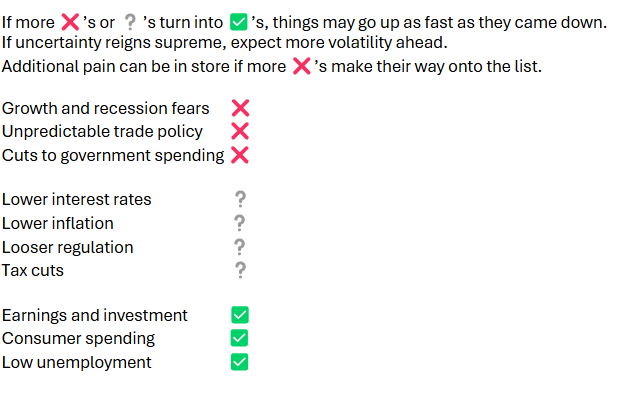
It was only three weeks ago that the March E-mini Standard and Poor 500 futures contract hit an all-time high.  Markets have been dealt a blow by growth and recession fears, the unpredictability of trade policy, and risks to sector-wide investment and spending.

Whether it’s a good buying opportunity or another growl towards a bear market is still up for debate, the Standard and Poor 500 index futures contract fell into correction territory yesterday, registering a decline of 10% in the span of less than a month.  While the Standard and Poor 500 futures contract trimmed some of the losses, big questions are still swirling over what lies ahead. The Trump administration is attempting to engineer a long-term structural change to the U.S. economy.  The reality of that goal is hotly debated, but it is no doubt taking a toll on the short-term animal spirits that enveloped the market since November.

Here’s a 10-point checklist that will determine the market’s future trajectory:

3dd2e436 7206 4a9c 8bd8 ee6764c62f3a

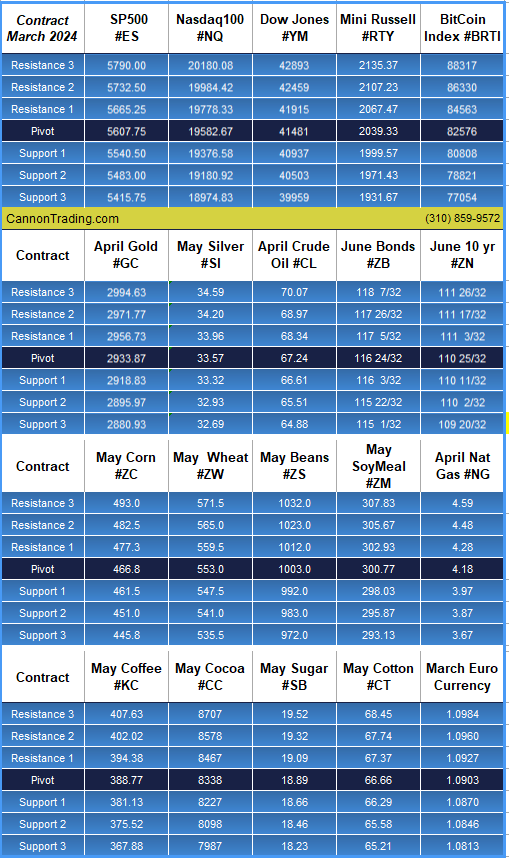
Daily Levels for March 13th, 2025

fc26aa86 51d8 46de bca7 b2d864f3ba59

Want to feature our updated trading levels on your website? Simply paste a small code, and they’ll update automatically every day!

Click here for quick and easy instructions.

822b33c5 2339 45ed bc84 e9c8f8c7358e

Economic Reports

provided by: ForexFactory.com

All times are Eastern Time (New York)

8077bace 0e71 438a b5c2 4ed5d93cb919

Find us on Trustpilot

stars

Trading Futures, Options on Futures, and retail off-exchange foreign currency transactions involves substantial risk of loss and is not suitable for all investors. You should carefully consider whether trading is suitable for you in light of your circumstances, knowledge, and financial resources. You may lose all or more of your initial investment. Opinions, market data, and recommendations are subject to change at any time.

Call Now

Join our Private Facebook group

Subscribe to our YouTube Channel

Listen to our podcast: Subscribe on AppleSpotify, Amazon

or wherever you listen to podcasts!

S
Facebook  Instagram  LinkedIn
S
ef3ab1c9 8d6d 4e60 a3f1 af5d9d4ecbb3
Services
Software
Tools
Community
Contact


The High-Stakes Crude Oil & CPI Report: 3 Critical Signals for Market Movers

9dc1e02e d5f7 4ff4 abf7 1df60775f196

Crude Oil

crude oil

Movers & Shakers by John Thorpe, Senior Broker

CPI and EIA Petroleum Stocks

Market volatility is here to stay for the foreseeable future

Choose your opportunities wisely.

Prepare for shocks, on CPI and Stocks.

CPI Tomorrow before the Cash Open 7:30 am CST

Updated: March 11, 2025, 12:20 pm

US February consumer price index (CPI) data is forecast by analysts up +0.3% month-to-month, which compares to the previous month’s +0.5%. Core CPI on monthly terms is expected +0.3% in February compared to the prior month’s +0.4%. The data will be released at 7:30 am CT Wednesday morning. CPI on annualized terms is forecast up +2.9% from the year ago month, the core year-over-year figure is expected up +3.2%.

EIA Crude Oil Inventories Tomorrow

EIA Weekly Petroleum Stocks Estimates for Wednesday, March 12 at 9:30 AM CT

in million barrels per day (mln bpd)

Tomorrow:

Econ Data:  CPI, EIA Crude Inventories, Beige Book

630ac786 c874 4cc8 ba42 5324fdf46483

Daily Levels for March 12th, 2025

55546f30 079b 4ae8 877f a2690700854e

Want to feature our updated trading levels on your website? Simply paste a small code, and they’ll update automatically every day! Click here for quick and easy instructions.

822b33c5 2339 45ed bc84 e9c8f8c7358e

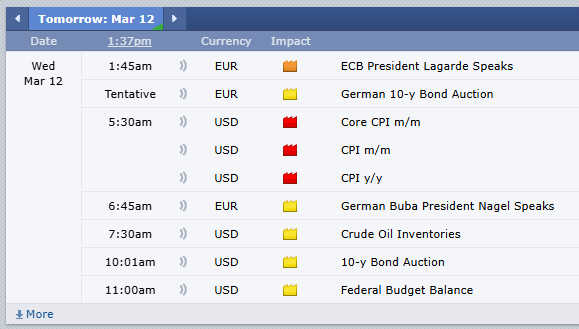
Economic Reports

provided by: ForexFactory.com

All times are Eastern Time (New York)

8fdad7f6 8d17 46c6 8cf8 581955abca4c

Find us on Trustpilot

stars

Trading Futures, Options on Futures, and retail off-exchange foreign currency transactions involves substantial risk of loss and is not suitable for all investors. You should carefully consider whether trading is suitable for you in light of your circumstances, knowledge, and financial resources. You may lose all or more of your initial investment. Opinions, market data, and recommendations are subject to change at any time.

Call Now

Join our Private Facebook group

Subscribe to our YouTube Channel

Listen to our podcast: Subscribe on AppleSpotify, Amazon

or wherever you listen to podcasts!

S
Facebook  Instagram  LinkedIn
S
ef3ab1c9 8d6d 4e60 a3f1 af5d9d4ecbb3
Services
Software
Tools
Community
Contact

Shocking Surge: 3 Powerful Ways to Survive Expanding Volatility in Trading

9dc1e02e d5f7 4ff4 abf7 1df60775f196

Volatility Expands

volatility

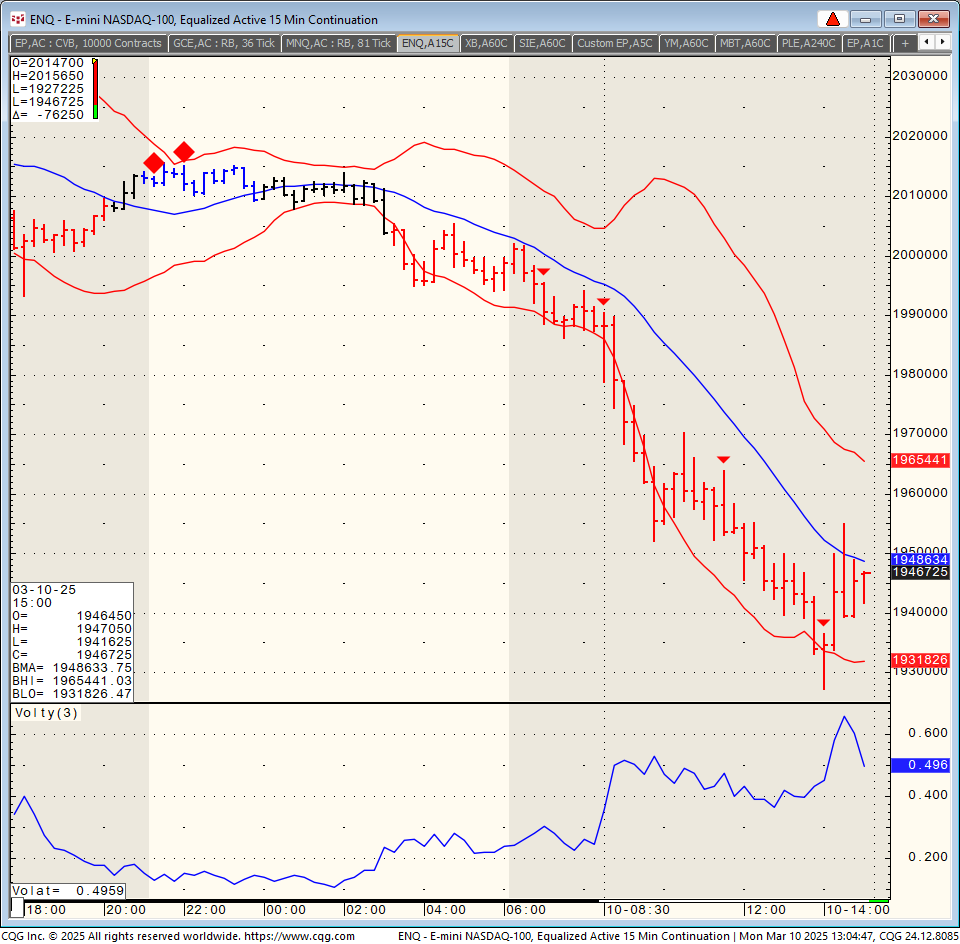
See below NQ 15 minute chart for an illustration of the expanded volatility, speed, size of moves etc.

The “bands” are expanding, consider reducing trading size? Possibly trading MICROS?

Evaluating your stops and targets to make sure they adjust to volatility?

3d26d227 5d16 4e32 927f aeb2eaa0076f

Daily Levels for March 11th, 2025

2a2b7415 e8c7 420e 939a 5c3a46075ae4

Want to feature our updated trading levels on your website? Simply paste a small code, and they’ll update automatically every day! Click here for quick and easy instructions.

822b33c5 2339 45ed bc84 e9c8f8c7358e

Economic Reports

provided by: ForexFactory.com

All times are Eastern Time (New York)

1f564477 7f2b 4887 9050 a9ba8379b292

Find us on Trustpilot

stars

Trading Futures, Options on Futures, and retail off-exchange foreign currency transactions involves substantial risk of loss and is not suitable for all investors. You should carefully consider whether trading is suitable for you in light of your circumstances, knowledge, and financial resources. You may lose all or more of your initial investment. Opinions, market data, and recommendations are subject to change at any time.

Call Now

Join our Private Facebook group

Subscribe to our YouTube Channel

Listen to our podcast: Subscribe on AppleSpotify, Amazon

or wherever you listen to podcasts!

S
Facebook  Instagram  LinkedIn
S
ef3ab1c9 8d6d 4e60 a3f1 af5d9d4ecbb3
Services
Software
Tools
Community
Contact

⚠️ 5 Market Hazards Ahead – Soybean, Volatility, CPI & The Fed’s Blackout Shaking up Markets!

7cfe5b36 db9f 4933 824a 7f264613e7fe

Cannon Futures Weekly Letter

Soybean

March Soybean

In Today’s Issue #1233

  • Time Change
  • The Week Ahead – CPI, PPI, Fed Blackout
  • Futures 102 – Intro to Treasury Futures
  • Hot Market of the Week – May July Beans Spread
  • Broker’s Trading System of the Week – ES intraday System
  • Trading Levels for Next Week
  • Trading Reports for Next Week

USA Time Change!!

Final Week of Standard time in the U.S. “Spring Forward!” Begins Sunday, March 9th.

Advance your clocks 1 hour @ 2 A.M.

Important Notices: The Week Ahead

By John Thorpe, Senior Broker


Final Week of Standard time in the U.S. “Spring Forward!” Begins Sunday, March 9th.

Advance your clocks 1 hour @ 2 A.M.

More volatility to come as next week all markets will be reacting to the potential for tariff implementations creating uncertainty in the marketplace. Therefore, increased volatility expectations.

Highlights next week will also include CPI and PPI Wednesday and Thursday respectively prior to cash market open. No fed speakers as we enter the official “BlackOut” period. The next Fed Rate decision is do out the following week.

Earnings reports continue to dwindle with 302 total reports while we are in the top of the 9th inning of earnings season, the reports will be impacting the indices much less than in past weeks.

I am including the European carmakers as a benchmark. My belief is the market will be much more interested in the earnings of these companies in future quarters as bell weathers for potential tariff effects. Finally, for Indices traders, at the end of next week, Friday, this should be the last day you will want to trade the March contract. June will become the front month. M25.

Earnings Next Week:

  • Mon. Oracle post close
  • Tue. Volkswagen AG
  • Wed. Adobe post close, Porsche.
  • Thu.  Quiet
  • Fri. BMW

FED SPEECHES:

  • Mon.     Fed Blackout period
  • Tues.     until the day after
  • Wed.     the next rate announcement
  • Thu.     On Wednesday March 19th
  • Fri.       3/19/25 Chair Powell will Speak, 30 minutes after the rate decision.

Economic Data week:

  • Mon. Quiet
  • Tue. Redbook, Jolts, WASDE
  • Wed. CPI, EIA Crude Inventories, Beige Book
  • Thur. PPI, Initial Jobless Claims, EIA Nat Gas
  • Fri. Michigan Consumer Sentiment

Futures 102: Introduction to Treasuries

Course Overview

Central banks like the U.S. Federal Reserve help shape short- and long-term economic growth by restricting or expanding the supply of money circulating in an economy. They do this through the use of debt obligations called treasuries — such as bills, notes and bonds – in which the government borrows money from the holder for a specified period of time. Because treasuries are viewed as being among safest of all investments, they can be in high demand.

Treasury futures offer one way to gain exposure without trading the individual securities themselves. Learn the basics behind trading Treasury futures, from the delivery process, contract specifications, key concepts like basis and Cheapest to Deliver (CTD) and more. Discover the different ways these contracts are used, from price discovery to risk management to profit speculation, and how they are intertwined with other financial markets like stocks and currencies.


Start Now

8e878207 04e8 43d4 8eed 6a97b610ecbd

Hot Market of the Week

Hot market of the week is provided by QT Market Center, A Swiss army knife charting package that’s not just for Hedgers, Cooperatives and Farmers alike but also for Spread traders, Swing traders and shorter time frame application for intraday traders with a unique proprietary indicator that can be applied to your specific trading needs.

Free Trial Available

Soybean Spread

May – July

The May – July soybean spread accelerated with a gap higher where it completed its second upside PriceCount objective off the February low. The chart is correcting and closed the gap. IF you can resume the rally with new sustained highs, the third count would project a possible run to the -9 area, which would be consistent with a challenge of the January spike reversal.

3abb5289 c185 436f 8a31 470ddf1626b1

The PriceCount study is a tool that can help to project the distance of a move in price. The counts are not intended to be an ‘exact’ science but rather offer a target area for the four objectives which are based off the first leg of a move with each subsequent count having a smaller percentage of being achieved. It is normal for the chart to react by correcting or consolidating at an objective and then either resuming its move or reversing trend. Best utilized in conjunction with other technical tools, PriceCounts offer one more way to analyze charts and help to manage your positions and risk. Learn more at www.qtchartoftheday.com

Trading in futures, options, securities, derivatives or OTC products entails significant risks which must be understood prior to trading and may not be appropriate for all investors. Past performance of actual trades or strategies is not necessarily indicative of future results.

Brokers Trading System of the Week

With algorithmic trading systems becoming more prevalent in portfolio diversification, the following system has been selected as the broker’s choice for this month.

ES NZL

The NZL automated trading system utilizes two main ALGOS in an attempt to identify either an early trend in the trading day and/or high percentage counter trend set ups.

The system is fully automated and runs between the hours of 4 AM central and 3:15 PM Central.

The model relies on volume charts rather than time charts.

PRODUCT

Mini SP500

SYSTEM TYPE

Day Trading

Recommended Cannon Trading Starting Capital

$36,000

COST

USD 199 / monthly

Get Started

Learn More

eb24b79b 9ad9 4c8f ab57 4b7e4187cdf7

The performance shown above is hypothetical in that the chart represents returns in a model account. The model account rises or falls by the average single contract profit and loss achieved by clients trading actual money pursuant to the listed system’s trading signals on the appropriate dates (client fills), or if no actual client profit or loss available – by the hypothetical single contract profit and loss of trades generated by the system’s trading signals on that day in real time (real‐time) less slippage, or if no real time profit or loss available – by the hypothetical single contract profit and loss of trades generated by running the system logic backwards on back adjusted data. Please read full disclaimer HERE.

Would you like to get weekly updates on real-time, results of systems mentioned above?
Yes
No

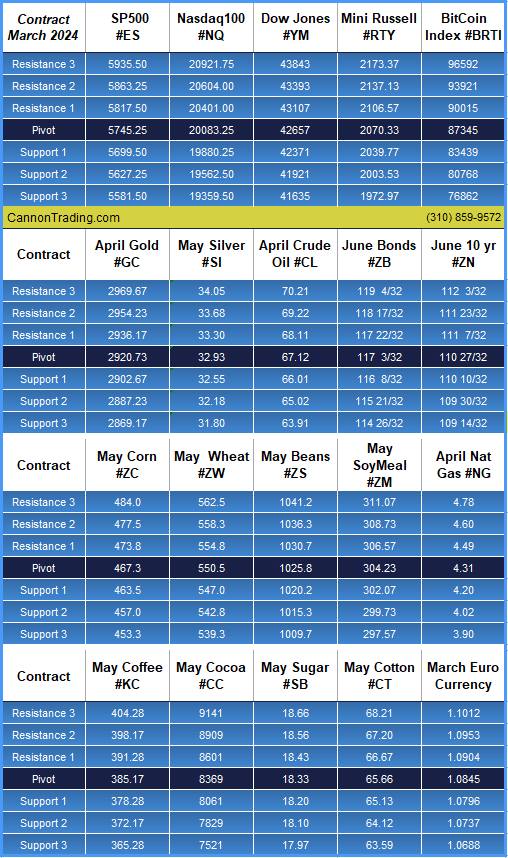
Trading Levels for Next Week

Daily Levels for March 10th, 2025

83c7badb 8ba5 48e3 a0bc 9661027db852

Would you like to receive daily support & resistance levels?
Yes
No

Trading Reports for Next Week

First Notice (FN), Last trading (LT) Days for the Week:

www.mrci.com

6465a7a5 f69b 4e65 a1bd 970a6b4811fa

Find us on Trustpilot

stars

Trading Futures, Options on Futures, and retail off-exchange foreign currency transactions involves substantial risk of loss and is not suitable for all investors. You should carefully consider whether trading is suitable for you in light of your circumstances, knowledge, and financial resources. You may lose all or more of your initial investment. Opinions, market data, and recommendations are subject to change at any time.

Call Now

Join our Private Facebook group

Subscribe to our YouTube Channel

Listen to our podcast: Subscribe on AppleSpotify, Amazon

or wherever you listen to podcasts!

S
Facebook  Instagram  LinkedIn
S
ef3ab1c9 8d6d 4e60 a3f1 af5d9d4ecbb3
Services
Software
Tools
Community
Contact

Nasdaq, S&P 500 Ride the Volatility Lightning! Market Insights & Economic Highlights

9dc1e02e d5f7 4ff4 abf7 1df60775f196

nasdaq

Movers & Shakers by John Thorpe, Senior Broker

Nasdaq

Movers and Shakers: Volatile Day Ahead, Full of Reports

President Trump addressing joint session of congress this evening @ 9 PM Eastern, 6 PM Pacific

Market volatility is here to stay for the foreseeable future, with the Nasdaq and S&P 500 sliding downward at a serious clip.

Choose your opportunities wisely. Don’t miss out on the market news highlights of the day recap below!

Nasdaq, S&P 500

The S&P 500 experienced an 114-point slide ($5700 per contract) The market has continued to recover from the initial losses and look to close in – 50-point range near 5820.00 basis the March contract. The Nasdaq, after taking a drubbing down over 400 points earlier in the session, was running as positive as up 200. As, the Nasdaq is virtually unchanged now as of this typing while the DOW looks to subtract over .1% into the 43000 area.

Tariff concerns creating a lack of confidence in the US Dollar as a safe-haven currency has pushed thru support at 106.00 looking to close in the 105.70 area for the first time since December 10th. The Grain markets should have been lower by much more than they were, Soybeans down 14 cents, Wheat down 11 and Corn down 4 /12 cents, if the dollar were stronger today, our old crop supply is getting cheaper by the day.

Crude oil, after experiencing a $1.70 range will be closing near unchanged around the 68.40 area basis the April contract just .70 lower than one week ago.

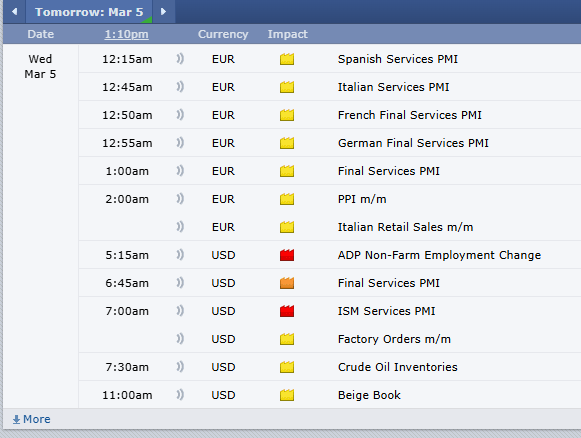
Econ Data: ADP, S&P Global Svcs. PMI, Factory orders, ISM Svcs. PMI, EIA Crude Inventories, Beige Book

FED Speak: Quiet

Earnings: Quiet

S

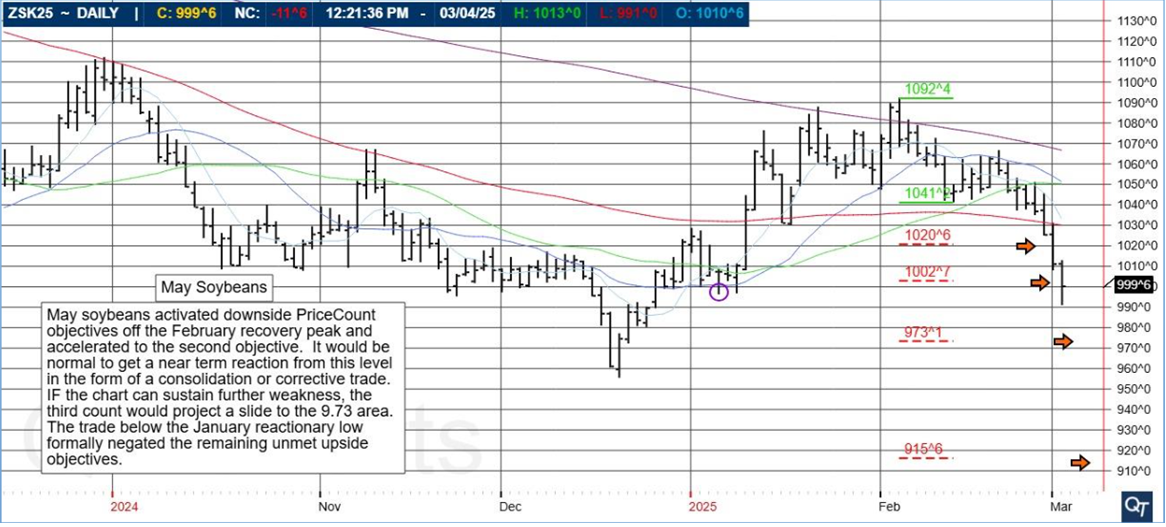
May Soybeans

May soybeans activated downside PriceCount objectives off the February recovery peak and accelerated to the second objective. It would be normal to get a near term reacion from this level in the form of a consolidation or corrective trade. IF the chart can sustain further weakness, the third count would project a slide to the 9.73 area. The trade below the January reactionary low formally negated the remaining unmet upside objectives.

bf1f7fa2 0792 479d 86f5 e53ff4b5192b

Daily Levels for March 5th, 2025

d4035983 1e77 492c 9724 19e2cad5abf0

Want to feature our updated trading levels on your website? Simply paste a small code, and they’ll update automatically every day! Click here for quick and easy instructions.

822b33c5 2339 45ed bc84 e9c8f8c7358e


Economic Reports

provided by: ForexFactory.com

All times are Eastern Time (New York)

d8583071 3be8 4f4d 99ba eaf6652c2c34

Find us on Trustpilot

stars

Trading Futures, Options on Futures, and retail off-exchange foreign currency transactions involves substantial risk of loss and is not suitable for all investors. You should carefully consider whether trading is suitable for you in light of your circumstances, knowledge, and financial resources. You may lose all or more of your initial investment. Opinions, market data, and recommendations are subject to change at any time.

Call Now

Join our Private Facebook group

Subscribe to our YouTube Channel

Listen to our podcast: Subscribe on AppleSpotify, Amazon

or wherever you listen to podcasts!

S
Facebook  Instagram  LinkedIn
S
ef3ab1c9 8d6d 4e60 a3f1 af5d9d4ecbb3
Services
Software
Tools
Community
Contact

March Contract Notices Coming in Hot! First Notice Day & Last Trading Day Guidelines

9dc1e02e d5f7 4ff4 abf7 1df60775f196

march 2

First & Last trading Days for March 2025

March Contract Notices

FND/LTD:

Below are the March contracts which are entering First Notice or Last Trading Day for March.

Be advised, for contracts that are deliverable, it is requested that all LONG positions be exited two days prior to First Notice and ALL positions be exited the day prior to Last Trading Day.

March Contract:

cbcaab9e e727 4091 84a8 be670aaeff98

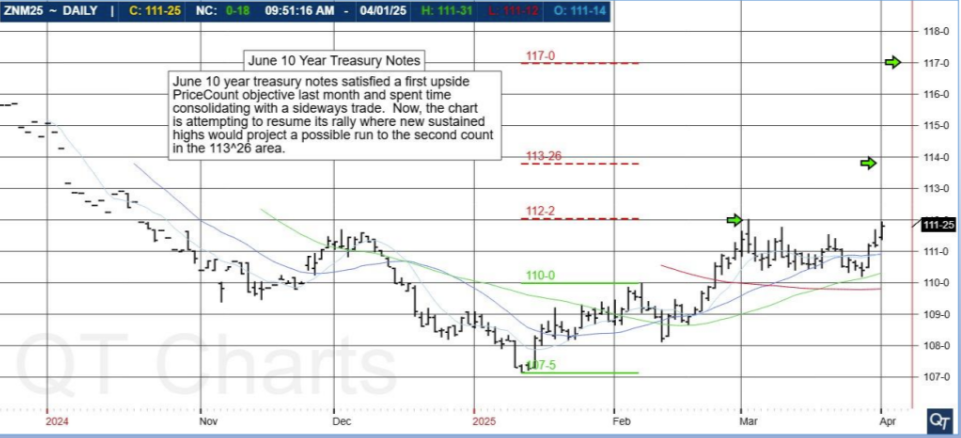
June 10 Year Notes:

112’02 next target?

19a949ba 7b99 4570 8e85 df45eef0b9ed

Daily Levels for March 4th, 2025

370e72d7 5926 4f3f affc 4bfa4115b054

822b33c5 2339 45ed bc84 e9c8f8c7358e

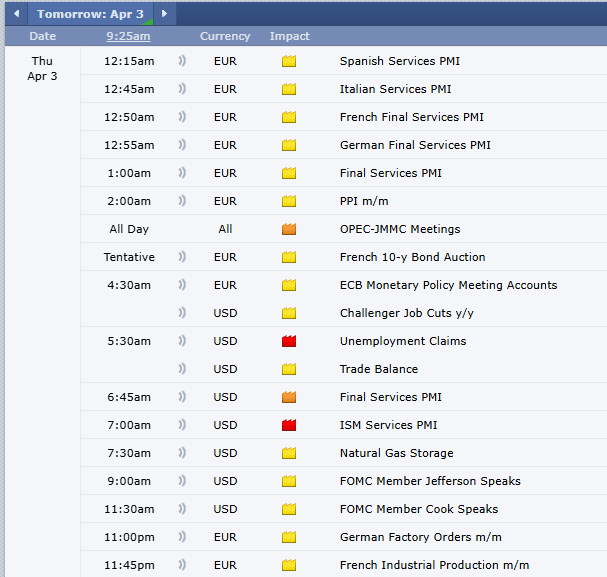
Want to feature our updated trading levels on your website? Simply paste a small code, and they’ll update automatically every day! Click here for quick and easy instructions.

Economic Reports

provided by: ForexFactory.com

All times are Eastern Time (New York)
1a53f80c dac5 4007 856d 522401c8cad2

Find us on Trustpilot

stars

Trading Futures, Options on Futures, and retail off-exchange foreign currency transactions involves substantial risk of loss and is not suitable for all investors. You should carefully consider whether trading is suitable for you in light of your circumstances, knowledge, and financial resources. You may lose all or more of your initial investment. Opinions, market data, and recommendations are subject to change at any time.

Call Now

Join our Private Facebook group

Subscribe to our YouTube Channel

Listen to our podcast: Subscribe on AppleSpotify, Amazon

or wherever you listen to podcasts!

S
Facebook  Instagram  LinkedIn
S
ef3ab1c9 8d6d 4e60 a3f1 af5d9d4ecbb3
Services
Software
Tools
Community
Contact


Micro E-Mini & Micro Grains: Expanding Futures Trading Flexibility

7cfe5b36 db9f 4933 824a 7f264613e7fe

Cannon Futures Weekly Letter

In Today’s Issue #1232

Micro Grains in the Spotlight!

micro grains

  • MICRO Grains are available!

  • The Week Ahead – Non Farm Payrolls, Powell Speaking & More Volatility
  • Futures 102 – Understanding MICRO e-minis
  • Hot Market of the Week – May Cotton
  • Broker’s Trading System of the Week – ES intraday System
  • Trading Levels for Next Week
  • Trading Reports for Next Week

Micro Grains are available:

Micro Grains: This permanent demo is available to all clients using the StoneX futures ( CQG desktop) platform as long as you have a balance.

CME Group, the world’s leading derivatives marketplace, announced in late January that it will launch a suite of micro grain and oilseed futures contracts. These contracts will be cash-settled and be one-tenth the size of the exchange’s Corn, Wheat, Soybean, Soybean Oil and Soybean Meal futures contracts.

Their first day of trading was this last Monday, Feb. 24.

Quoting John Ricci, Managing Director and Global Head of Agriculture from CME Group’s press release: “Our benchmark grain and oilseed futures products are the most liquid and highly-utilized markets in global agriculture today. These smaller-sized contracts will provide additional flexibility for market participants to manage their agricultural portfolios with greater precision.”

Micro Corn, Wheat, Soybean, Soybean Oil and Soybean Meal futures will be listed by and subject to the rules of CBOT. For more information and additional contract specs, please visit www.cmegroup.com/microags.

Important Notices: The Week Ahead

By John Thorpe, Senior Broker

Final Week of Standard time in the U.S. “Spring Forward!”

More volatility to come as next week all markets will be reacting to the potential for tariff implementations creating uncertainty in the marketplace. Therefore, increased volatility expectations.

Highlights next week will also include Nonfarm Payrolls on Friday prior to cash market open. 9 fed speakers including Fed Chair J. Powell on Friday morning as earnings reports begin dwindling with 378 total reports while we are in the 8th inning of earnings season, the reports will be impacting the indices much less than in past weeks.

Earnings Next Week:

  • Mon. quiet
  • Tue. Crowdstrike post close
  • Wed. quiet
  • Thu.  Costco and Broadcom post close
  • Fri. quiet

FED SPEECHES:

  • Mon. Musalem 10:35 am CST
  • Tues. Williams 1:20 pm CST
  • Wed. quiet
  • Thu. Waller 2:30 pm CST, Bostic 5:00 pm CST
  • Fri. Bowman 9:15 am, Williams 9:45 am, Kugler 11:20 pm, Fed Chair J. Powell 11:30 am, Kugler 12:00 pm all times CST.

Economic Data week:

  • Mon. S&P Global Mfg. PMI, ISM Mfg. PMI,
  • Tue. RedBook,
  • Wed. ADP, S&P Global Svcs. PMI, Factory orders, ISM Svcs. PMI, EIA Crude Inventories, Biege Book
  • Thur. Balance of Trade, Initial Jobless Claims, EIA Nat Gas
  • Fri Non-Farm Payrolls

Futures 102: MICRO E-Mini Futures

Course Overview

The next big thing in equities trading

This course will provide insight into the Micro E-mini futures, including a size comparison to classic E-mini contracts, a look at enhanced exposure and the benefits Micro E-mini futures can offer you.

More precisely hedge index exposure and manage your positions with more versatility, since Micro E-mini futures are fungible with classic E-mini contracts. Even get examples of how to hedge more precisely with Micro E-mini futures.

Start Now

86f2e3ec 9c49 4bd2 89d9 7befc0cc21cc

Hot Market of the Week

Hot market of the week is provided by QT Market Center, A Swiss army knife charting package that’s not just for Hedgers, Cooperatives and Farmers alike but also for Spread traders, Swing traders and shorter time frame application for intraday traders with a unique proprietary indicator that can be applied to your specific trading needs.

Free Trial Available

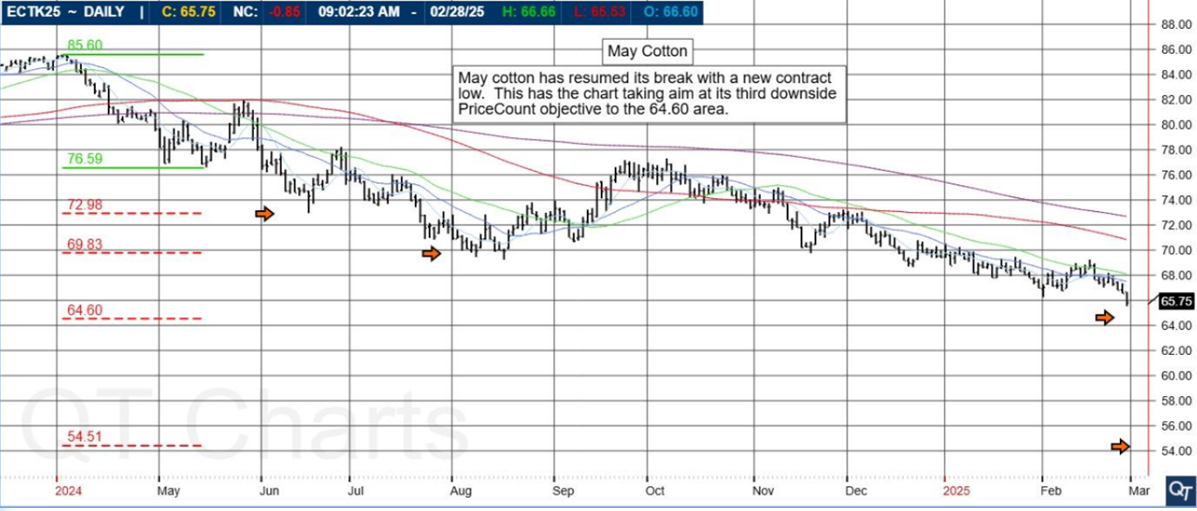
May Cotton

May cotton has resumed its break with a new contract low. This has the chart taking aim at its third downside PriceCount objective to the 64.60 area.

PriceCounts – Not about where we’ve been, but where we might be going next!

3abb5289 c185 436f 8a31 470ddf1626b1

The PriceCount study is a tool that can help to project the distance of a move in price. The counts are not intended to be an ‘exact’ science but rather offer a target area for the four objectives which are based off the first leg of a move with each subsequent count having a smaller percentage of being achieved. It is normal for the chart to react by correcting or consolidating at an objective and then either resuming its move or reversing trend. Best utilized in conjunction with other technical tools, PriceCounts offer one more way to analyze charts and help to manage your positions and risk. Learn more at www.qtchartoftheday.com

Trading in futures, options, securities, derivatives or OTC products entails significant risks which must be understood prior to trading and may not be appropriate for all investors. Past performance of actual trades or strategies is not necessarily indicative of future results.

Brokers Trading System of the Week

With algorithmic trading systems becoming more prevalent in portfolio diversification, the following system has been selected as the broker’s choice for this month.

ES NZL

The NZL automated trading system utilizes two main ALGOS in an attempt to identify either an early trend in the trading day and/or high percentage counter trend set ups.

The system is fully automated and runs between the hours of 4 AM central and 3:15 PM Central.

The model relies on volume charts rather than time charts.

PRODUCT

Mini SP500

SYSTEM TYPE

Day Trading

Recommended Cannon Trading Starting Capital

$36,000

COST

USD 199 / monthly

Get Started


Learn More

9fef8d53 525b 45f2 b9db 332eb03b0be2

The performance shown above is hypothetical in that the chart represents returns in a model account. The model account rises or falls by the average single contract profit and loss achieved by clients trading actual money pursuant to the listed system’s trading signals on the appropriate dates (client fills), or if no actual client profit or loss available – by the hypothetical single contract profit and loss of trades generated by the system’s trading signals on that day in real time (real‐time) less slippage, or if no real time profit or loss available – by the hypothetical single contract profit and loss of trades generated by running the system logic backwards on back adjusted data. Please read full disclaimer HERE.

Would you like to get weekly updates on real-time, results of systems mentioned above?
Yes
No

Trading Levels for Next Week

Daily Levels for March 3rd, 2025

23ee993f 9811 4e0b 815b c084934e8413

Would you like to receive daily support & resistance levels?
Yes
No

Trading Reports for Next Week

First Notice (FN), Last trading (LT) Days for the Week:

www.mrci.com

5f3f9608 8bcb 46c6 96aa 982f2dbd9452

Find us on Trustpilot

stars

Trading Futures, Options on Futures, and retail off-exchange foreign currency transactions involves substantial risk of loss and is not suitable for all investors. You should carefully consider whether trading is suitable for you in light of your circumstances, knowledge, and financial resources. You may lose all or more of your initial investment. Opinions, market data, and recommendations are subject to change at any time.

Call Now

Join our Private Facebook group

Subscribe to our YouTube Channel

Listen to our podcast: Subscribe on AppleSpotify, Amazon

or wherever you listen to podcasts!

S
Facebook  Instagram  LinkedIn
S
ef3ab1c9 8d6d 4e60 a3f1 af5d9d4ecbb3
Services
Software
Tools
Community
Contact

Market Prep: Last Trading Day of February, March Bitcoin, PCE Report & Key Trading Checklist

9dc1e02e d5f7 4ff4 abf7 1df60775f196

Different Markets for Day Trading, March Bitcoin

bitcoin

March Bitcoin:

Tomorrow is the last trading day for February. Last and first trading days of the months can at times be more volatile and at times have a chance to become a trending day.

Also tomorrow is PCE ( Personal Consumption Expenditures, an inflation indicator watched closely by the market).

Last but not least if you are trading bonds and ten years, time to trade the June contract.

Day Trading

Trader’s Check List:

·        Review prior day statement

·        Check for any working orders on your platforms.

·        Be aware of contract rollover dates

·        Set a daily loss limit and learn NOT to overtrade

·        Understand what reports are coming out today

·        Make sure you are not distracted

·        Calculate appropriate trading size based on current volatility and account size

·        Start with Larger Time Frame charts to get proper perspective

·        Understand what your goal is

·        Measure your success or lack of

·        Spend time furthering your trading education and exploring different methods

·        Put trading in perspective and make sure the overall psychology of trading fits you.


S

March Bitcoin

The rally in March bitcoin ran out of momentum, leaving behind an interim top in December. Now, on the correction lower, the chart has activated downside PriceCount objectives. The first count has been completed. IF you can sustain further weakness, the second count would project a possible slide to the 76,000 area..

964ffdda 6c6b 447f a377 c47390d188b4

Daily Levels for February 28th, 2025

2dd5bf25 7ac5 4668 9624 5eecd10591e5

822b33c5 2339 45ed bc84 e9c8f8c7358e

Economic Reports

provided by: ForexFactory.com

All times are Eastern Time (New York)

0ef41bbc 8759 4468 855c 88e394e6d1e4

Find us on Trustpilot

stars

Trading Futures, Options on Futures, and retail off-exchange foreign currency transactions involves substantial risk of loss and is not suitable for all investors. You should carefully consider whether trading is suitable for you in light of your circumstances, knowledge, and financial resources. You may lose all or more of your initial investment. Opinions, market data, and recommendations are subject to change at any time.

Call Now

Join our Private Facebook group

Subscribe to our YouTube Channel

Listen to our podcast: Subscribe on AppleSpotify, Amazon

or wherever you listen to podcasts!

S
Facebook  Instagram  LinkedIn
S
ef3ab1c9 8d6d 4e60 a3f1 af5d9d4ecbb3
Services
Software
Tools
Community
Contact