
NFP – Non Farm Payrolls Tomorrow

|
|||||||||||||||||||||||||||||||||||||||||||||||||||||||||||
|
|||||||||||||||||||||||||||||||||||||||||||||||||||||||||||
|
Trading guide, as you can understand from the term, is a compilation of tips and tricks that can help you in trading. Whether you are new to the world of trading or are an expert in it, a trading guide is a very useful document.
Moreover, every trading guide has a specific purpose. So, if you are thinking about trading, a trade guide will serve you like a self-help manual. So, whether it is about trading options, metals, grains or any other futures contract– a trading guide has all the information in it.
You don’t need to buy one, for you will able to find a number of them online. We at Cannon Trading help you make the most of your trading ventures. Therefore, we have compiled some of the best trading guides for you to learn from. Listed under this category archive are some trade guides using which you can use to help you succeed in many trading ventures. There is enough information in these guides that can help you master the art of trading futures and options smartly.


|
|||||||||||||||||||||||||||||||||||||||||||||||||||||||||||
|
|||||||||||||||||||||||||||||||||||||||||||||||||||||||||||
|

|
||||||||||||||||||||||||||||||||||||||||||||||||||||||||||||||||||
|
||||||||||||||||||||||||||||||||||||||||||||||||||||||||||||||||||
|
In the dynamic world of online futures trading platforms, few names stand out as boldly as MotiveWave. As technology continues to evolve, traders demand more robust, analytical, and user-friendly tools. The MotiveWave Futures Trading Platform meets these demands head-on, delivering a comprehensive suite of features that elevate the trading experience for both novice and professional futures traders alike.
This article provides a deep dive into the MotiveWave trading environment, highlights key features that make it a premier choice for futures trading, and explores why Cannon Trading Company is the ultimate partner for leveraging MotiveWave’s power.
What is MotiveWave?
MotiveWave is a professional-grade futures trading platform known for its advanced charting tools, algorithmic trading capabilities, and comprehensive market analysis features. Initially gaining traction among forex and equity traders, MotiveWave has carved a prominent space within the online futures trading platform sector due to its reliability and feature-rich design.
Whether you’re focused on short-term scalping or long-term market trend analysis, MotiveWave trading tools are tailored to adapt to your trading style. From MotiveWave mobile access to full desktop integration via MotiveWave download, the platform ensures seamless continuity for traders on the move. Additionally, it supports custom workspaces and scripting with Java-based extensions, further enhancing the functionality for sophisticated trading needs.
Most Important Features for Futures Trading on MotiveWave
Accessing your trading environment is easy with the MotiveWave login process. The interface is secured with two-factor authentication, ensuring your data and trading activities are protected. Users can customize their workspace upon login, allowing for a personalized experience that matches individual trading preferences.
The MotiveWave download is available directly from the official website. Installation is straightforward, with support available for Windows, macOS, and Linux operating systems. Regular updates ensure the platform remains secure and compatible with the latest system features.
A common query among new users is: Is MotiveWave free? While MotiveWave offers a free trial version, its full capabilities are unlocked through tiered pricing plans. This freemium model allows users to test the interface and decide on the best plan that suits their trading needs. Considering its robust toolset, the MotiveWave price offers excellent value compared to competitors.
There are also occasional promotions through partners like Cannon Trading, which may include extended trial periods or discounted subscriptions. This makes testing the MotiveWave trading experience even more accessible.

Choosing the right brokerage is as crucial as selecting the right futures trading platform. Cannon Trading Company excels in this regard. Here’s why:
MotiveWave Review Summary
The feedback from users paints a highly favorable MotiveWave review. Traders cite the platform’s depth of analysis, customizability, and professional-grade tools as reasons for their loyalty. Whether evaluating MotiveWave software for the first time or switching from another futures trading platform, users consistently highlight its seamless performance and insightful analytics.
Professional traders appreciate how MotiveWave trading aligns with institutional tools, while new users benefit from the clear documentation and visual guides. This inclusivity ensures a smoother learning curve, especially when paired with educational materials from Cannon Trading.
Furthermore, the synergy between MotiveWave and Cannon Trading amplifies the platform’s benefits. Combining advanced technology with decades of industry expertise creates a powerful trading environment that is both innovative and secure.
The MotiveWave Futures Trading Platform stands out in a crowded marketplace by offering unparalleled features, powerful analytical tools, and wide-ranging compatibility. The repeated queries of MotiveWave login, MotiveWave price, and MotiveWave download are justified by the platform’s capabilities and reliability. While MotiveWave mobile ensures traders are never disconnected, the question “Is MotiveWave free” is best answered by its generous trial options and value-packed pricing tiers.
When partnered with a top-tier brokerage like Cannon Trading Company, traders gain access to world-class tools, unbeatable service, and a trusted advisor in their futures trading journey. If you’re looking to elevate your futures trading game, MotiveWave combined with Cannon Trading is a combination worth serious consideration.
For more information, click here.
Ready to start trading futures? Call us at 1(800)454-9572 (US) or (310)859-9572 (International), or email info@cannontrading.com to speak with one of our experienced, Series-3 licensed futures brokers and begin your futures trading journey with Cannon Trading Company today.
Disclaimer: Trading Futures, Options on Futures, and retail off-exchange foreign currency transactions involve substantial risk of loss and are not suitable for all investors. Past performance is not indicative of future results. Carefully consider if trading is suitable for you in light of your circumstances, knowledge, and financial resources. You may lose all or more of your initial investment. Opinions, market data, and recommendations are subject to change at any time.
Important: Trading commodity futures and options involves a substantial risk of loss. The recommendations contained in this article are opinions only and do not guarantee any profits. This article is for educational purposes. Past performances are not necessarily indicative of future results.
This article has been generated with the help of AI Technology and modified for accuracy and compliance.
Follow us on all socials: @cannontrading

|
|
|
|
|
|
|
|
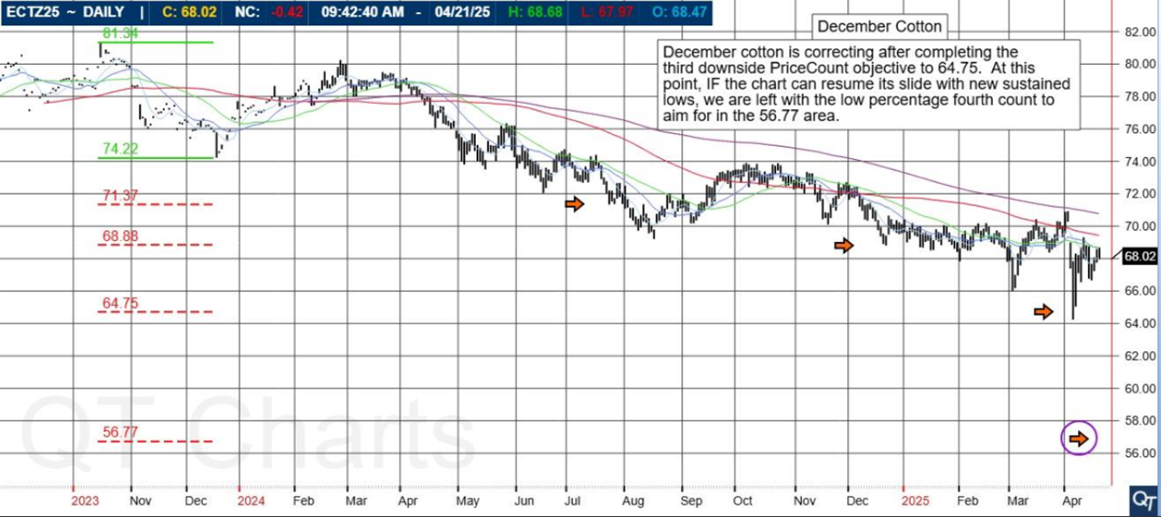
The PriceCount study is a tool that can help to project the distance of a move in price. The counts are not intended to be an ‘exact’ science but rather offer a target area for the four objectives which are based off the first leg of a move with each subsequent count having a smaller percentage of being achieved.
It is normal for the chart to react by correcting or consolidating at an objective and then either resuming its move or reversing trend. Best utilized in conjunction with other technical tools, PriceCounts offer one more way to analyze charts and help to manage your positions and risk. Learn more at www.qtchartoftheday.com
Trading in futures, options, securities, derivatives or OTC products entails significant risks which must be understood prior to trading and may not be appropriate for all investors. Past performance of actual trades or strategies is not necessarily indicative of future results.
|
|||||||||||||||||||||||||||||||||||||||||||||||||||||||||||||||||||||
|
|||||||||||||||||||||||||||||||||||||||||||||||||||||||||||||||||||||
|


Day Trading margins are back to normal!
However, with volatility, you need to double check the status daily at:
Below you will see a quick video on how to set and utilize the bracket orders feature on the StoneX futures platform/ CQG desktop
July soybean oil is challenging overhead that has contained the upside for an extended period of time. IF the chart can break out into new sustained highs, the third upside PriceCount objective would project a possible run to the 53.77 area.
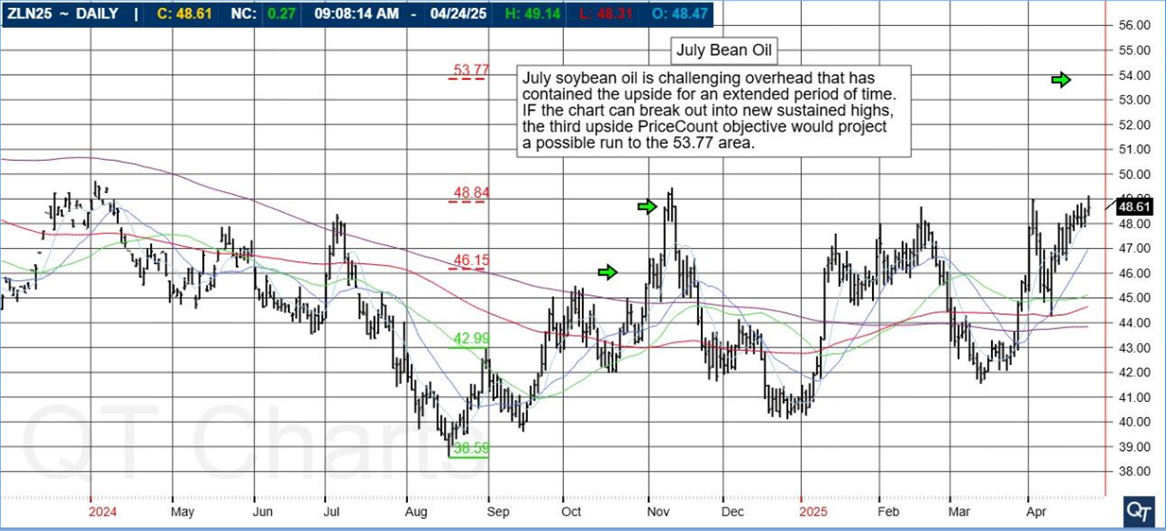
The PriceCount study is a tool that can help to project the distance of a move in price. The counts are not intended to be an ‘exact’ science but rather offer a target area for the four objectives which are based off the first leg of a move with each subsequent count having a smaller percentage of being achieved.
It is normal for the chart to react by correcting or consolidating at an objective and then either resuming its move or reversing trend. Best utilized in conjunction with other technical tools, PriceCounts offer one more way to analyze charts and help to manage your positions and risk.
Learn more at www.qtchartoftheday.com
Trading in futures, options, securities, derivatives or OTC products entails significant risks which must be understood prior to trading and may not be appropriate for all investors. Past performance of actual trades or strategies is not necessarily indicative of future results.

provided by: ForexFactory.com
All times are Eastern Time (New York)

|
||||||||||||||||||||||||||||
|
||||||||||||||||||||||||||||
|

|
|
|
|
|
|
|
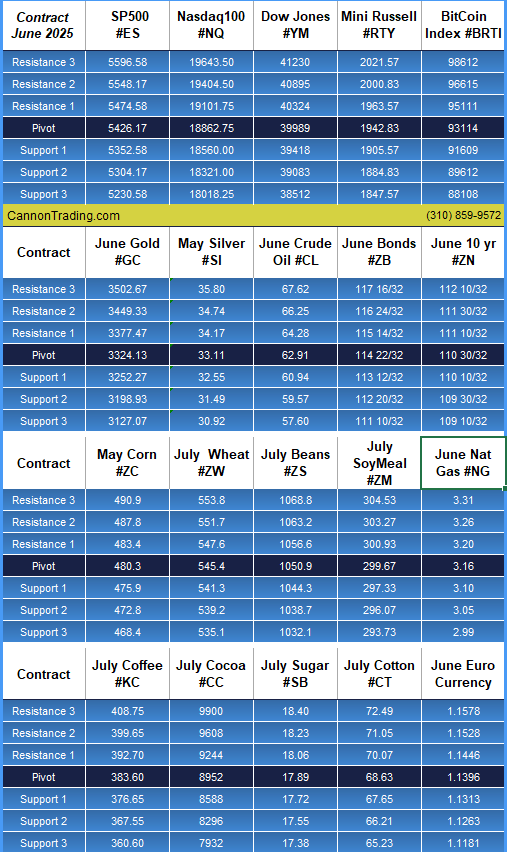

provided by: ForexFactory.com
All times are Eastern Time (New York)
|
||||||||||||||||||||||||||||
|
||||||||||||||||||||||||||||
|


By John Thorpe, Senior Broker
|
|
|
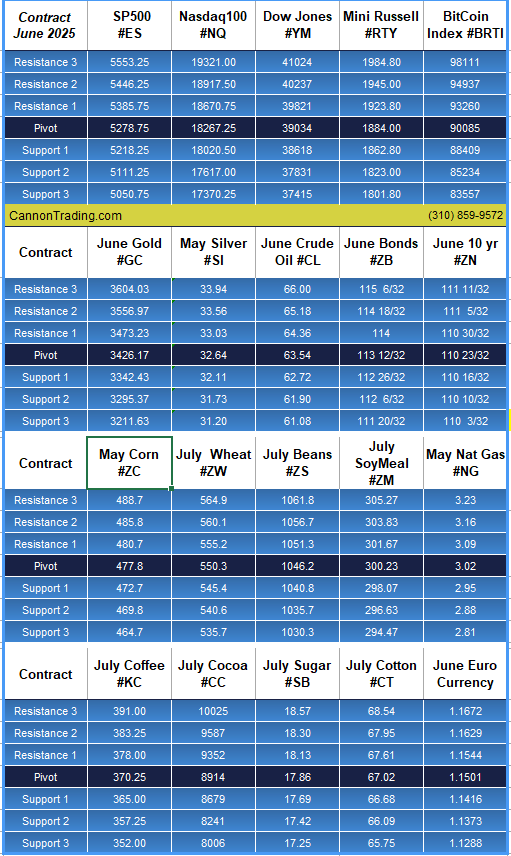

provided by: ForexFactory.com
All times are Eastern Time (New York)
|
||||||||||||||||||||||||||||
|
||||||||||||||||||||||||||||
|


|
December cotton is correcting after completing the third downside PriceCount objective to 64.75. At this point, IF the chart can resume its slide with new sustained lows, we are left with the low percentage fourth count to aim for in the 56.77 area.

provided by: ForexFactory.com
All times are Eastern Time (New York)
|
||||||||||||||||||||||||||||
|
||||||||||||||||||||||||||||
|
Futures trading, a cornerstone of global financial markets, demands precision, foresight, and agility. In this high-stakes arena, the best futures brokers serve as indispensable allies for retail and institutional traders alike. These brokers facilitate access to markets, provide vital data and analysis tools, offer risk management solutions, and help ensure compliance with complex regulatory frameworks. In the 2020s, the criteria for what constitutes the best futures broker have evolved, shaped by technological advances, user expectations, and heightened competition.
This paper will assess the evolving role of the best futures brokers, the innovations that streamline trading futures, and the defining features that make firms like Cannon Trading Company industry leaders. Special emphasis will be placed on how brokers have consistently met the shifting demands of traders, serving as both enablers and educators in an increasingly complex market environment.
To understand the appeal and necessity of the best futures brokers, it is essential to define the criteria by which they are judged. Traders today demand more than simple execution services; they expect comprehensive support, from educational resources to advanced trading platforms.
Key characteristics of the best futures brokers include:
These features define not only competence but resilience and versatility—qualities essential for enduring success in futures trading.
The 2020s have seen an explosion in fintech innovations that reshape the futures trading landscape. Technologies like artificial intelligence (AI), algorithmic trading, cloud-based platforms, and mobile accessibility have significantly enhanced both the trader’s and broker’s capabilities.
The best futures brokers leverage these technologies not just as features but as integral components of the client experience, transforming how traders interact with global futures markets.
As futures trading attracts a new wave of retail participants, education becomes a crucial broker responsibility. Futures 101 resources—ranging from video tutorials to live webinars and downloadable guides—are now standard offerings among the best online futures brokers.
These educational tools serve dual purposes:
A best futures broker doesn’t just execute trades; it mentors. With futures 101 content, traders are better equipped to understand contracts, margin requirements, rollover processes, and technical indicators.
Founded in Los Angeles, California, Cannon Trading Company exemplifies what it means to be a best futures broker. With decades of experience and an unwavering commitment to client satisfaction, Cannon Trading seamlessly combines old-school integrity with modern innovation.
Through its commitment to education, support, and technology, Cannon Trading has proven itself one of the best online futures brokers time and time again.
A critical element that separates a best futures broker from mediocre alternatives is regulatory compliance. Futures trading is governed by organizations such as the Commodity Futures Trading Commission (CFTC) and the National Futures Association (NFA). These bodies ensure that brokers uphold financial solvency, ethical conduct, and client transparency.
Cannon Trading Company’s spotless record and industry acknowledgment affirm its role as a regulatory role model. In an industry where even minor infractions can erode trust, Cannon’s adherence to stringent compliance is a major reason it remains a best futures broker in both reputation and results.
Traders today are increasingly guided by peer reviews and public ratings. Sites like TrustPilot offer transparent assessments of broker performance. Cannon Trading’s consistent 5-star ratings indicate more than just satisfaction—they signal reliability, accessibility, and ethical business practices.
These reviews often cite attributes such as:
These features not only satisfy user expectations but elevate Cannon Trading into the echelon of best futures brokers recognized globally.
The provision of free, high-performing trading platforms is a major differentiator in the competitive landscape. Cannon Trading offers multiple FREE platforms, catering to different trading styles—scalping, day trading, swing trading, and algorithmic trading.
Free platforms lower the barrier to entry, especially for retail traders exploring futures 101. Whether it’s desktop terminals, mobile apps, or web-based dashboards, the ability to choose empowers traders.
The best online futures broker knows that platform variety translates to trader versatility. Cannon’s approach reflects this understanding, providing tools that are robust yet intuitive.
Another defining trait of the best futures brokers is their ability to retain clients over the long term. In a world where many traders jump between brokers, those who remain loyal to firms like Cannon Trading Company do so because of the personalized attention they receive. Unlike impersonal trading apps, Cannon’s brokers invest in relationships, offering real-time consultations, strategy refinement, and customized platform recommendations. This high-touch approach resonates with clients who seek more than automation—those who value human insight and bespoke service.
Such personalization often translates into loyalty, and loyalty builds longevity. Cannon Trading’s decades-long presence in the futures trading space attests to the power of consistent client satisfaction. Traders who began with Cannon decades ago often remain clients today, having experienced firsthand the firm’s ongoing evolution and responsiveness to changing market needs.
Futures trading is no longer confined to a single geographic region. Thanks to globalization and 24/7 digital connectivity, traders from across the globe now engage with U.S. futures markets. The best online futures brokers, therefore, must offer multilingual support, multi-currency account options, and adaptable trading hours to accommodate this global user base.
Cannon Trading has adeptly embraced this reality. By offering accessible platforms and client support tailored to international users, the firm demonstrates that geographic boundaries are no barrier to service excellence. This global approach helps cement its reputation as a best futures broker, relevant not just domestically but on the world stage.
Looking ahead, the best futures brokers will continue to lead through innovation and foresight. As blockchain technology, decentralized finance (DeFi), and AI-powered analytics become more embedded in trading practices, brokers must evolve to remain relevant. Firms like Cannon Trading are already exploring these domains, ensuring that their platforms and tools remain ahead of the curve.
Furthermore, ESG (Environmental, Social, Governance) investing principles are making their way into derivatives markets. Forward-thinking brokers will need to align with these values, providing futures products that cater to socially conscious traders. The best futures brokers will remain agile, adapting not only to technology but to the moral and strategic priorities of future traders.
As financial markets grow in complexity, the need for the best futures brokers becomes increasingly apparent. These firms are more than facilitators; they are educators, innovators, and trusted allies. Through technological innovation, regulatory integrity, and a client-first philosophy, brokers like Cannon Trading Company prove their enduring value.
Cannon Trading embodies every hallmark of a best futures broker—from its impressive TrustPilot ratings to its decades of industry leadership. As traders continue navigating the evolving landscape of trading futures, the role of brokers will remain central. Cannon Trading and others like it will continue to lead the charge, setting new standards for excellence in futures trading.
For more information, click here.
Ready to start trading futures? Call us at 1(800)454-9572 (US) or (310)859-9572 (International), or email info@cannontrading.com to speak with one of our experienced, Series-3 licensed futures brokers and begin your futures trading journey with Cannon Trading Company today.
Disclaimer: Trading Futures, Options on Futures, and retail off-exchange foreign currency transactions involve substantial risk of loss and are not suitable for all investors. Past performance is not indicative of future results. Carefully consider if trading is suitable for you in light of your circumstances, knowledge, and financial resources. You may lose all or more of your initial investment. Opinions, market data, and recommendations are subject to change at any time.
Important: Trading commodity futures and options involves a substantial risk of loss. The recommendations contained in this article are opinions only and do not guarantee any profits.

|
|
|
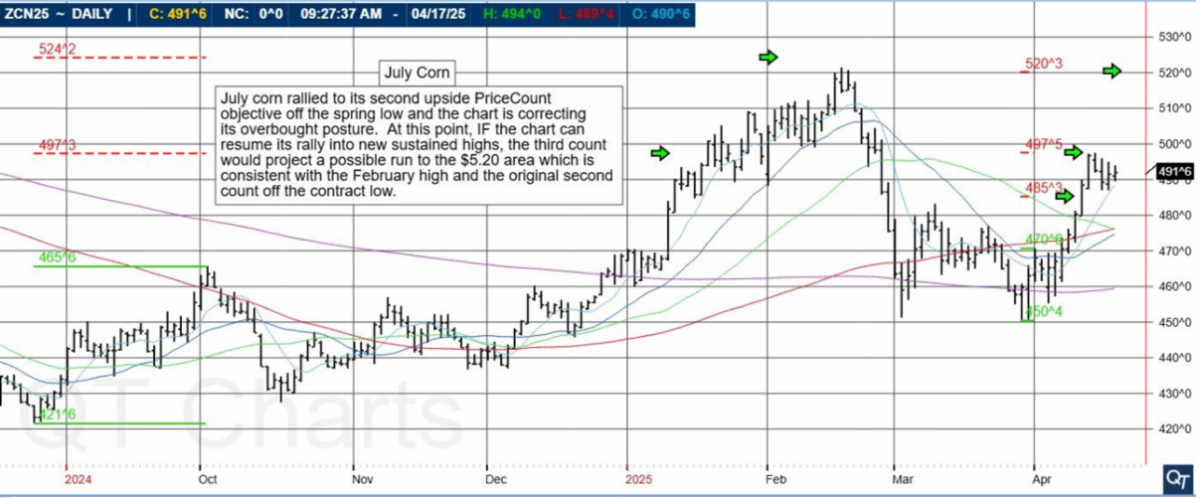
July corn rallied to its second upside PriceCount objective off the spring low and the chart is correcting its overbought posture. At this point, IF the chart can resume its rally into new sustained highs, the third count would project a possible run to the $5.20 area which is consistent with the February high and the original second count off the contract low.
The PriceCount study is a tool that can help to project the distance of a move in price. The counts are not intended to be an ‘exact’ science but rather offer a target area for the four objectives which are based off the first leg of a move with each subsequent count having a smaller percentage of being achieved.
It is normal for the chart to react by correcting or consolidating at an objective and then either resuming its move or reversing trend. Best utilized in conjunction with other technical tools, PriceCounts offer one more way to analyze charts and help to manage your positions and risk.
Learn more at www.qtchartoftheday.com
Trading in futures, options, securities, derivatives or OTC products entails significant risks which must be understood prior to trading and may not be appropriate for all investors. Past performance of actual trades or strategies is not necessarily indicative of future results.
provided by: ForexFactory.com
All times are Eastern Time (New York)

|
||||||||||||||||||||||||||||
|
||||||||||||||||||||||||||||
|