Gold Soars, Wheat Shrinks: 7 Powerful Stats from a Wild Trading Day

9dc1e02e d5f7 4ff4 abf7 1df60775f196

Turbulence in Equities & Commodities

Gold & Wheat, Emini S&P COTD

Buckle your seatbelts, Turbulence in equities and Commodities

By John Thorpe, Senior Broker

Please speak with your broker about ways that you may not be aware of to assist you with your risk management plans. They may surprise you with the creative solutions you may find more efficient than simple stop orders or the old “hand on the mouse blow yourself out” strategy.

Wheat

wheat

Why the turbulence in the Grain markets? USDA prospective plantings report was revealed, although largely in line with expectations, it’s a surprise that planted acres are down for soybeans, wheat and 12% lower for cotton while farmers are switching out of beans and planting corn instead, as seed and fertilizer costs are lower for these compliments in production.

Wheat for all winter varieties planted is the second smallest crop since records have been kept from 1919. The weather market begins now in earnest for the Wheat complex for the next 8 weeks.

    Market volatility is here to stay for the foreseeable future

Choose your opportunities wisely.

 What in the world was going on with equity prices today, first the big dump was attributed to Liberation Tariff Day, coined by the media, only to see the markets stage a brave comeback against all talking point odds! Was this merely a technical correction? Or a combination of oversold and some positive tariff news?

 Mini Dow’s range today? 786 points $value? = $3930.00 from hi to lo

  Mini S & P’s range today? 111.25 points $ Value? = $5562.50 from hi to lo

Mini Nasdaq’s range today? 439 points $value? = 8785.00 from hi to lo

How Gold is your Portfolio?

Gold

gold nugg

All-time highs in gold today. 3162.00 per troy gold ounce currently trading @ 3155.00 + over $40.00 per gold oz. yet the industrial metals were negative today, Dr. Copper and Silver. We offer all exchange traded contract sizes, from 1 oz to 100 ounces.

Secondary tariffs on Russian oil talk had the Crude oil futures up over $2 per bbl safely above the $70.00 /bbl price level.

Tomorrow:

Econ Data:  Redbook, ISM Mfg. Final, JOLTS, Dallas Fed.

FED Speak: Quiet

Earnings: Quiet

Tariff news: Anything goes!

June Emini S&P

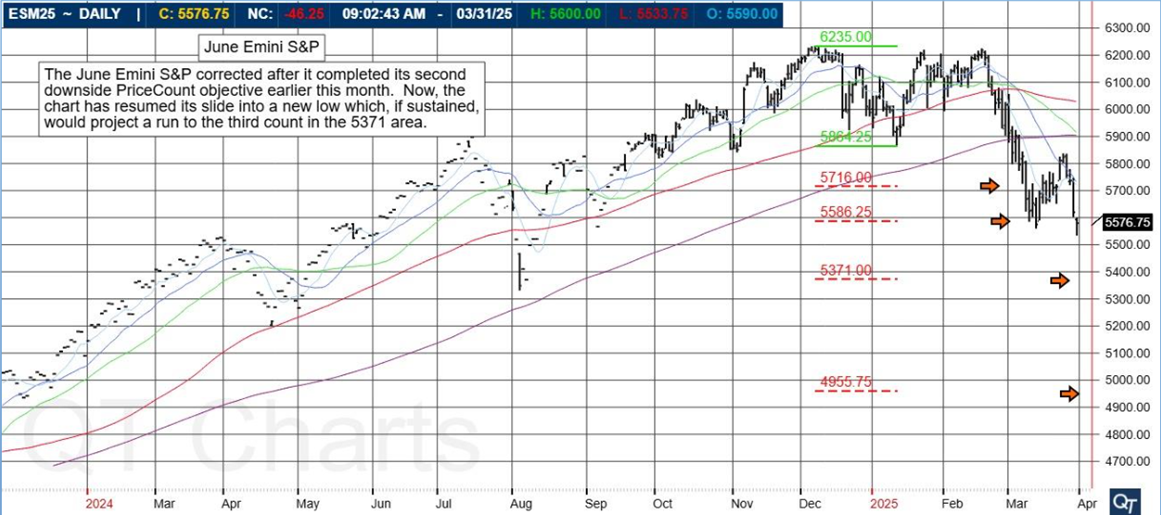
The June Emini S&P corrected after it fompleted its second downside PriceCount objective earlier this month. Now, the chart has resumed its slide into a new low which, if sustained, would project a run to the third count in the 5371 area.
6dfca21b 9511 45be b78f 66b38af600f1

Emini

Chart above is provided by QT Market Center, A Swiss army knife charting package that’s not just for Hedgers, Cooperatives and Farmers alike but also for Spread traders, Swing traders and shorter time frame application for intraday traders with a unique proprietary indicator that can be applied to your specific trading needs.

Free Trial Available

The PriceCount study is a tool that can help to project the distance of a move in price. The counts are not intended to be an ‘exact’ science but rather offer a target area for the four objectives which are based off the first leg of a move with each subsequent count having a smaller percentage of being achieved.

It is normal for the chart to react by correcting or consolidating at an objective and then either resuming its move or reversing trend. Best utilized in conjunction with other technical tools, PriceCounts offer one more way to analyze charts and help to manage your positions and risk.

Learn more at www.qtchartoftheday.com

Trading in futures, options, securities, derivatives or OTC products entails significant risks which must be understood prior to trading and may not be appropriate for all investors. Past performance of actual trades or strategies is not necessarily indicative of future results.
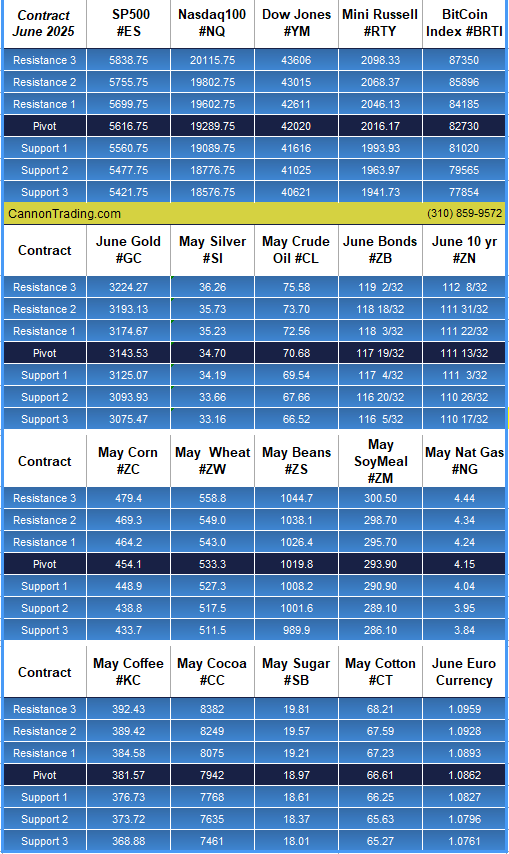
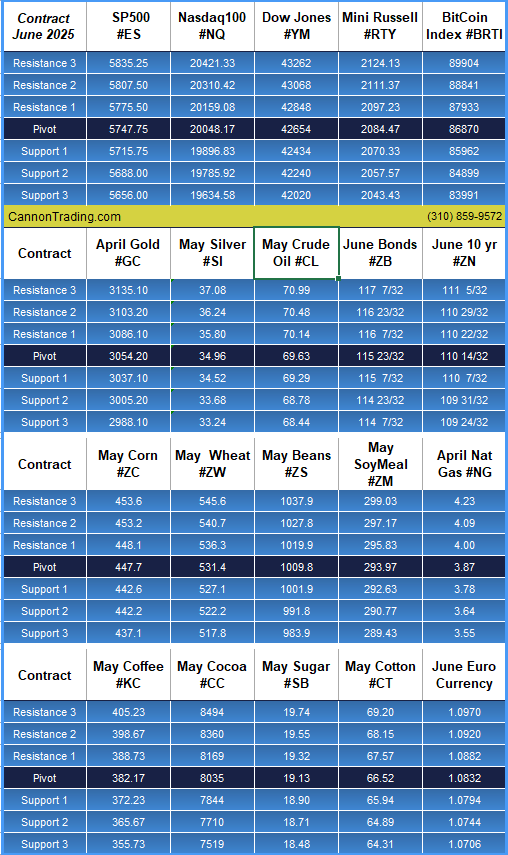
Daily Levels for April 1st, 2025

35cfa502 7631 46b8 a728 7d67424929ec

Want to feature our updated trading levels on your website? Simply paste a small code, and they’ll update automatically every day!

 Click here for quick and easy instructions.

822b33c5 2339 45ed bc84 e9c8f8c7358e

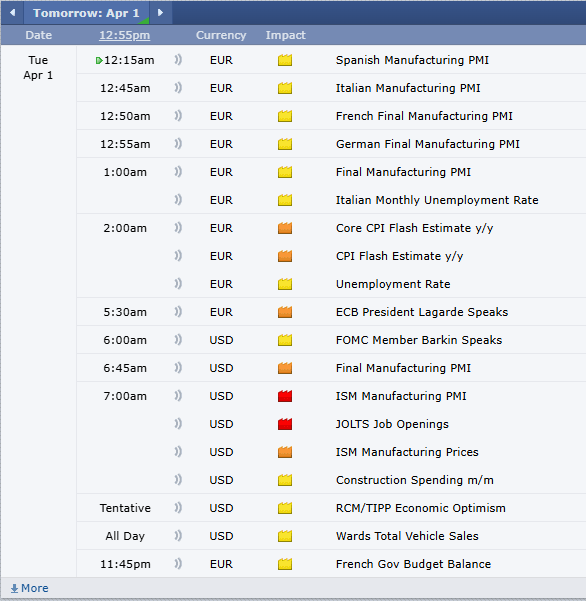
Economic Reports

provided by: ForexFactory.com

All times are Eastern Time (New York)
4a8c4696 3d99 4100 b8f3 fe3b0ae2d6d4

Find us on Trustpilot

stars

Trading Futures, Options on Futures, and retail off-exchange foreign currency transactions involves substantial risk of loss and is not suitable for all investors. You should carefully consider whether trading is suitable for you in light of your circumstances, knowledge, and financial resources. You may lose all or more of your initial investment. Opinions, market data, and recommendations are subject to change at any time.

Call Now

Join our Private Facebook group

Subscribe to our YouTube Channel

Listen to our podcast: Subscribe on AppleSpotify, Amazon

or wherever you listen to podcasts!

S
Facebook  Instagram  LinkedIn
S
ef3ab1c9 8d6d 4e60 a3f1 af5d9d4ecbb3
Services
Software
Tools
Community
Contact

USDA, Non Farm Payroll, & Powell; 3 Poised to Drive Market Volatility in Triple Threat!

7cfe5b36 db9f 4933 824a 7f264613e7fe

USDA

Cannon Futures Weekly Letter

In Today’s Issue #1236

  • The Week Ahead – Non-Farm Payroll, Prospective Plantings and Fed Chair Powell
  • Futures 102 – Intro to Crude Oil Futures
  • Hot Market of the Week – Bloomberg Commodity (CRB) Index
  • Broker’s Trading System of the Week – Combo Breakout Swing System
  • Trading Levels for Next Week
  • Trading Reports for Next Week

Non Farm Payroll Friday!

non farm payroll

June gold is front month!

Important Notices: The Week Ahead

By John Thorpe, Senior Broker

USDA, Non Farm Payroll, Prospective Plantings and Fed Chair Powell?

USDA

One of the most impactful Agricultural reports of the year will be released Monday at 11:00 am CDT. The Prospective Plantings report and Grain Stocks released by the USDA will offer a needed insight into prospective acreage plantings for grains and oilseeds.

I have included commentary from The Progressive Farmers’ DTN top analyst for your review: DTN Pre-Report analysis

usda

More volatility to come as next week all markets will be reacting, as they have been, to the Global Tariff talk.

Non Farm Payroll

Highlights next week will include the aforementioned Grain report. Non farm Payroll (NFP) Friday followed by Fed Chair J. Powell and other Fed Speakers. This may be the final Q4 2024 Earnings guidance as we will see a mere 67 releases the entire week.

USDA, Non Farm Payroll

 Earnings Next Week:

  • Mon. Quiet
  • Tue. Quiet
  • Wed. Quiet
  • Thu. Conagra, Constellation Brands
  • Fri. Quiet

FED SPEECHES:

  • Mon.    Bostic 12:45 CDT, Barr 2:10 CDT,
  • Tues.    Kugler 7:40 CDT, Williams 8:05 CDT ,
  • Wed.    Kugler 3:30 CDT
  • Thu.     Jefferson 11:30 CDT, Cook 1:30 CDT
  • Fri.       Fed Chair J. Powell 10:25 CDT, Barr 11:00 CDT, Waller 11:45 CDT

Economic Data week:

  • Mon. Chicago PMI, Dallas Fed, USDA Prospecting Plantings and Grain Stocks
  • Tue. Redbook, ISM Mfg. Final, JOLTS, Dallas Fed.,
  • Wed. EIA Crude Stocks, ADP, Factory Orders
  • Thur. Initial Jobless Claims, ISM Svcs Final, EIA Nat Gas
  • Fri. Non-Farm Payroll

USDA, Non Farm Payroll

Futures 102: Introduction to Crude Oil futures

Course overview

crude oil

Today’s energy crude oil market is truly global. From West Texas Intermediate (WTI) to Brent and DME Oman, the crude oil market fuels many of the world’s leading economies and impact nearly every nation. Energy crude oil futures and options provide the tools the industry needs to manage risk.

Explore the key concepts and structure of today’s energy markets, including the factors that affect supply and demand and move prices. Learn how to use these instruments to hedge exposure and unlock opportunities.

Start FREE Course Now

feea1eb9 e79d 43ed 86e8 b8ad9563ecd2

USDA, Non Farm Payroll

Hot Market of the Week

Hot market of the week is provided by QT Market Center, A Swiss army knife charting package that’s not just for Hedgers, Cooperatives and Farmers alike but also for Spread traders, Swing traders and shorter time frame application for intraday traders with a unique proprietary indicator that can be applied to your specific trading needs.

Free Trial Available

Bloomberg Commodity Index

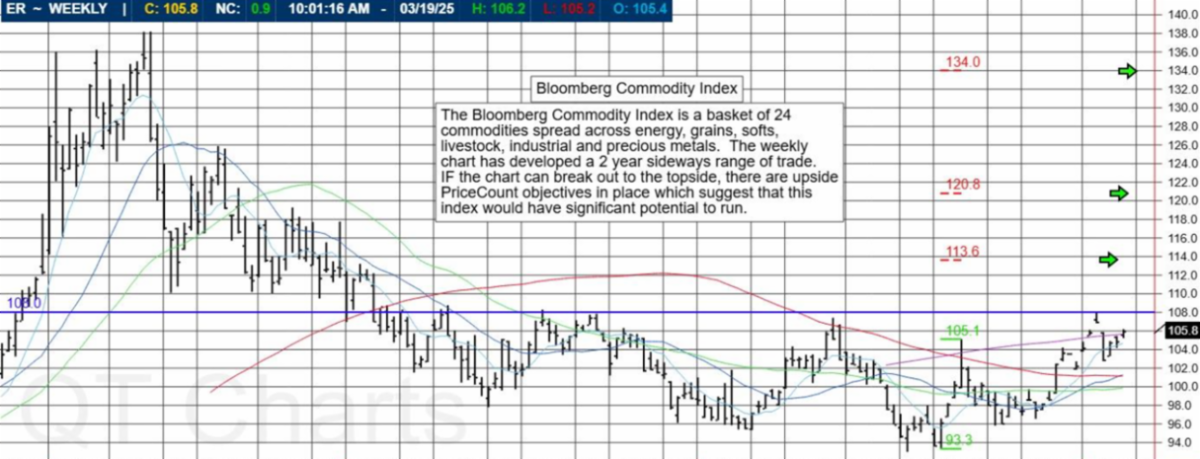
The Bloomberg Commodity Index is a basket of 24 commodities spread across energy, grains, softs, livestock, industrial and precious metals. The weekly chart has developed a 2-year sideways range of trade. IF the chart can break out to the topside, there are upside PriceCount objectives in place which suggest that this index would have significant potential to run.
c0465bb4 b208 4214 b3ed d25703dceb3c

The PriceCount study is a tool that can help to project the distance of a move in price. The counts are not intended to be an ‘exact’ science but rather offer a target area for the four objectives which are based off the first leg of a move with each subsequent count having a smaller percentage of being achieved.

It is normal for the chart to react by correcting or consolidating at an objective and then either resuming its move or reversing trend. Best utilized in conjunction with other technical tools, PriceCounts offer one more way to analyze charts and help to manage your positions and risk. Learn more at www.qtchartoftheday.com

Trading in futures, options, securities, derivatives or OTC products entails significant risks which must be understood prior to trading and may not be appropriate for all investors. Past performance of actual trades or strategies is not necessarily indicative of future results.

USDA, Non Farm Payroll

Brokers Trading System of the Week

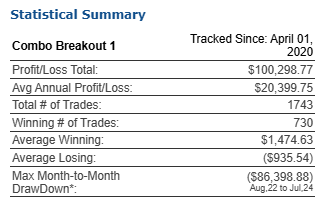
Combo Breakout 1 Trading System

Market Sector: Diversified / Multiple

Markets Traded:  C , KW , S , W , CL , HO , NG , RB , KC , SB , FGBL , TU , FV , BP , EC , JY , SF , DX , FESX , GC , EMD , NQ , RTY , ES , YM ,

System Type: Swing Trading

Risk per Trade: varies

Trading Rules: Partially Disclosed

Suggested Capital: $50,000

Developer Fee per contract: $200.00 Monthly Subscription

System Description: 

Portfolio Combo Breakout I consists of 5-6 daytrade and swing strategies using different symbols, timeframes, and session templates. All strategies are developed by simple, structured, and proven breakout models based on strong fundamental logics.

All strategies are fully robustness tested as well as stress tested with no position sizing, more contracts can be traded. The 5-6 strategies have very low correlations (Less than 0.1) in order to achieve smoother portfolio equity curve.

Combo Breakout I is specially designed to trade with Combo Breakout II and Combo Breakout III for their low correlations in the portfolio level.
Get Started

Learn More

cb74c3ab 5ec4 4e8e 953f b14c8518c26c

USDA, Non Farm Payroll

Disclaimer: The risk of trading can be substantial and each investor and/or trader must consider whether this is a suitable investment. Past performance is not necessarily indicative of future results.

Futures Trading Disclaimer:

Transactions in securities futures, commodity and index futures and options on futures carry a high degree of risk. The amount of initial margin is small relative to the value of the futures contract, meaning that transactions are heavily “leveraged”.

A relatively small market movement will have a proportionately larger impact on the funds you have deposited or will have to deposit: this may work against you as well as for you.

You may sustain a total loss of initial margin funds and any additional funds deposited with the clearing firm to maintain your position. If the market moves against your position or margin levels are increased, you may be called upon to pay substantial additional funds on short notice to maintain your position.

If you fail to comply with a request for additional funds within the time prescribed, your position may be liquidated at a loss and you will be liable for any resulting deficit. Please read full disclaimer HERE.

Would you like to get weekly updates on real-time, results of systems mentioned above?
Yes
No

Trading Levels for Next Week

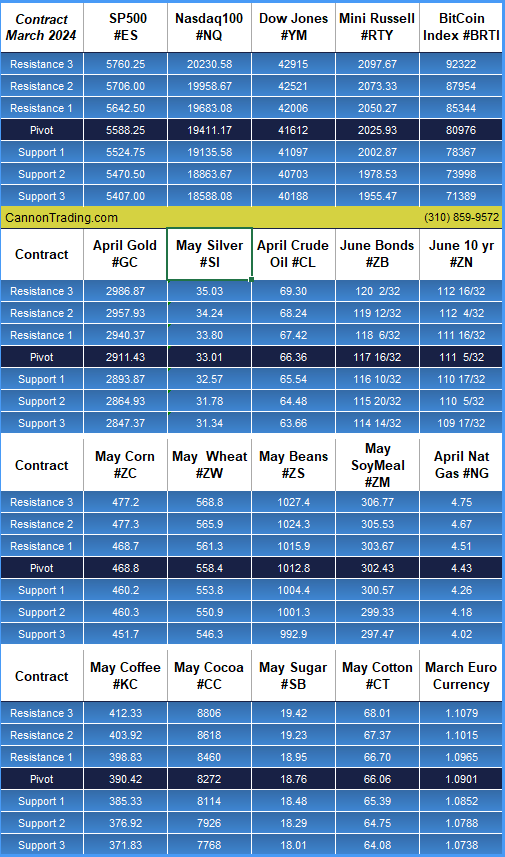
Daily Levels for March 31st, 2025

9078135c a21f 4641 b76e 316ac77cb6e5

Would you like to receive daily support & resistance levels?
Yes
No

Trading Reports for Next Week

First Notice (FN), Last trading (LT) Days for the Week:

www.mrci.com 

5aa002c1 163a 47ff 8281 fd2bdaab6fcc

Find us on Trustpilot

stars

Trading Futures, Options on Futures, and retail off-exchange foreign currency transactions involves substantial risk of loss and is not suitable for all investors.

You should carefully consider whether trading is suitable for you in light of your circumstances, knowledge, and financial resources.

You may lose all or more of your initial investment. Opinions, market data, and recommendations are subject to change at any time.

Call Now

Join our Private Facebook group

Subscribe to our YouTube Channel

Listen to our podcast: Subscribe on AppleSpotify, Amazon

or wherever you listen to podcasts!

S
Facebook  Instagram  LinkedIn
S
ef3ab1c9 8d6d 4e60 a3f1 af5d9d4ecbb3
Services
Software
Tools
Community
Contact

Surging Demand: Weekly Energy Options Jump 17.8% Amid Global Trade Shakeups

9dc1e02e d5f7 4ff4 abf7 1df60775f196

WORLDWIDE WHIRLWIND

Options

Options

Amid geopolitical and macroeconomic movements, Weekly options offer hedging opportunities

Since his inauguration on January 20, President Donald Trump has regularly made headlines for his international trade policy moves. These fluctuating tariff policies have added volatility to commodity markets, as traders strategize how to navigate uncertainty.

On Monday, March 10, Beijing implemented tariffs on multiple farm products from the U.S. Facing a 15% tariff includes chicken, wheat and corn, while soybeans, pork, beef and fruit face a 10% tariff. China is the largest overseas market for American agricultural products. As policy continues to develop, or‌ stays the same, traders can use Ag Weekly options to insulate their portfolios from uncertainty, now available every day of the trading week. Ag Weekly options hit a record in early March, with 3,730 contracts trading on March 5.

Canada planned to retaliate against President Trump’s 25% tariff on Canadian exports in early March. Ontario was looking to impose a 25% surcharge on energy exports to Michigan, Minnesota and New York. President Trump then moved to increase Canada’s initial metals tariff to 50%, but both countries revoked these additional tariffs. To navigate world events, such as tariffs, traders continue to look to Weekly Energy options. WTI Weekly Energy options ADV in March is up 17.8% compared to February 2025, with an average of 24,222 contracts traded in March to February’s 20,562 contracts.

The Trump administration also placed a 25% tariff on all steel and aluminum imports to the U.S. in early March, which also applies to certain products such as nails, wires and car body and bumper stampings. The steel and aluminum tariffs of President Trump’s first term were subject to a product exclusion application process; this exemption process does not exist for the updated steel and aluminum tariffs. Metals traders can turn to Metals Weekly options to hedge risk that may come with volatility in the markets.

GET DAILY MARKET UPDATES VIA VIDEO – FREE

S

May Crude Oil

May crude oil stabilized its break earlier this month and now has activated upside PriceCount objectives on the correction higher. The first count projects a possible run to the 71.12 area.

b3cc484e 25f7 4d6a b8b7 9b02f8e10f8f

Chart above is provided by QT Market Center, A Swiss army knife charting package that’s not just for Hedgers, Cooperatives and Farmers alike but also for Spread traders, Swing traders and shorter time frame application for intraday traders with a unique proprietary indicator that can be applied to your specific trading needs.

Free Trial Available

The PriceCount study is a tool that can help to project the distance of a move in price. The counts are not intended to be an ‘exact’ science but rather offer a target area for the four objectives which are based off the first leg of a move with each subsequent count having a smaller percentage of being achieved. It is normalfor the chart to react by correcting or consolidating at an objective and then either resuming its move or reversing trend. Best utilized in conjunction with other technical tools, PriceCounts offer one more way to analyze charts and help to manage your positions and risk. Learn more at www.qtchartoftheday.com

Trading in futures, options, securities, derivatives or OTC products entails significant risks which must be understood prior to trading and may not be appropriate for all investors. Past performance of actual trades or strategies is not necessarily indicative of future results.

Daily Levels for March 28th, 2025

cab6b426 37dc 4ecd 96d5 fc3ccc55ebb8

Want to feature our updated trading levels on your website? Simply paste a small code, and they’ll update automatically every day!

Click here for quick and easy instructions.

822b33c5 2339 45ed bc84 e9c8f8c7358e

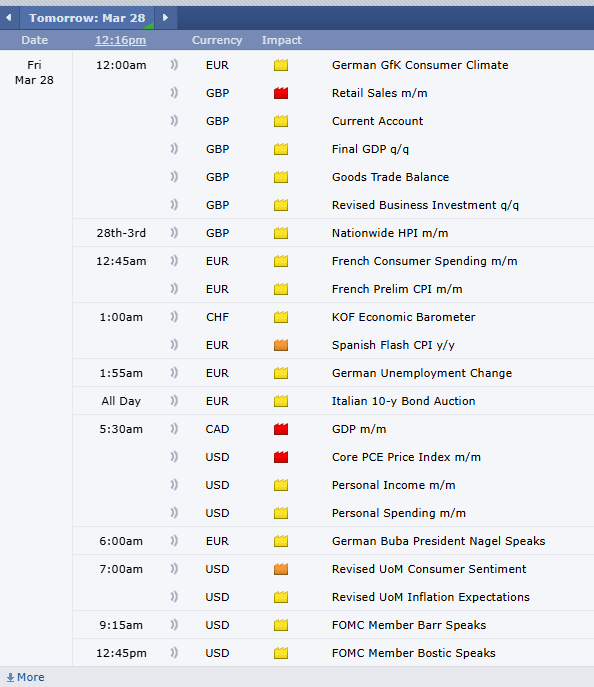
Economic Reports

provided by: ForexFactory.com

All times are Eastern Time (New York)
246e53a5 0614 4eac 820c 32c23fc99ce6

Find us on Trustpilot

stars

Trading Futures, Options on Futures, and retail off-exchange foreign currency transactions involves substantial risk of loss and is not suitable for all investors. You should carefully consider whether trading is suitable for you in light of your circumstances, knowledge, and financial resources. You may lose all or more of your initial investment. Opinions, market data, and recommendations are subject to change at any time.

Call Now

Join our Private Facebook group

Subscribe to our YouTube Channel

Listen to our podcast: Subscribe on AppleSpotify, Amazon

or wherever you listen to podcasts!

S
Facebook  Instagram  LinkedIn
S
ef3ab1c9 8d6d 4e60 a3f1 af5d9d4ecbb3
Services
Software
Tools
Community
Contact

The High-Stakes Crude Oil & CPI Report: 3 Critical Signals for Market Movers

9dc1e02e d5f7 4ff4 abf7 1df60775f196

Crude Oil

crude oil

Movers & Shakers by John Thorpe, Senior Broker

CPI and EIA Petroleum Stocks

Market volatility is here to stay for the foreseeable future

Choose your opportunities wisely.

Prepare for shocks, on CPI and Stocks.

CPI Tomorrow before the Cash Open 7:30 am CST

Updated: March 11, 2025, 12:20 pm

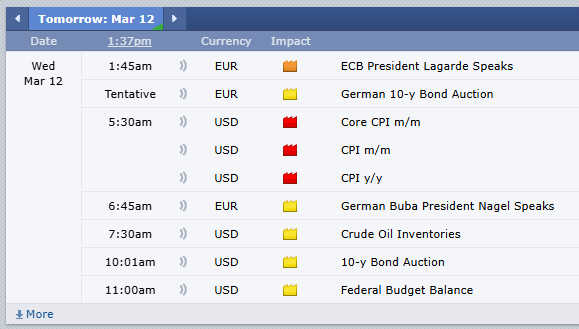
US February consumer price index (CPI) data is forecast by analysts up +0.3% month-to-month, which compares to the previous month’s +0.5%. Core CPI on monthly terms is expected +0.3% in February compared to the prior month’s +0.4%. The data will be released at 7:30 am CT Wednesday morning. CPI on annualized terms is forecast up +2.9% from the year ago month, the core year-over-year figure is expected up +3.2%.

EIA Crude Oil Inventories Tomorrow

EIA Weekly Petroleum Stocks Estimates for Wednesday, March 12 at 9:30 AM CT

in million barrels per day (mln bpd)

Tomorrow:

Econ Data:  CPI, EIA Crude Inventories, Beige Book

630ac786 c874 4cc8 ba42 5324fdf46483

Daily Levels for March 12th, 2025

55546f30 079b 4ae8 877f a2690700854e

Want to feature our updated trading levels on your website? Simply paste a small code, and they’ll update automatically every day! Click here for quick and easy instructions.

822b33c5 2339 45ed bc84 e9c8f8c7358e

Economic Reports

provided by: ForexFactory.com

All times are Eastern Time (New York)
8fdad7f6 8d17 46c6 8cf8 581955abca4c

Find us on Trustpilot

stars

Trading Futures, Options on Futures, and retail off-exchange foreign currency transactions involves substantial risk of loss and is not suitable for all investors. You should carefully consider whether trading is suitable for you in light of your circumstances, knowledge, and financial resources. You may lose all or more of your initial investment. Opinions, market data, and recommendations are subject to change at any time.

Call Now

Join our Private Facebook group

Subscribe to our YouTube Channel

Listen to our podcast: Subscribe on AppleSpotify, Amazon

or wherever you listen to podcasts!

S
Facebook  Instagram  LinkedIn
S
ef3ab1c9 8d6d 4e60 a3f1 af5d9d4ecbb3
Services
Software
Tools
Community
Contact

Copper Prices Surge $6,500 per Contract After Trump’s 25% Tariff Bombshell!

9dc1e02e d5f7 4ff4 abf7 1df60775f196

Markets Highlights on Copper

Copper

by Mark O’Brien, Senior Broker

General:

The big one! It’s that time of the month again: we’re a couple of days from when the Labor Dept. releases its monthly Non-farm payrolls report. It’s widely considered to be one of the most important and influential measures of the U.S. economy and the report is released at 7:30 A.M., Central Time on the first Friday of the month.

Ahead of that, today the ADP National Employment Report showed payrolls increased by 77,000 jobs in February, the smallest gain since July 2024, after rising 186,000 in January. Economists had forecast private employment advancing 140,000.

The ADP report, jointly developed with the Stanford Digital Economy Lab, likely exaggerates the labor market slowdown and has no correlation with the government’s employment report.

 Softs:

Arabica coffee futures rose sharply today with the market heading back up towards recent record highs. May ICE coffee rose almost 5% to $4.1855 per lb. intraday. Traders indicated the market showing signs of resuming its upward trend after suffering a sharp setback which took prices from a record high of $4.2995 on Feb. 11 to a low of $3.6630 a week ago – a ±$23,900 per contract correction! The market was keeping a close watch on the weather in top grower Brazil with hot, dry conditions raising some concerns about the upcoming crop.

Energy:

Crude oil futures settled down for the fourth consecutive session today after U.S. crude oil stockpiles posted a larger-than-expected build, adding a further headwind as investors worried about OPEC+ plans to increase output in April and U.S. tariffs on Canada, China and Mexico. April West Texas Intermediate crude (WTI) settled down $1.95, or 2.86%, to $66.31 a barrel, its lowest since November ’24. OPEC+, the Organization of the Petroleum Exporting Countries and allies including Russia, decided on Monday to proceed with a planned April oil output increase of 138,000 barrels per day, its first since 2022.

Metals:

Copper

CME/COMEX copper futures soared today following President Donald Trump’s announced 25% tariffs on copper imports during his Tuesday night speech to Congress. May copper rose ±26 cents/lb. (±5.7% as of this blog post – a $6,500 per contract move – to a $4.825/lb. intraday high.

S

April Crude Oil

April crude oil is completing its second downside PriceCount objective to the 66.53 area. It would be normal to get a near term reaction from this level in the form of a consolidation or corrective trade. At this point, IF the chart can sustain further weakness, the third count would project a possible slide to a new contract low around 62.78. A trade below the October reactionary low would formally negate the remaining unmet upside objectives.

0e99bbc0 9525 4d6a b618 92dc6ff487b8

Daily Levels for March 6th, 2025

d5322ea5 19d1 4167 952f 10a901eda3f5

Want to feature our updated trading levels on your website? Simply paste a small code, and they’ll update automatically every day! Click here for quick and easy instructions.

822b33c5 2339 45ed bc84 e9c8f8c7358e

Economic Reports

provided by: ForexFactory.com

All times are Eastern Time (New York)

da172104 6c0a 4cfc 9a2d 0eb288e8412e

Find us on Trustpilot

stars

Trading Futures, Options on Futures, and retail off-exchange foreign currency transactions involves substantial risk of loss and is not suitable for all investors. You should carefully consider whether trading is suitable for you in light of your circumstances, knowledge, and financial resources. You may lose all or more of your initial investment. Opinions, market data, and recommendations are subject to change at any time.

Call Now

Join our Private Facebook group

Subscribe to our YouTube Channel

Listen to our podcast: Subscribe on AppleSpotify, Amazon

or wherever you listen to podcasts!

S
Facebook  Instagram  LinkedIn
S
ef3ab1c9 8d6d 4e60 a3f1 af5d9d4ecbb3
Services
Software
Tools
Community
Contact

Market Updates: S&P 500, Crude Oil, and Gold Movements

9dc1e02e d5f7 4ff4 abf7 1df60775f196

The Day Ahead in Futures Trading

by Mark O’Brien, Senior Broker

S&P 500, Gold, Crude Oil

Gold

Bullet Points, Highlights, Announcements

Indexes:

The March E-mini S&P 500 traded within striking distance of its life-of-contract high posted back on Dec. 4th and 6th (6164.00) breaching that price intraday with a 6166.50 print and closing today at 6163.00

Energy:

Oil prices rose on Wednesday, extending gains to a third-consecutive session amid growing supply worries.

March futures for West Texas Intermediate Crude traded briefly above $73.00 per barrel, a ±75 intraday increase and trading up ± 46 cents per barrel at ±$72.31.

If you missed it, EIA Energy Stocks were NOT released today, as is usual.  Due to the Presidents’ Day holiday, the report will be release tomorrow, 30 minutes after the EIA Gas Stocks report: 7:30 A.M., Central Time (gas), 8:00 A.M. (energy).

Metals:

Gold prices wavered near unchanged at this blog’s submission after trading ±$15 above and below yesterday’s settlement and near its all-time highs near $2,950 per ounce.

Fueling safe-haven demand for the precious metal, the Trump administration plans to impose tariffs of around 25% on U.S. bound autos and auto-building components, semiconductors and pharmaceuticals as early as April 2.

April gold futures have gained about 12% so far this year, with analysts expecting higher prices in a trade war.  On Monday, Goldman Sachs raised its year-end 2025 gold price forecast to $3,100 per ounce.

Daily Levels for February 20th, 2025

bd6d749c c5a2 43f1 9e87 e07e626addfa

Want to feature our updated trading levels on your website? Simply paste a small code, and they’ll update automatically every day! Click here for quick and easy instructions.

822b33c5 2339 45ed bc84 e9c8f8c7358e

Economic Reports

provided by: ForexFactory.com

All times are Eastern Time (New York)

93bdd8ce 5f43 4ef6 b1d6 41edd58d984c

Find us on Trustpilot

stars

Trading Futures, Options on Futures, and retail off-exchange foreign currency transactions involves substantial risk of loss and is not suitable for all investors. You should carefully consider whether trading is suitable for you in light of your circumstances, knowledge, and financial resources. You may lose all or more of your initial investment. Opinions, market data, and recommendations are subject to change at any time.

Call Now

Join our Private Facebook group

Subscribe to our YouTube Channel

Listen to our podcast: Subscribe on AppleSpotify, Amazon

or wherever you listen to podcasts!

S
Facebook  Instagram  LinkedIn
S
ef3ab1c9 8d6d 4e60 a3f1 af5d9d4ecbb3
Services
Software
Tools
Community
Contact

Navigating the World of Crude Oil Futures: Production, Exchanges, Brokers, and Hedging

Find out more about trading futures options with Cannon Trading Company here.

Crude oil, often referred to as the lifeblood of modern economies, plays a pivotal role in energy production, transportation, and global geopolitics. As a finite and highly sought-after resource, trading crude oil futures offers investors and businesses a way to manage risk, speculate on price movements, and participate in the energy market. In this comprehensive exploration, we will delve into the types of crude oil, major oil-producing regions, top oil producers, global oil futures exchanges, the role of crude oil brokers, and the art of hedging crude oil through futures trading. Additionally, we will take a closer look at Cannon Trading Futures Brokers and their exceptional TrustPilot rating.

Types of Crude Oil and Geographic Areas
Crude oil is not a uniform commodity; it comes in various grades and qualities, each with distinct characteristics. The most commonly traded types of crude oil include Brent crude, West Texas Intermediate (WTI) crude, and Dubai crude, among others. These grades differ in terms of density, sulfur content, and location of production.

Geographically, crude oil is found in multiple regions around the world. Notable areas of crude oil production include:

  1. Middle East: The Middle East is renowned for its vast oil reserves, with countries like Saudi Arabia, Iraq, and Iran being major producers. The region’s influence on global oil prices and supply dynamics is significant.
  2. North America: The United States and Canada are prominent producers of crude oil, with the shale revolution in the U.S. leading to a surge in production in recent years.
  3. Russia and Former Soviet Union: Russia has substantial oil reserves and is a key player in the global oil market. Other countries in the former Soviet Union, such as Kazakhstan and Azerbaijan, also contribute to production.
  4. Latin America: Countries like Venezuela and Brazil are significant producers in the Latin American region, contributing to global supply.
  5. Africa: Countries like Nigeria, Angola, and Libya are noteworthy crude oil producers in Africa, with varying degrees of geopolitical influence on supply.

Top Oil Producers in the World
The hierarchy of top oil producers shifts based on global economic and political dynamics. As of my last knowledge update in September 2021, some of the top oil-producing countries included Saudi Arabia, the United States, Russia, and China. These countries not only influence the supply side but also impact global demand and pricing trends.

Global Oil Futures Exchanges and Brokers
Oil futures are traded on several prominent exchanges around the world, providing investors and traders with a platform to speculate on the future price of crude oil. Some of the well-known oil futures exchanges include:

  1. New York Mercantile Exchange (NYMEX): NYMEX, a division of the CME Group, offers futures contracts for WTI crude oil. WTI is considered a benchmark for oil prices in North America.
  2. Intercontinental Exchange (ICE): ICE offers Brent crude oil futures contracts, which serve as a global benchmark for oil prices. Brent crude is sourced from the North Sea and represents a major component of the international oil market.
  3. Dubai Mercantile Exchange (DME):DME provides a platform for trading Dubai crude oil futures contracts, which cater to the Asian market.

Hedging Crude Oil on the Futures Market
Hedging in the context of crude oil futures involves using futures contracts to mitigate the risk of adverse price movements. This strategy is commonly employed by oil producers, consumers, and investors who wish to protect themselves from the volatility of oil prices.

For instance, an oil producer concerned about a potential decline in oil prices could enter into futures contracts to sell oil at a predetermined price. If prices fall, the loss on the physical oil sale could be offset by gains in the futures contract. Similarly, airlines or other businesses heavily reliant on oil for operations could use futures contracts to lock in prices and safeguard against unexpected price spikes.

Cannon Trading Futures Brokers and TrustPilot Rating
Cannon Trading, a well-established futures broker, offers traders access to a range of commodities, including crude oil futures. With over three decades of experience in the industry, Cannon Trading has earned a reputation for its commitment to providing traders with advanced tools, competitive pricing, and reliable execution.

One valuable indicator of a broker’s performance is customer feedback, and Cannon Trading’s exceptional rating on TrustPilot speaks to its dedication to client satisfaction. TrustPilot, a platform for customer reviews, showcases positive experiences shared by traders who have engaged with Cannon Trading. These reviews often highlight factors such as efficient customer support, user-friendly platforms, and seamless order execution, all of which are critical in the world of futures trading.

Crude oil futures offer a pathway for investors, producers, and consumers to engage with the energy market, manage risk, and capitalize on price movements. The diverse types of crude oil and their global geographic locations contribute to the dynamic nature of the oil market. As top oil producers shift and demand evolves, the role of oil futures exchanges, brokers, and hedging strategies remains integral to the functioning of this essential global commodity market. Cannon Trading Futures Brokers, exemplified by their TrustPilot rating, underscores the significance of reliable brokerage services in facilitating successful crude oil futures trading.

Weekly Newsletter #1081 Day Trading Commodities with Crude Oil Futures & Support and Resistance Levels for the Week Ahead

Cannon Futures Weekly Letter Issue # 1081

Dear Traders,

Like us on FaceBook!
Get Real Time updates and market alerts on Twitter!

Trading 102: Day Trading Commodities with Crude Oil Futures

Crude Oil Futures Volatility Offers A “Different Market Personality” Than Stock Index Futures. Here Is Some Of The Things You Need To Know About Day Trading Crude Oil Futures:
By: Ilan Levy-Mayer, Cannon Trading Commodities Broker & VP
Crude Oil is one of MY favorite futures market for day trading. Before I dive in and share with you how the volatility in crude oil fits my risk tolerance for day trading and provide a couple of chart examples, we should review some of the specifications of Crude Oil Futures.
Crude Oil Futures have monthly expiration. So each month we trade a different contract month, so one needs to know when is the first notice day and last trading day for crude oil futures in order to always make sure we are trading the proper month with the most liquidity and avoid any chance of getting into delivery situation.
Next is the contract size. Crude Oil futures are based on 1000 barrels. To be honest from a day trading perspective all I care is that each tick or 1 cent fluctuation is $10 against me or in my favor per contract. That means that a move from 92.94 to 92.74 = $200.
Another factor is trading hours. At the time I am sharing my thoughts with you, April 8th 2013, crude oil futures trade on the CME Globex platform and trade from 5 PM CDT until the next day at 4 PM CDT. That is 23 of straight trading hours. I definitely don’t recommend day trading this market 23 hours…but it is good to know the trading hours.
Volume in crude oil futures is pretty good to trade in my opinion. Averaging about 300,000 contracts per day.
One last pointer to touch on is the API (American Petroleum Institute) report that normally comes out Wednesday at 9:30 CDT (on short weeks, holidays etc. , this report will be pushed to Thursday at 10 AM CDT). I tell my clients that this report is way too volatile and I like to be out 5 minutes before and not resume trading 5 minutes until after the report comes out. This report by itself deserves a writing but on short, the report provides information on how our stock pile is doing ( = supply/demand) and the market will move based on the numbers versus what was expected. Again as a day trader, your main job is to know about this report, when it comes out and in my opinion stay out of the market during this time..Fill out the form below to read the full article.
WorldCup Trading Championships 2022

Good Trading

Trading Futures, Options on Futures, and retail off-exchange foreign currency transactions involves substantial risk of loss and is not suitable for all investors.  You should carefully consider whether trading is suitable for you in light of your circumstances, knowledge, and financial resources. You may lose all or more of your initial investment. Opinions, market data, and recommendations are subject to change at any time when it comes to Futures Trading.


Futures Trading Levels

01.10.2022

Support and Resistance Levels 1.10.2022


Weekly Levels

Weekly Support and Resistance Levels


Reports, First Notice (FN), Last trading (LT) Days for the Week:

https://mrci.com

Date Reports/Expiration Notice Dates


MRCI Reports 1.10.2022

This is not a solicitation of any order to buy or sell, but a current market view provided by Cannon Trading Inc. Any statement of facts here in contained are derived from sources believed to be reliable, but are not guaranteed as to accuracy, nor they purport to be complete. No responsibility is assumed with respect to any such statement or with respect to any expression of opinion herein contained. Readers are urged to exercise their own judgement in trading

OPEC Meeting cause for Higher Volatility in the Futures Markets, Crude Oil Chart Review & Support and Resistance Levels 12.03.2021

Dear Futures Trader,

Get Real Time updates and more on our private FB group!

OPEC meeting today took crude oil and products into even higher volatility.

In my opinion, many markets took que from crude oil price movement, especially stock index futures.
While this may be a temporary situation, you may want to watch crude oil prices even if you are trading only the mini SP or even grains for that matter….
Crude oil daily chart for your viewing pleasure….
DON’T FORGET we have monthly unemployment numbers tomorrow…NFP, non farm payroll.

Daily Crud Oil Chart 12.02.2021

Good Trading

Trading Futures, Options on Futures, and retail off-exchange foreign currency transactions involves substantial risk of loss and is not suitable for all investors.  You should carefully consider whether trading is suitable for you in light of your circumstances, knowledge, and financial resources. You may lose all or more of your initial investment. Opinions, market data, and recommendations are subject to change at any time when it comes to Futures Trading.


Futures Trading Levels

12-03-2021

Futures Support and Resistance Levels 12.03.2021


Economic Reports, source: 

https://bettertrader.co/ 

ffd4bcb0 722b 40ad 984d 683d35e2a020


This is not a solicitation of any order to buy or sell, but a current market view provided by Cannon Trading Inc. Any statement of facts here in contained are derived from sources believed to be reliable, but are not guaranteed as to accuracy, nor they purport to be complete. No responsibility is assumed with respect to any such statement or with respect to any expression of opinion herein contained. Readers are urged to exercise their own judgement in trading.

Crude Oil Futures Market Review and Daily Chart Analysis & Support and Resistance Levels 11.18.2021

Dear Futures Trader,

Get Real Time updates and more on our private FB group!

Crude Oil Futures Market Review and Daily Chart Analysis

Looking at both price and time FIB analysis, on the daily crude oil chart below (click here for LARGE IMAGE) I am showing a potential for crude oil to find support and have a short term reversal to the upside. I wont fight the short term trend and will look for a buy signal using 30 minute chart before I jump in front of this downward train…
What do I mean by that?
Daily chart still showing a good strength on the LONGER term scale ( see both Elliott Wave counts and trend strength). Short term we can see the strong sell of the highs made towards the end of October.
I ran both a Fibonacci retracement on prices from lows to high, as well as Fibonacci TIME retracement from the time of lows to highs to see the next TIMING window to look at.
We are getting close to a match on both time and price ( concept I was made aware of by Carolyn Boroden Strategies for Intraday Trading Fibonacci Retracements | Fibonacci Queen) so I will now look for a bullish trigger in the form of MACD cross over on the 30 minutes chart or possible turning up of RSI on the 30 minutes chart before simply trying my luck…..
As always the key will be risk and trade management if/when set up happens.
Keep in mind FRONT month for crude oil is now January! CLF22
If you are looking for other reference material please contact your Cannon Broker for lists of solid, informative and helpful trading tomes
Crude Oil Futures Daily Chart

Good Trading

Trading Futures, Options on Futures, and retail off-exchange foreign currency transactions involves substantial risk of loss and is not suitable for all investors.  You should carefully consider whether trading is suitable for you in light of your circumstances, knowledge, and financial resources. You may lose all or more of your initial investment. Opinions, market data, and recommendations are subject to change at any time when it comes to Futures Trading.


Futures Trading Levels

11-18-2021

Support and Resistance Levels 11.18.2021


Economic Reports, source: 

https://bettertrader.co/ 

BetterTrader Economic Indicators 11.17.2021


This is not a solicitation of any order to buy or sell, but a current market view provided by Cannon Trading Inc. Any statement of facts here in contained are derived from sources believed to be reliable, but are not guaranteed as to accuracy, nor they purport to be complete. No responsibility is assumed with respect to any such statement or with respect to any expression of opinion herein contained. Readers are urged to exercise their own judgement in trading.