Mini S&P Chart & Economic Reports 12.19.2014

Connect with Us! Use Our Futures Trading Levels and Economic Reports RSS Feed.

Like us on FacebookFollow us on TwitterView our profile on LinkedInFind us on Google+Cannon Trading Futures Trading Resistance & Support Levels and Economic ReportsFind us on Yelp

1. Market Commentary
2. Futures Support and Resistance Levels – S&P, Nasdaq, Dow Jones, Russell 2000, Dollar Index
3. Commodities Support and Resistance Levels – Gold, Euro, Crude Oil, T-Bonds
4. Commodities Support and Resistance Levels – Corn, Wheat, Beans, Silver
5. Futures Economic Reports for Friday December 19, 2014

Hello Traders,

For 2014 I would like to wish all of you discipline and patience in your trading!

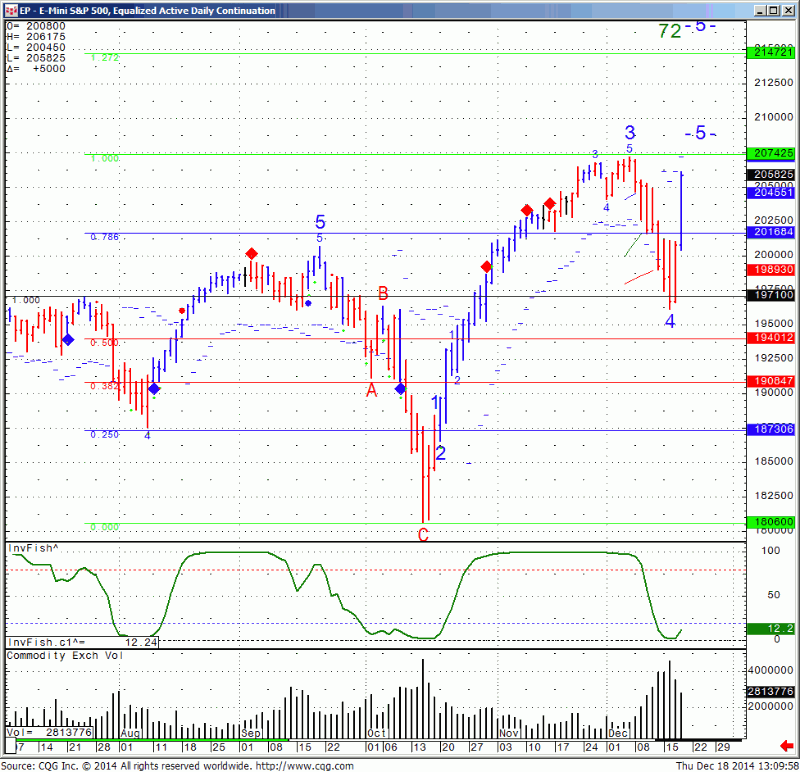
Recent moves in the stock market don’t stop to amaze me…. FED changes language in statement slightly and we jump over 2.5%!!!

Hard to predict what will happen next, at least for me it is. We have seen days where the market closes down sharply only to make a U turn the next day and vice versa.

Below is a daily chart of the mini SP, if we break the recent highs of 2072, then next targets are 2094 and 2170.

EP - E-mini S&P 100, Equalized Active Daily Continuation

Continue reading “Mini S&P Chart & Economic Reports 12.19.2014”
Mini S&P Daily Continuation Chart – Levels & Reports 8.12.2014

Hello Traders,

For 2014 I would like to wish all of you discipline and patience in your trading!

Nice bounce on stock index futures after the lows we made Thursday night.

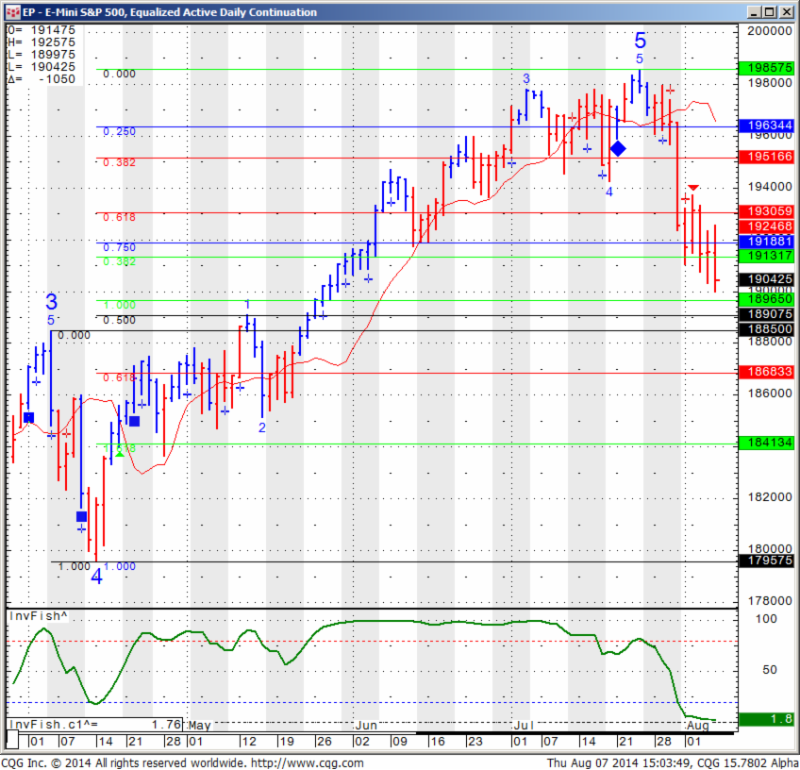
So far the market has respect to the symmetry I am sharing below and the current bounce should test 1951 if continues OR test 1913 if selling pressure resumes. These are the levels I will be watching as in between we have enough room for intraday fluctuations. Volume today was light and action took place mostly in the first few hours. August is know to be the “month of vacations” over at Europe.
Mini SP 500 daily chart for your review below:


823


In between the Geo political focus will be on the situation in Iraq and the concerning issue of the Islamic group known as ISIS.

Continue reading “Mini S&P Daily Continuation Chart – Levels & Reports 8.12.2014”

SP 500 Futures Testing Major Support Zone – Levels & Reports for 8.8.2014

Hello Traders,

For 2014 I would like to wish all of you discipline and patience in your trading!

SP 500 made new lows and about to test a series of support levels as one can see in the daily chart below:

We have few levels of support between 1885 and 1896.50 in case we break again below the psychological 1900 mark.

I mentioned a couple of days ago support of 1795 by mistake and was asked by few of the readers. That was a typo the support I meant to write is 1895.

Looks like we will visit that level and zone very soon, maybe as early as night session. My best guess is for an initial bounce of that level. Just a guess. Either way I will look to see what kind of reaction we get if and when we get down there.

A strong bounce may signal some more upside, however a break below 1895-1885 level may actually make my 1795 typo into a reality… 822

Continue reading “SP 500 Futures Testing Major Support Zone – Levels & Reports for 8.8.2014”

Stock Indices React to FOMC with Largest One Day Drop in 4 Months – Aug 1st Levels

Hello Traders,

For 2014 I would like to wish all of you discipline and patience in your trading!

I have noticed many times in the past that the “real direction to FOMC announcements, will usually come the following day”. Today was a perfect example of it…..

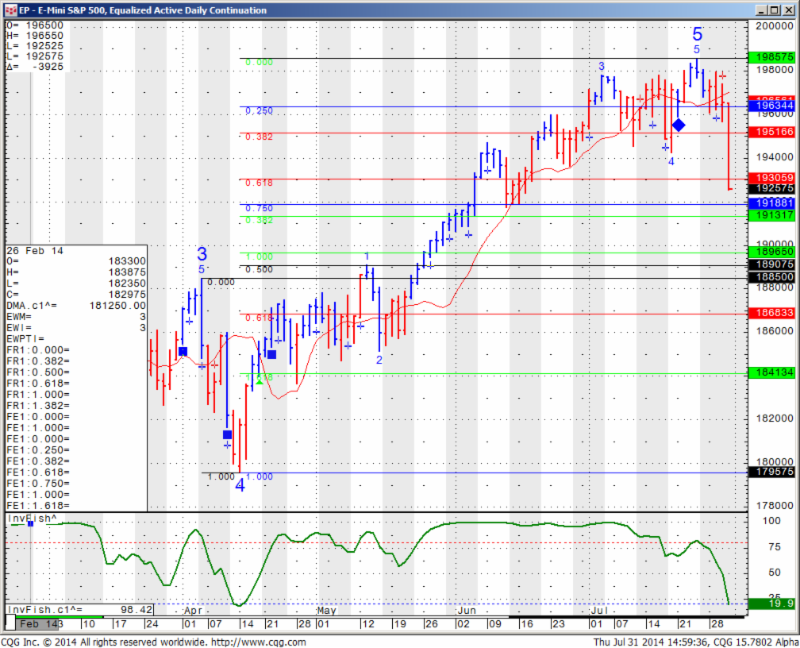
Last time we had a meaningful correction in the SP500 was April 4th. The correction lasted 10 days and measured 90 SP points from peak to valley 1885 to 1795 as you can see in the chart below ( sounds like I am talking about earthquakes….).If symmetry decides to give us a similar reaction we can see 1896 as the next target. In between we have a support zone at 1913 – 1918 first.


Daily chart of the Sept. mini SP 500 with the different levels for your review below:


EP - E-Mini S&P 500 Equalized Active Daily Continuation
EP – E-Mini S&P 500 Equalized Active Daily Continuation

Continue reading “Stock Indices React to FOMC with Largest One Day Drop in 4 Months – Aug 1st Levels”

E-Mini S&P Daily Chart & Economic Reports 6.20.2014

Connect with Us! Use Our Futures Trading Levels and Economic Reports RSS Feed.

Like us on FacebookFollow us on TwitterView our profile on LinkedInFind us on Google+Cannon Trading Futures Trading Resistance & Support Levels and Economic ReportsFind us on Yelp

1. Market Commentary
2. Futures Support and Resistance Levels – S&P, Nasdaq, Dow Jones, Russell 2000, Dollar Index
3. Commodities Support and Resistance Levels – Gold, Euro, Crude Oil, T-Bonds
4. Commodities Support and Resistance Levels – Corn, Wheat, Beans, Silver
5. Futures Economic Reports for Friday June 20, 2014

Hello Traders,

For 2014 I would like to wish all of you discipline and patience in your trading!


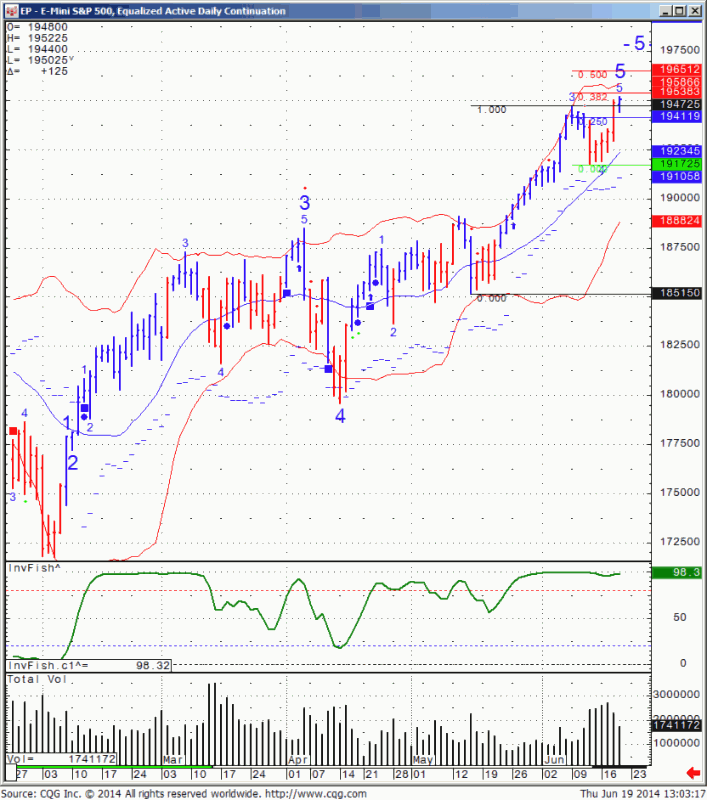
I was asked to share my daily chart based on the September contract which is the front month.

Here is the daily chart of the Sept. mini SP 500 for your review, along with indicators I like to watch and possible levels. Notice that other than a couple of “small red dots” ( which are small sell signal based on Bollinger bands) I have not gotten a sell signal on this market since beginning of January this year!! This market is over extended but I think patience is a virtue especially when a market is making all time highs…..

818


If you like the information we share? We would appreciate your positive reviews on our new yelp!! Continue reading “E-Mini S&P Daily Chart & Economic Reports 6.20.2014”

Rollover + Mini S&P Chart, Futures Levels & Economic Reports 3.14.2014

Connect with Us! Use Our Futures Trading Levels and Economic Reports RSS Feed.

Like us on FacebookFollow us on TwitterView our profile on LinkedInFind us on Google+Cannon Trading Futures Trading Resistance & Support Levels and Economic ReportsFind us on Yelp

1. Market Commentary
2. Futures Support and Resistance Levels – S&P, Nasdaq, Dow Jones, Russell 2000, Dollar Index
3. Commodities Support and Resistance Levels – Gold, Euro, Crude Oil, T-Bonds
4. Commodities Support and Resistance Levels – Corn, Wheat, Beans, Silver
5. Futures Economic Reports for Friday March 14, 2014

Hello Traders,

For 2014 I would like to wish all of you discipline and patience in your trading!

Rollover Notice for Stock Index Futures

Important notice: For those of you trading any stock index futures contracts, i.e., the E-mini S&P, E-mini NASDAQ, E-mini Dow Jones, the “Big” pit-traded S&P 500, etc., it is extremely important to remember that tomorrow, Thursday, March13th, is rollover day.

Starting March13th, the June 2014 futures contracts will be the front month contracts. It is recommended that all new positions be placed in the June 2014 contract as of March 13th. Volume in the March 2014 contracts will begin to drop off until its expiration on Friday March 21st.

The month code for June is M4.

Traders with electronic trading software should make sure that defaults reflect the proper contract as of Thursday morning.


Please close any open March Currency positions by the close on Friday the 14th.Should you have any further question please contact your broker.

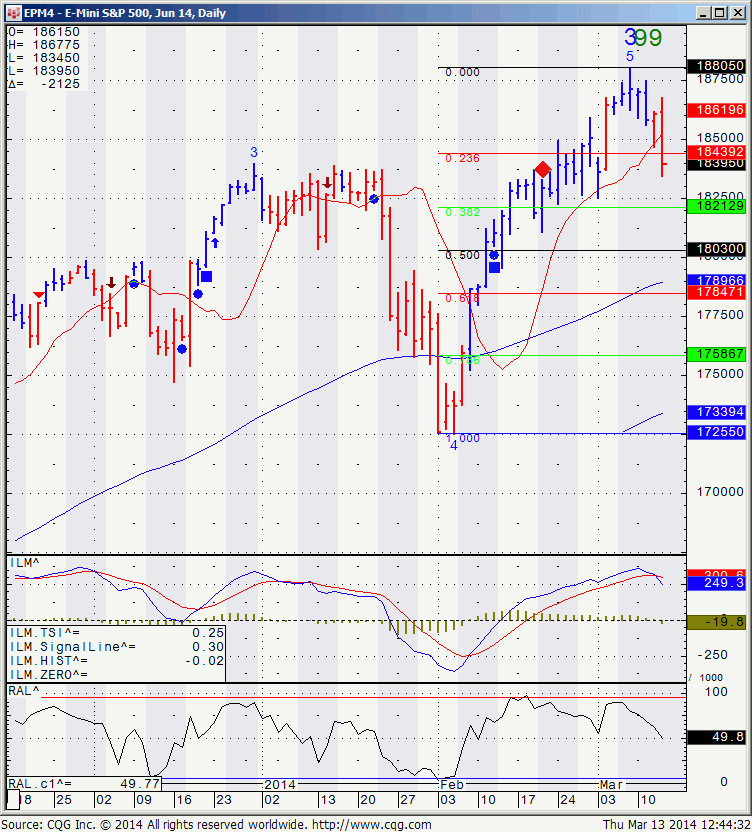
So June started being the LEAD or FRONT month with a statement as the market dropped pretty hard.

Here is what June mini SP daily chart looks like:

EPM4 - E-Mini S&P 500, Jun 14, Daily
EPM4 – E-Mini S&P 500, Jun 14, Daily

Continue reading “Rollover + Mini S&P Chart, Futures Levels & Economic Reports 3.14.2014”

Mini S&P Hits New Highs & Futures Levels & Economic Reports 12.19.2013

Connect with Us! Use Our Futures Trading Levels and Economic Reports RSS Feed.

Like us on FacebookFollow us on TwitterView our profile on LinkedInFind us on Google+Cannon Trading Futures Trading Resistance & Support Levels and Economic ReportsFind us on Yelp

1. Market Commentary
2. Futures Support and Resistance Levels – S&P, Nasdaq, Dow Jones, Russell 2000, Dollar Index
3. Commodities Support and Resistance Levels – Gold, Euro, Crude Oil, T-Bonds
4. Commodities Support and Resistance Levels – Corn, Wheat, Beans, Silver
5. Futures Economic Reports for Thursday December 19, 2013

Hello Traders,

For 2013 I would like to wish all of you discipline and patience in your trading! 

We need your votes!!

I have gotten and getting great feedback from many of you and would appreciate if you can take a couple of seconds to vote at:


Trader Planet Award


Also keep in mind that March is now the front month for stock indices, financials, currencies and grains!
What a wild ride today following the FOMC !!

Two charts for your viewing pleasure….one is an 8 tick range bar of the mini SP. Note it took the market 4 hours to complete the same range ( volume as well) it did in about 2 minutes right after FOMC ( if you read my blog yesterday, you hopefully listened and stayed out of the market during the minutes before and right after as I feel it is a pure gamble) –  so first chart just to demonstrate the volatility after the report.


ESh4 2.00 mg #2 E-Mini SP

Second chart is a daily chart of the March mini SP along with possible levels both above and below.


EP - E Mini S&P 500, Equalized Active Daily Continuation
EP – E Mini S&P 500, Equalized Active Daily Continuation

Continue reading “Mini S&P Hits New Highs & Futures Levels & Economic Reports 12.19.2013”

Mini S&P Daily Chart, Futures Levels & Economic Reports 12.17.2013

Connect with Us! Use Our Futures Trading Levels and Economic Reports RSS Feed.

Like us on FacebookFollow us on TwitterView our profile on LinkedInFind us on Google+Cannon Trading Futures Trading Resistance & Support Levels and Economic ReportsFind us on Yelp

1. Market Commentary
2. Futures Support and Resistance Levels – S&P, Nasdaq, Dow Jones, Russell 2000, Dollar Index
3. Commodities Support and Resistance Levels – Gold, Euro, Crude Oil, T-Bonds
4. Commodities Support and Resistance Levels – Corn, Wheat, Beans, Silver
5. Futures Economic Reports for Tuesday December 17, 2013

Hello Traders,

For 2013 I would like to wish all of you discipline and patience in your trading! 

Busy week ahead! Many diff. reports coming out this week with FOMC decision this Wednesday.

We saw some volatility in the overnight session on the SP 500 but very tight range once the cash market opened.

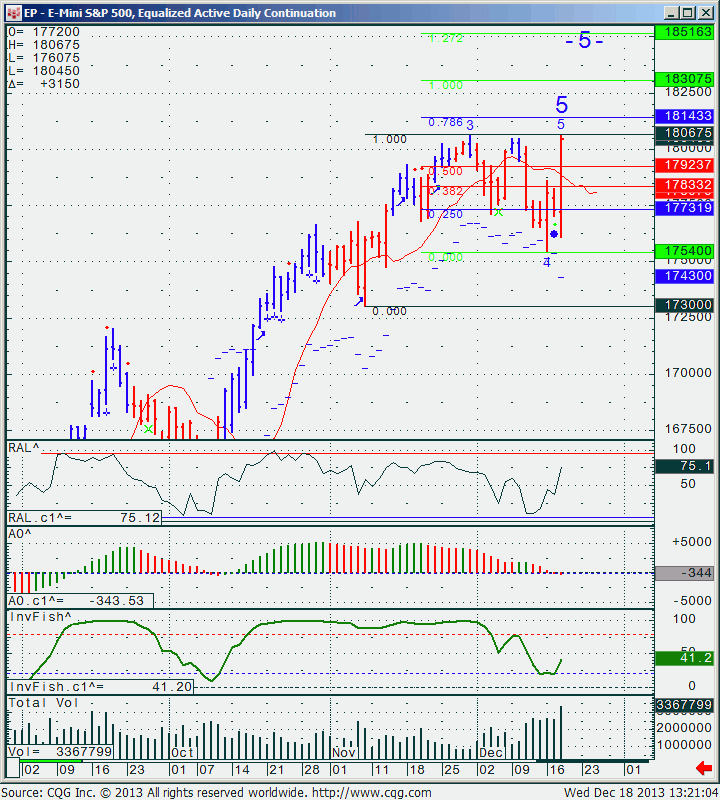
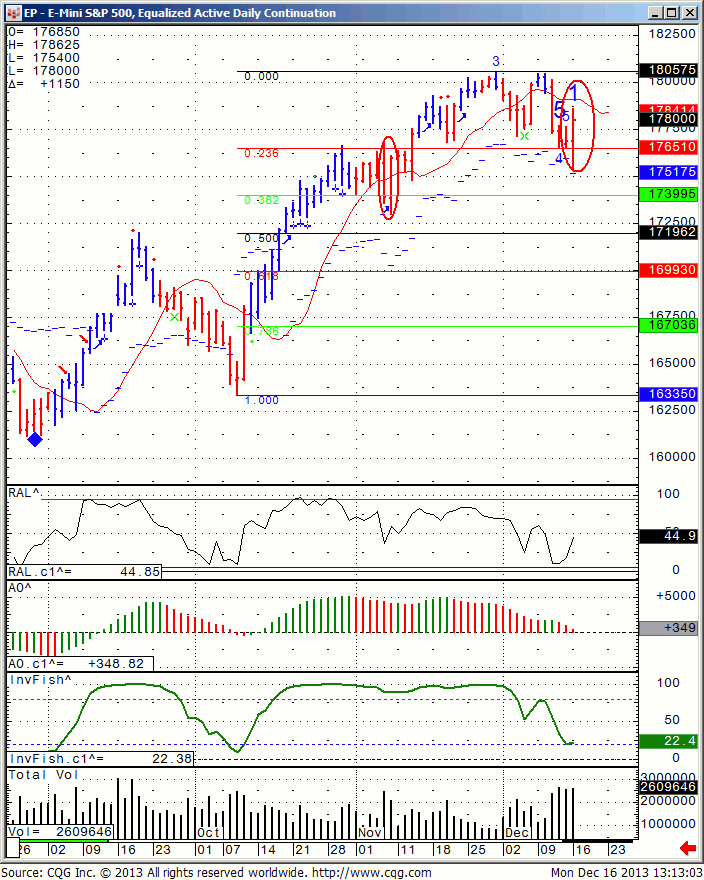
As far as market outlook, we are at a junction again, like we were back on Nov. 8th when the market declined for a bit and then made a new low only to close much higher. We saw similar action today ( I circled both today’s and Nov. 8th ). The big question is if new highs are awaiting or is this is just a bounce. I think answers will come by the end of the week ( might be too late, I wish we knew the answer in advance) but for now I am treating this market as a very wide decision channel between today’s lows at 1754 and recent high at 1805.75 basis the March contract.


Chart for your review below:

EP - E Mini S&P 500, Equalized Active Daily Continuation
EP – E Mini S&P 500, Equalized Active Daily Continuation

New Highs for S&P, Futures Levels & Economic Reports 11.14.2013

Connect with Us! Use Our Futures Trading Levels and Economic Reports RSS Feed.

Like us on FacebookFollow us on TwitterView our profile on LinkedInFind us on Google+Cannon Trading Futures Trading Resistance & Support Levels and Economic ReportsFind us on Yelp

1. Market Commentary
2. Futures Support and Resistance Levels – S&P, Nasdaq, Dow Jones, Russell 2000, Dollar Index
3. Commodities Support and Resistance Levels – Gold, Euro, Crude Oil, T-Bonds
4. Commodities Support and Resistance Levels – Corn, Wheat, Beans, Silver
5. Futures Economic Reports for Thursday November 14, 2013

Hello Traders,

For 2013 I would like to wish all of you discipline and patience in your trading! 


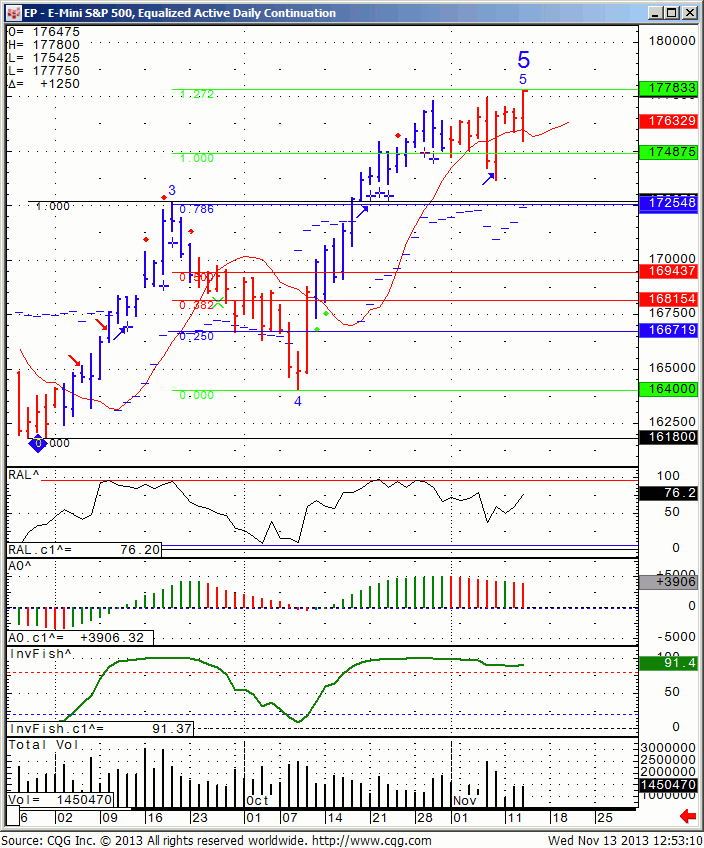
New highs on the SP500…..


I have drawn the extensions in the chart below last week…will be interesting to see if price respects those levels or not…I guess we can find out as early as tomorrow….

EP - E-Mini S&P 500, Equalized Active Daily Continuation
EP – E-Mini S&P 500, Equalized Active Daily Continuation


On a different note:

  • My opinion is that there are 3 main types of trading days.


  1. Most common is two sided trading action with swings up and down – this type of trading day is most suitable for using support and resistance levels along with overbought /oversold indicators.
  2. Strong trending day, mostly one directional – this type of trading day is the least common, many times will happen on Mondays and maybe 3-5 times a month at most – this type of trading day is most suitable for using ADX, MACD crossovers and pretty much looking for pullbacks to jump on the trend.
  3. Slow and/ or choppy trading day – this type of trading day is best suited for taking small profits from the market by looking at volume spikes, using stochastics as possible entry signals and usually wait for a pullback before jumping in.


  • Good question is how can one asses what type of trading day we will have while the market is still trading….I am doing some work about it and will be happy to hear feedback via email but here are some initial observations:
    1. Was the overnight session a wide, two sided trading range? If the answer is yes, good chances for similar trading day during the primary session ( primary session is when the cash/ stock market is open).
    2. Mondays have the highest chance for trending days.
    3. The behavior of the first hour of trading can also suggests the type of action for the rest of the day.
    4. If the first 30 minutes have good volume, better chances for type 1 or type 2 trading days.
    5. low volume during first 30 minutes can suggest a choppy (type 3 trading day).

Continue reading “New Highs for S&P, Futures Levels & Economic Reports 11.14.2013”

Futures Trading Levels and Economic Reports for October 1, 2013

Connect with Us! Use Our Futures Trading Levels and Economic Reports RSS Feed.

Like us on FacebookFollow us on TwitterView our profile on LinkedInFind us on Google+Cannon Trading Futures Trading Resistance & Support Levels and Economic ReportsFind us on Yelp

1. Market Commentary
2. Futures Support and Resistance Levels – S&P, Nasdaq, Dow Jones, Russell 2000, Dollar Index
3. Commodities Support and Resistance Levels – Gold, Euro, Crude Oil, T-Bonds
4. Commodities Support and Resistance Levels – Corn, Wheat, Beans, Silver
5. Futures Economic Reports for Tuesday October 1, 2013

Hello Traders,

For 2013 I would like to wish all of you discipline and patience in your trading! 

Higher volatility as debt ceiling deadline approaches any minute.

Be careful as market is capable of making sharp moves both ways.

Daily chart of the mini SP 500 for your review by clicking on:

https://www.sierrachart.com/image.php?l=13805734952.png


ES Daily Chart
ES Daily Chart
SERVICES
SOFTWARE
Day Trading/Order Flow
COMPANY
QUICK LINKS

Follow Us On Social Media

Cannon Trading Company, Inc., Commodity Broker, Beverly Hills, CA