Stock Indices React to FOMC with Largest One Day Drop in 4 Months – Aug 1st Levels
Posted By:- Ilan Levy-Mayer Vice President, Cannon Trading Futures Blog
Hello Traders,
For 2014 I would like to wish all of you discipline and patience in your trading!
I have noticed many times in the past that the “real direction to FOMC announcements, will usually come the following day”. Today was a perfect example of it…..
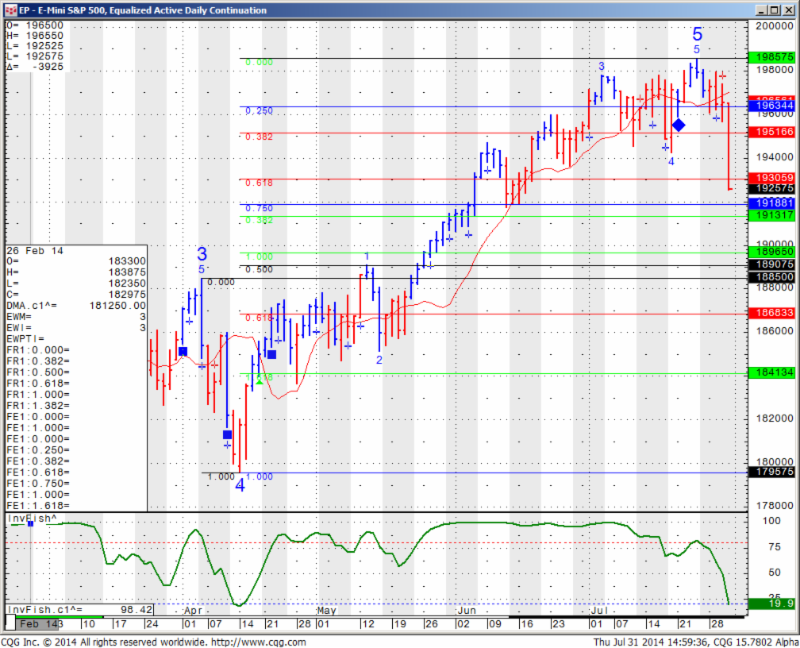
Last time we had a meaningful correction in the SP500 was April 4th. The correction lasted 10 days and measured 90 SP points from peak to valley 1885 to 1795 as you can see in the chart below ( sounds like I am talking about earthquakes….).If symmetry decides to give us a similar reaction we can see 1896 as the next target. In between we have a support zone at 1913 – 1918 first.
Daily chart of the Sept. mini SP 500 with the different levels for your review below:

EP – E-Mini S&P 500 Equalized Active Daily Continuation
If you like the information we share? We would appreciate your positive reviews on our new yelp!!
GOOD TRADING !
Trading Futures, Options on Futures, and retail off-exchange foreign currency transactions involves substantial risk of loss and is not suitable for all investors. You should carefully consider whether trading is suitable for you in light of your circumstances, knowledge, and financial resources. You may lose all or more of your initial investment. Opinions, market data, and recommendations are subject to change at any time. Past performance is not indicative to future results.
If you like Our Futures Trading Daily Support and Resistance Levels, Please share!
Futures Trading Levels
| Contract Sept. 2014 | SP500 | Nasdaq100 | Dow Jones | Mini Russell | Dollar Index |
| Resistance 3 | 1996.50 | 4038.75 | 17074 | 1164.70 | 81.84 |
| Resistance 2 | 1981.00 | 4004.50 | 16948 | 1154.10 | 81.75 |
| Resistance 1 | 1954.50 | 3950.25 | 16740 | 1136.00 | 81.65 |
| Pivot | 1939.00 | 3916.00 | 16614 | 1125.40 | 81.56 |
| Support 1 | 1912.50 | 3861.75 | 16406 | 1107.30 | 81.45 |
| Support 2 | 1897.00 | 3827.50 | 16280 | 1096.70 | 81.36 |
| Support 3 | 1870.50 | 3773.25 | 16072 | 1078.60 | 81.26 |
| Contract | December Gold | Sept.Silver | Sept. Crude Oil | September Bonds | Sept. Euro |
| Resistance 3 | 1311.8 | 2107.0 | 101.26 | 139 6/32 | 1.3434 |
| Resistance 2 | 1305.3 | 2092.5 | 100.56 | 138 15/32 | 1.3419 |
| Resistance 1 | 1294.3 | 2066.0 | 99.29 | 137 28/32 | 1.3404 |
| Pivot | 1287.8 | 2051.5 | 98.59 | 137 5/32 | 1.3389 |
| Support 1 | 1276.8 | 2025.0 | 97.32 | 136 18/32 | 1.3374 |
| Support 2 | 1270.3 | 2010.5 | 96.62 | 135 27/32 | 1.3359 |
| Support 3 | 1259.3 | 1984.0 | 95.35 | 135 8/32 | 1.3344 |
| Contract | Dec Corn | Sept. Wheat | Nov. Beans | Dec. SoyMeal | Dec. bean Oil |
| Resistance 3 | 374.4 | 531.9 | 1096.00 | 356.43 | 36.99 |
| Resistance 2 | 372.8 | 531.1 | 1091.00 | 353.87 | 36.84 |
| Resistance 1 | 369.9 | 530.7 | 1086.50 | 351.33 | 36.62 |
| Pivot | 368.3 | 529.8 | 1081.50 | 348.77 | 36.47 |
| Support 1 | 365.4 | 529.4 | 1077.0 | 346.2 | 36.3 |
| Support 2 | 363.8 | 528.6 | 1072.00 | 343.67 | 36.10 |
| Support 3 | 360.9 | 528.2 | 1067.50 | 341.13 | 35.88 |
source: http://www.forexfactory.com/calendar.php
All times are Eastern time Zone (EST)
This is not a solicitation of any order to buy or sell, but a current market view provided by Cannon Trading Inc. Any statement of facts here in contained are derived from sources believed to be reliable, but are not guaranteed as to accuracy, nor they purport to be complete. No responsibility is assumed with respect to any such statement or with respect to any expression of opinion herein contained. Readers are urged to exercise their own judgment in trading.


