Gold Outlook + Futures Trading Levels for April 2, 2024

Get Real Time updates and more by joining our Private Facebook Group!
Subscribe to our YouTube Channel


C35


First Week of Q2!

  • Heavy Fed Speeches, 19 Count ’em, Tuesday thru Friday with JPowell on Wednesday @ 11:10 a.m. CDT from Stanford.
  • Earnings season will officially begin the middle of April.
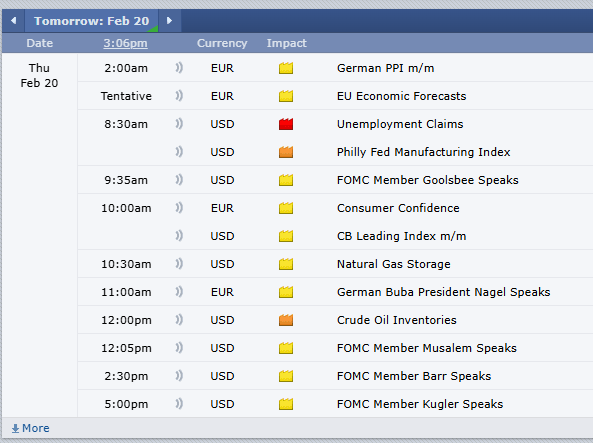
  • Economic Data Highlights : Jobless Claims early Thursday and NonFarm Payrolls headline Friday pre-opening
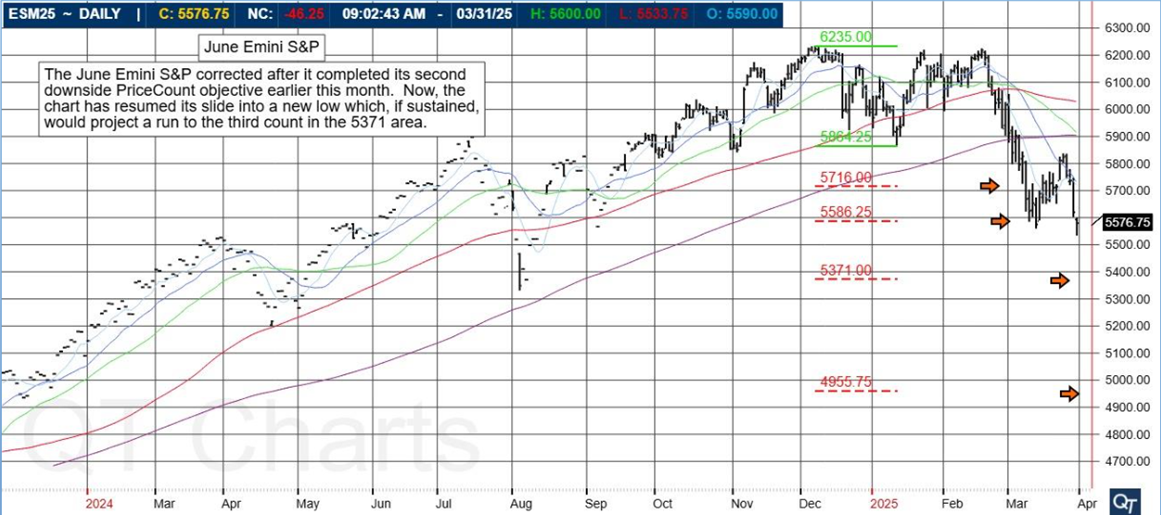
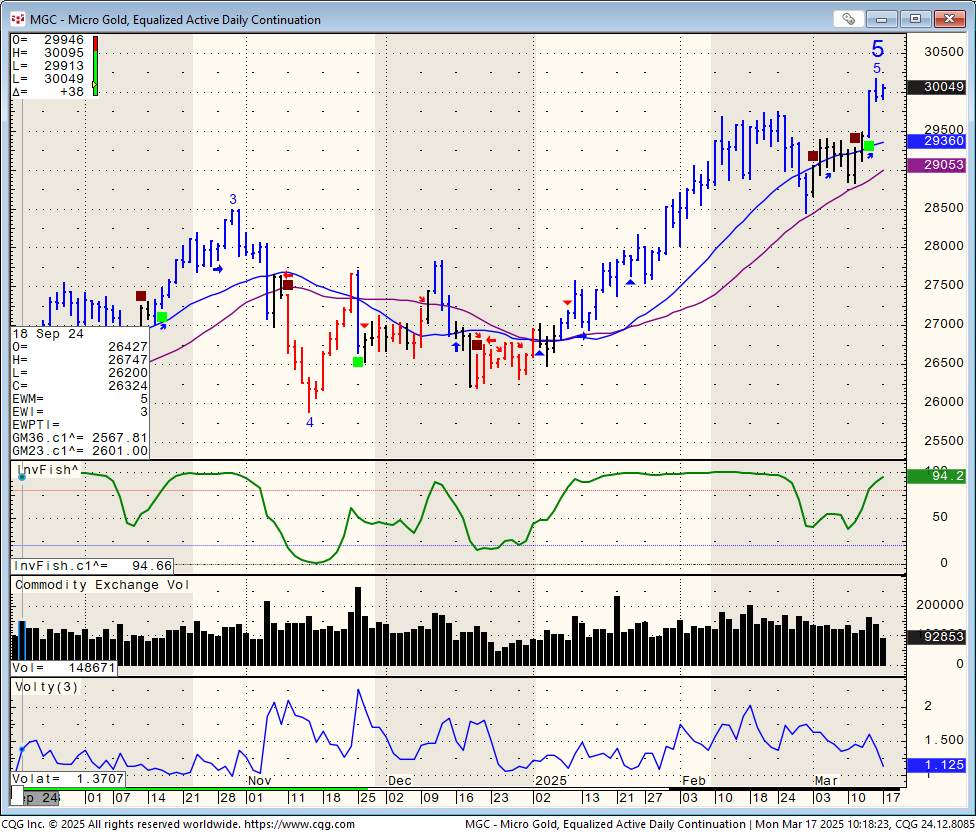
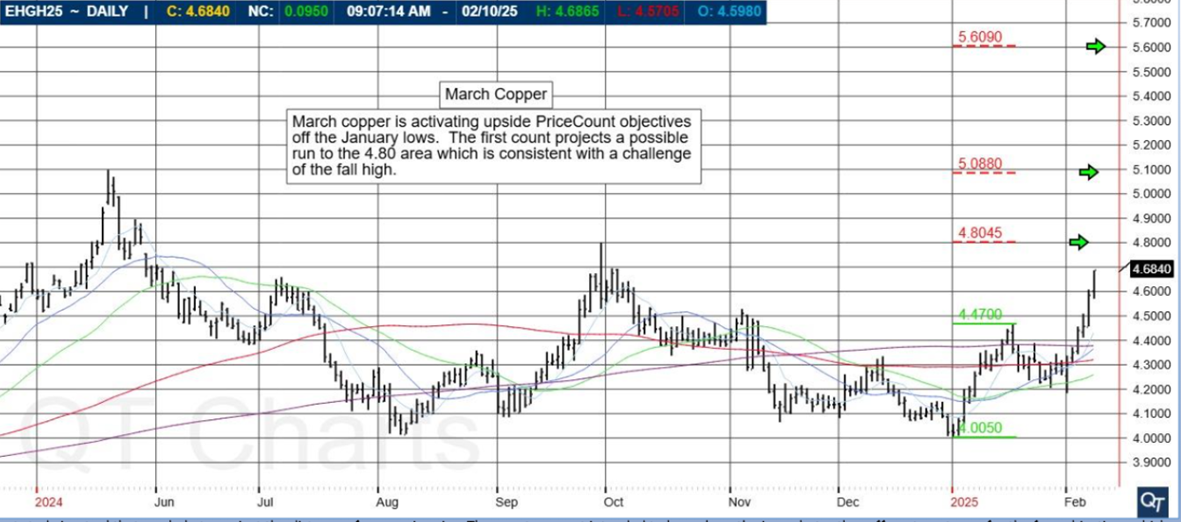
  • Gold Chart for your viewing below


9d030a51 bab9 46e6 89ea f013c8027406


4ee7278b 3e12 4019 8b79 e3382861f0be

Plan your trade and trade your plan


stars

e35cb555 9ff3 4f00 9fe8 0655b28fbd90

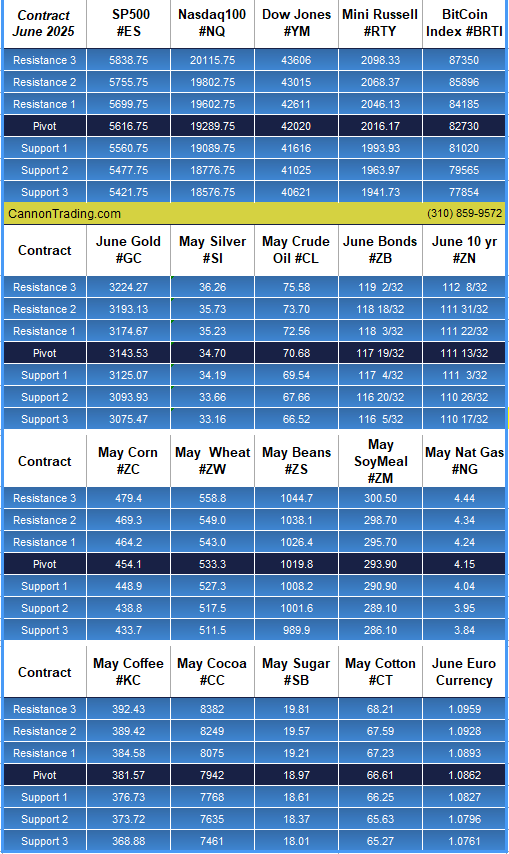
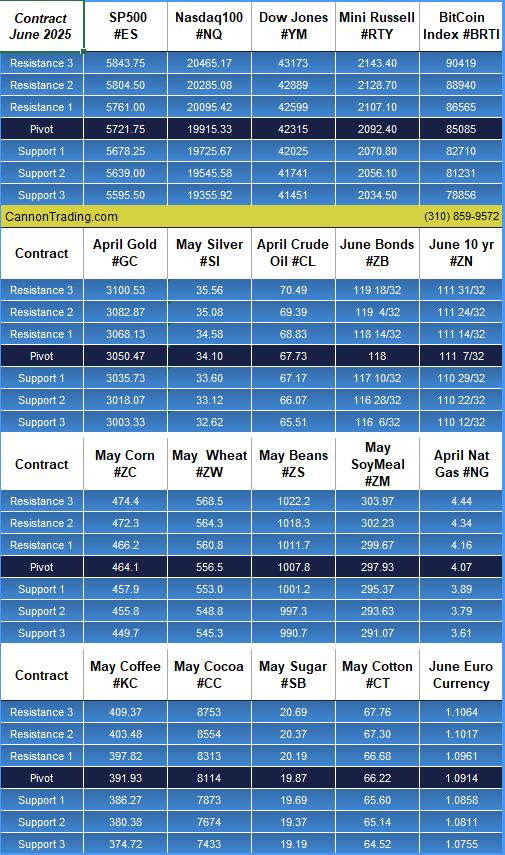
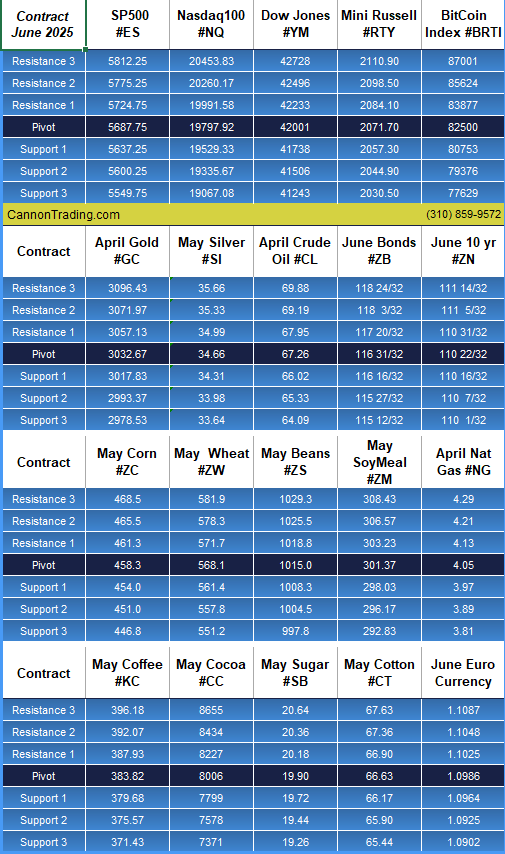
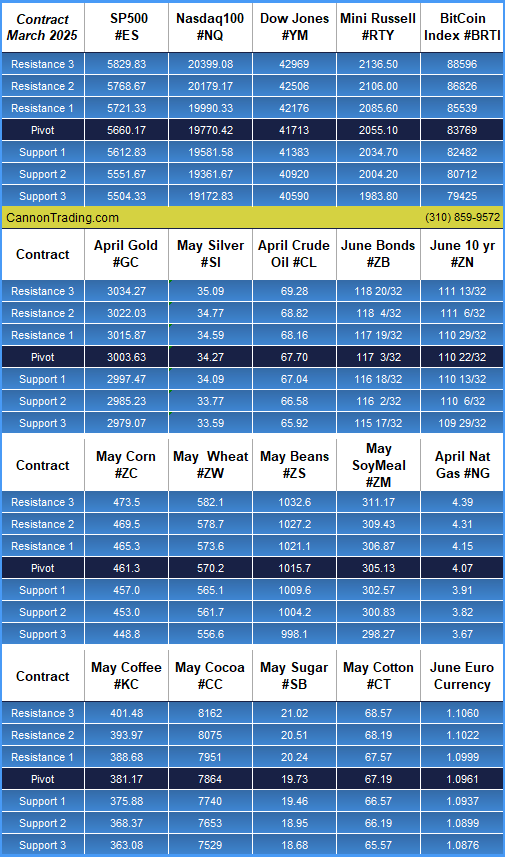
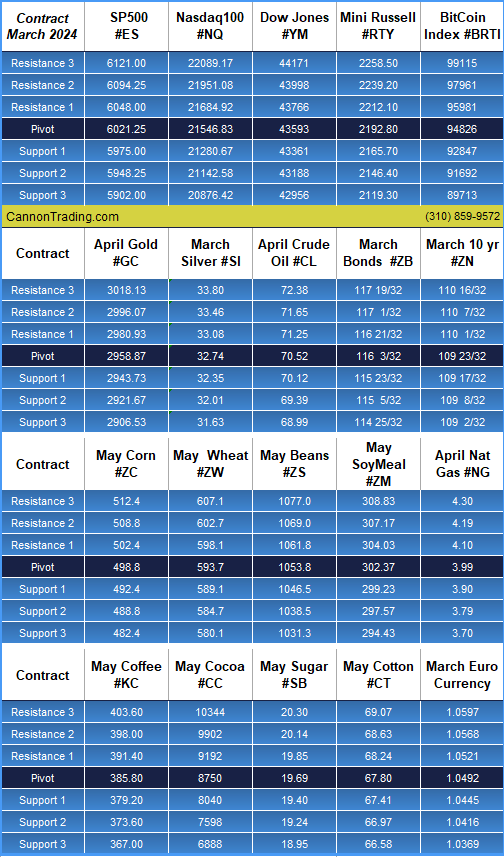
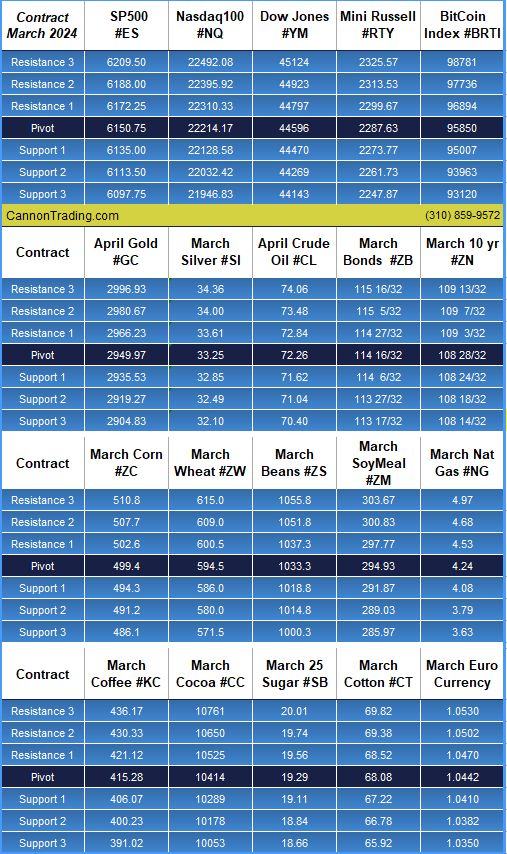
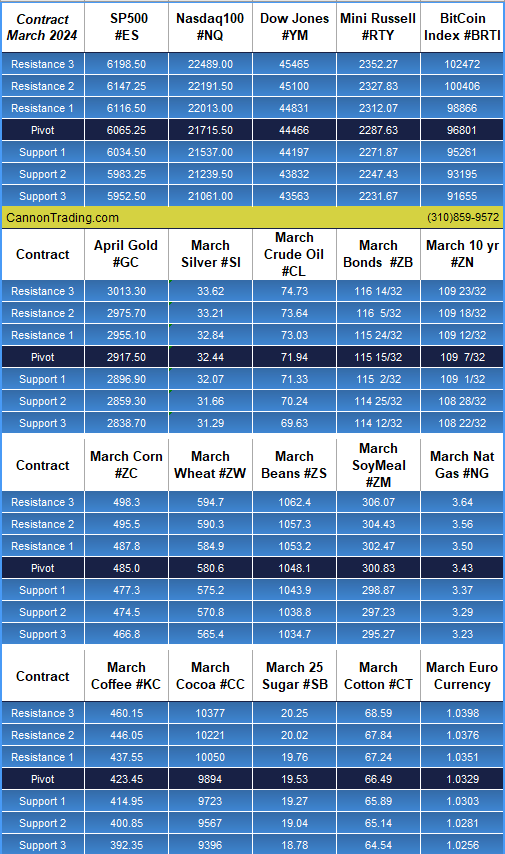
Daily Levels for April 2nd, 2024

b6b1a0dd 2eaf 4af9 bcd8 7c8b7e9715d7

thumbnail?url=http%3A%2F%2Fi.ytimg.com%2Fvi%2FJnHAMUGdNoM%2Fhqdefault

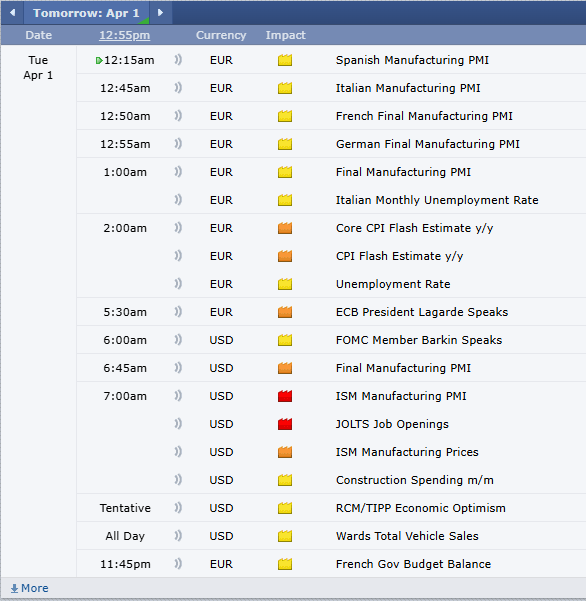
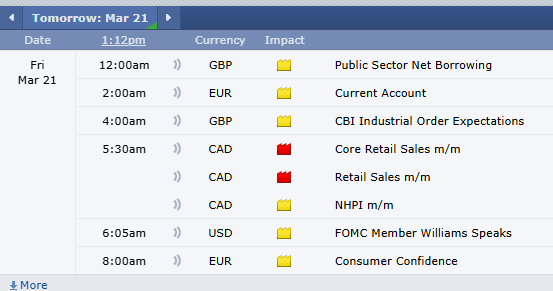
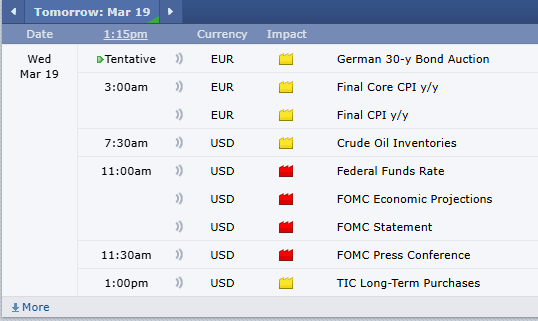
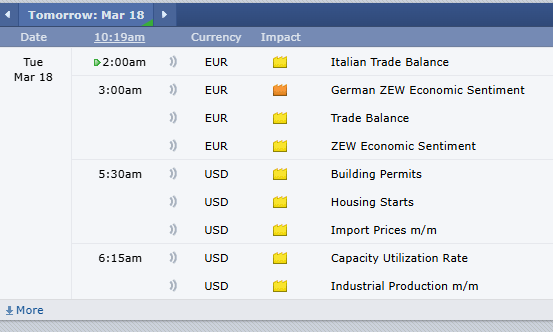
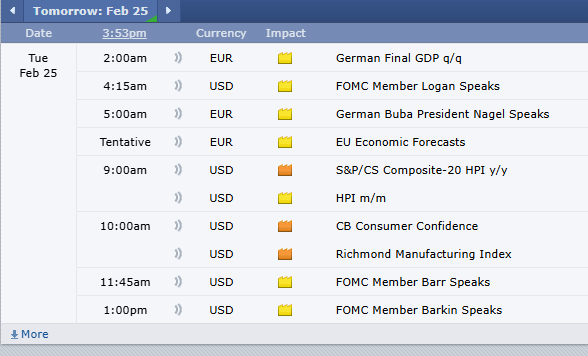
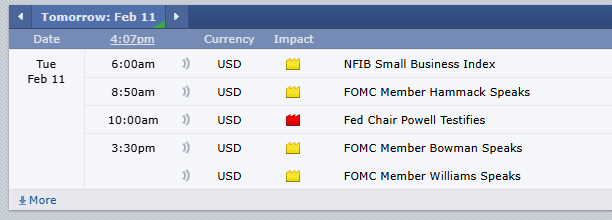
Economic Reports
provided by: ForexFactory.com
All times are Eastern Time ( New York)
76a21941 8f5f 45be 8344 a285dcf4b0e7

Improve Your Trading Skills

Get access to proprietary indicators and trading methods, consult with an experienced broker at 1-800-454-9572.

Explore trading methods. Register Here

3b644da2 2bee 4d39 8d98 5208a20bec39

* This is not a solicitation of any order to buy or sell, but a current market view provided by Cannon Trading Inc. Any statement of facts here in contained are derived from sources believed to be reliable, but are not guaranteed as to accuracy, nor they purport to be complete. No responsibility is assumed with respect to any such statement or with respect to any expression of opinion herein contained. Readers are urged to exercise their own judgement in trading.

Markets are closed tomorrow! Futures Trading Levels for April 1st

Get Real Time updates and more by joining our Private Facebook Group!
Subscribe to our YouTube Channel


C34


Markets are Closed Tomorrow!


aa10efaf 79df 42c5 8a2c a369230fa306


Plan your trade and trade your plan


stars

e35cb555 9ff3 4f00 9fe8 0655b28fbd90

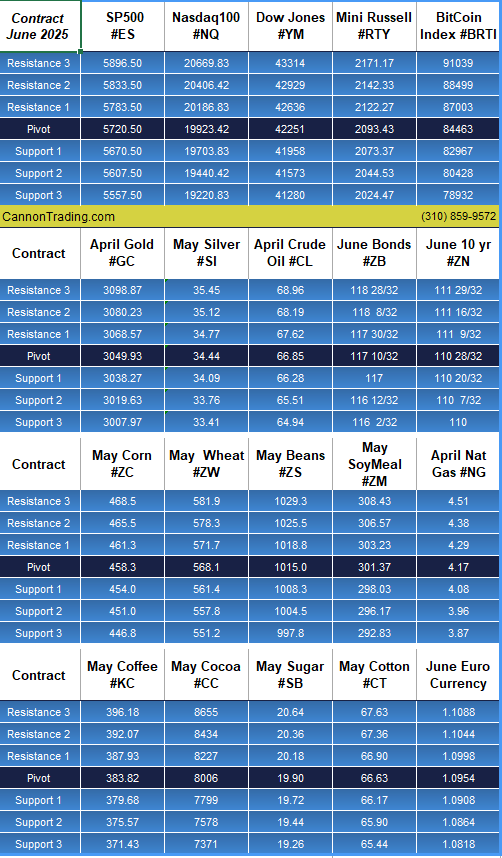
Daily Levels for March 28th, 2024

Levels 3.28

thumbnail?url=http%3A%2F%2Fi.ytimg.com%2Fvi%2FJnHAMUGdNoM%2Fhqdefault

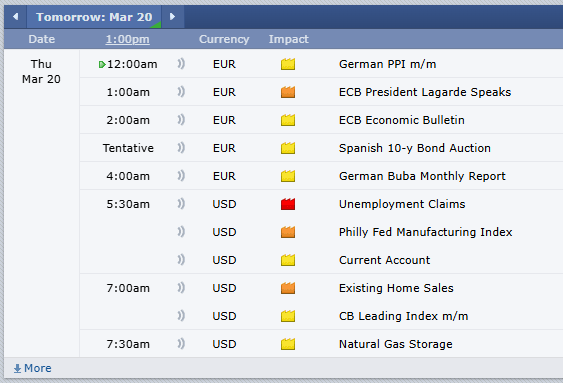
Economic Reports
provided by: ForexFactory.com
All times are Eastern Time ( New York)
FF 3.28

Improve Your Trading Skills

Get access to proprietary indicators and trading methods, consult with an experienced broker at 1-800-454-9572.

Explore trading methods. Register Here

3b644da2 2bee 4d39 8d98 5208a20bec39

* This is not a solicitation of any order to buy or sell, but a current market view provided by Cannon Trading Inc. Any statement of facts here in contained are derived from sources believed to be reliable, but are not guaranteed as to accuracy, nor they purport to be complete. No responsibility is assumed with respect to any such statement or with respect to any expression of opinion herein contained. Readers are urged to exercise their own judgement in trading.

Good Friday Schedule and Futures Trading Levels for March 28th

Get Real Time updates and more by joining our Private Facebook Group!
Subscribe to our YouTube Channel


C25


Good Friday Holiday Trading Schedule – 2024

  • Thursday March 28, 2024 all CME markets have a regular close.
  • No CME trading for Friday March 29, 2024 trade date in observance of Good Friday.
  • See full schedule here.


aa10efaf 79df 42c5 8a2c a369230fa306


Plan your trade and trade your plan


stars

e35cb555 9ff3 4f00 9fe8 0655b28fbd90

Daily Levels for March 28th, 2024

f3a34518 22f1 467c 9274 98c2c6ed58f0

b0ba1776 c0cd 4536 92c1 eef6595d7173

Economic Reports
provided by: ForexFactory.com
All times are Eastern Time ( New York)
df730780 4f5c 4d3f b456 839b8ca4fa8c

Improve Your Trading Skills

Get access to proprietary indicators and trading methods, consult with an experienced broker at 1-800-454-9572.

Explore trading methods. Register Here

3b644da2 2bee 4d39 8d98 5208a20bec39

* This is not a solicitation of any order to buy or sell, but a current market view provided by Cannon Trading Inc. Any statement of facts here in contained are derived from sources believed to be reliable, but are not guaranteed as to accuracy, nor they purport to be complete. No responsibility is assumed with respect to any such statement or with respect to any expression of opinion herein contained. Readers are urged to exercise their own judgement in trading.

Weekly Hueber Report: Now is it time to worry? Trading Levels for March 27th

Get Real Time updates and more by joining our Private Facebook Group!
Subscribe to our YouTube Channel


C33


The Following is analysis from Dan Hueber. You can find his analysis on Our QT Market Trading platform


Weekly Hueber Report: Now is it time to worry?


According to the Federal l Reserve Bank of New York, household debt in the United States grew by $212 billion to reach $17.5 trillion in the fourth quarter of last year. The lion’s share of this debt is wrapped up in mortgages and home equity lines of credit, which grew $112 billion during the quarter and reached $12.25 trillion. Auto loans rose $12 billion to $1.61 trillion, and student loans were flat at around $1.6 trillion, but the most significant percentage growth came via credit cards, which jumped $50 billion to $1.13 trillion.


5a13d0b4 a6a5 48cc a290 65d90fbed22a

Do keep in mind that as the overall population continues to grow, it is only natural for debt to expand along with it. Still, when you add in the fact that savings went backward during that same period, it would appear that the American consumer is increasingly relying on debt to meet day-to-day needs and wants. I should point out that savings balances have not slipped to as low as they were during the second quarter of 2022 and remain relatively consistent with the period between 2010 and 2018. However, both the amount being tucked away and the personal savings rate have been trending lower again.

e03bcb42 a23c 4b1d 9194 571e57e3713e

There is one more telling chart that we need to throw into the mix—the delinquency rate on credit cards. While nowhere near the nearly 7% level witnessed during the Great Recession or even the averages seen throughout much of the 1990s, it has been climbing steadily for the past two years and has risen to the highest level since the second quarter of 2011.

6dfc3180 7d60 42c0 b005 7fa2df52ca85

Granted, not all of this news has been bleak, at least not if you are in the banking sector. Last year, they reported an estimated $92 billion in earnings, and this after taking into account funding costs and loan losses. This is more than double what they were earning from credit cards a decade ago. As the old proverb says, one man’s poison is another man’s pleasure. While there are a number of other elements that factor into this, it should come as no surprise that recent surveys find that 41% of Americans believe they are worse off than four years ago. In case you were wondering, 24% say they are better off, and 34% said they were about the same. That still leaves the majority of people thinking that at least they have been holding their own, but these debt trends would appear to suggest that number may shrink in the months ahead.

**The views expressed above are entirely those of the author.

DH


Plan your trade and trade your plan


stars

e35cb555 9ff3 4f00 9fe8 0655b28fbd90

Daily Levels for March 27th, 2024

53ed0cce e698 47a5 8126 45cb8fda23cd

b0ba1776 c0cd 4536 92c1 eef6595d7173

Economic Reports
provided by: ForexFactory.com
All times are Eastern Time ( New York)
6eaa8ebc d1a1 4b54 9f6f d28f636b6a04

Improve Your Trading Skills

Get access to proprietary indicators and trading methods, consult with an experienced broker at 1-800-454-9572.

Explore trading methods. Register Here

3b644da2 2bee 4d39 8d98 5208a20bec39

* This is not a solicitation of any order to buy or sell, but a current market view provided by Cannon Trading Inc. Any statement of facts here in contained are derived from sources believed to be reliable, but are not guaranteed as to accuracy, nor they purport to be complete. No responsibility is assumed with respect to any such statement or with respect to any expression of opinion herein contained. Readers are urged to exercise their own judgement in trading.

What to expect on this short trading week? Trading Levels for March 26th

Get Real Time updates and more by joining our Private Facebook Group!
Subscribe to our YouTube Channel


C32


What to expect on this short trading week?

With Good Friday coming up we will only have 4 days trading week.

Fed Chair Jay Powell said Wednesday that central bank officials discussed a strategy for how to slow the shrinking of the Fed’s balance sheet,

The plan to slow down the balance-sheet runoff could come as soon as May.

The Fed’s securities holdings topped out at $9 trillion in 2022 — the year it decided to pivot and act aggressively to tamp down rising inflation. The strategy is known as quantitative tightening, or QT. QE refers to the Fed buying assets to lower longer-term interest rates, and QT means the Fed is selling assets to put upward pressure on longer-term rates. QE is used when the Fed wants to stimulate the economy and reduce interest rates on longer-term securities. The Fed tried QT once before, starting in 2017, when Janet Yellen oversaw the central bank. That shrinking of its portfolio drained bank reserves held at the central bank and led to some unexpected turbulence in 2019 after Powell had taken over.

Expectations that the Fed would cut rates by June rose to around 75% in futures markets later Wednesday, up from closer to 50% earlier this week, according to CME Group.

What about the hot PPI and CPI reports that came in last week? The latest data haven’t really changed the overall story, which is that of inflation moving down gradually on a sometimes-bumpy road toward 2%.

Many economists and some inside the Fed anticipated that the central bank’s rate increases to bring inflation down would lead to higher unemployment and a recession. But economic growth has shown surprising resilience even as wage and price increases have slowed thanks to healed supply chains and an influx of workers into the labor force.

Using the Fed’s preferred gauge, inflation excluding volatile food and energy prices has fallen to around 2.8% recently, down from 4.8% one year ago.

FED said while officials didn’t “see this in the data right now,” a significant slowdown in the labor market “could also be a reason for us to begin the process of reducing rates.

Wage growth has continued to slow, and unemployment has steadily inched up, from 3.4% last April to 3.9% in February.

The stakes are high for Fed officials, who are trying to navigate two risks. One is that they ease too soon, allowing inflation to become entrenched at a level above their 2% target. The other is that they move too slowly and the economy crumples under the weight of higher rates.

The Summary of Economic Projections expects gross domestic product growth to hit 2.1% by the end of 2024, up from December’s 1.4% forecast.

Higher housing prices and stock-market gains are boosting wealth and thus supporting consumption, especially of high-income households. The price of bitcoin has recently surged to records, a sign of exuberant risk-taking.

Homebuilders ETF: XHB. Stocks – KBH, TOL, LEN.

e52e93ca 1eb6 4e57 bf49 075fca870f38


Plan your trade and trade your plan


stars

e35cb555 9ff3 4f00 9fe8 0655b28fbd90

Daily Levels for March 26th, 2024

423d9498 0c19 4ee3 b8a6 65ddd7cce524

b0ba1776 c0cd 4536 92c1 eef6595d7173

Economic Reports
provided by: ForexFactory.com
All times are Eastern Time ( New York)
33270553 86ad 4288 9840 a636553ae386

Improve Your Trading Skills

Get access to proprietary indicators and trading methods, consult with an experienced broker at 1-800-454-9572.

Explore trading methods. Register Here

3b644da2 2bee 4d39 8d98 5208a20bec39

* This is not a solicitation of any order to buy or sell, but a current market view provided by Cannon Trading Inc. Any statement of facts here in contained are derived from sources believed to be reliable, but are not guaranteed as to accuracy, nor they purport to be complete. No responsibility is assumed with respect to any such statement or with respect to any expression of opinion herein contained. Readers are urged to exercise their own judgement in trading.

Markets Post FOMC + Levels for March 21st 2024

Get Real Time updates and more by joining our Private Facebook Group!
Subscribe to our YouTube Channel


C6


Life After FOMC …..

by Mark O’Brien, Senior Broker

General: 


The Federal Reserve took center stage today.  With inflation proving stickier than expected, the central bank has found itself balancing between a hawkish and dovish view.  The policy-setting FOMC held interest rates steady at the 5.25%-5.50% range for the fifth straight meeting.  The bigger indicator traders were eager to see was the Fed governors’ so-called dot plot that updated their rate and economic projections – for the first time since December.  Turns out, it didn’t deviate from the three rate cuts they previously penciled in by the end of 2024.


Indexes: 


As of this typing, the June E-mini S&P 500 is trading at new all-time highs around 5280.  As well, the June E-mini Dow Jones is trading at its own all-time highs, barely 100 points away from 40,000!


Metals: 


April gold is on the verge of eking out its own all-time high close above last Monday’s closing price of $2,188.60 per ounce.  It’s currently trading ±$2,191.00 per ounce


General pt. II: 


Over the weekend, Japan ended its negative interest rate policy, marking a historic shift away from an aggressive monetary easing program that was implemented years ago to fight chronic deflation.  As part of the decision, the Bank of Japan (BOJ) raised interest rates for the first time in 17 years, lifting its short-term rate to “around zero to 0.1%” from minus 0.1%.


Plan your trade and trade your plan


stars

e35cb555 9ff3 4f00 9fe8 0655b28fbd90

Daily Levels for March 21st, 2024

6d8c1969 faeb 45ef 86a7 555be3b55b38

b0ba1776 c0cd 4536 92c1 eef6595d7173

Economic Reports
provided by: ForexFactory.com
All times are Eastern Time ( New York)
f2a43cd3 379e 4c80 890c 0fe7e5f0d898

Improve Your Trading Skills

Get access to proprietary indicators and trading methods, consult with an experienced broker at 1-800-454-9572.

Explore trading methods. Register Here

3b644da2 2bee 4d39 8d98 5208a20bec39

* This is not a solicitation of any order to buy or sell, but a current market view provided by Cannon Trading Inc. Any statement of facts here in contained are derived from sources believed to be reliable, but are not guaranteed as to accuracy, nor they purport to be complete. No responsibility is assumed with respect to any such statement or with respect to any expression of opinion herein contained. Readers are urged to exercise their own judgement in trading.

Weekly Newsletter: Understanding Price Banding, May Bean Oil Outlook and Automated Gold System

Get Real Time updates and more by joining our Private Facebook Group!
Subscribe to our YouTube Channel

C27

Cannon Futures Weekly Letter Issue # 1186

In this issue:
  •  Important Notices – FOMC Next Week
  • Trading Resource of the Week – Understanding Price Limits and Banding
  • Hot Market of the Week – May Bean Oil
  • Broker’s Trading System of the Week – Gold Swing System
  • Trading Levels for Next Week
  • Trading Reports for Next Week


Important Notices –

  • FOMC Meeting next week. Announcement on Wednesday.
  • Light data most of the week. Housing sales
  • Very few earnings
  • June is front month for indices, currencies and financials.: M = June
  • USA is on daylight savings time – most international countries have NOT changed yet.


Trading Resource of the Week : What are Price Limits and Price Banding? by CMEgroup.com

As a trader, you want to know that there are mechanisms in place to ensure an orderly market. A regulated marketplace like CME Group provides this order by setting price limits and price banding.
Price Limits
Price limits are the maximum price range permitted for a futures contract in each trading session. These price limits are measured in ticks and vary from product to product. When markets hit the price limit, different actions occur depending on the product being traded. Some markets may temporarily halt until price limits can be expanded or trading may be stopped for the day based on regulatory rules. Different futures contracts will have different price limit rules; i.e. Equity Index futures have different rules than Agricultural futures.
Example
Equity Indexes futures have a three level expansion: 7%, 13% and 20% to the downside, and a 7% limit up and down in overnight trading.
When price reaches any of those levels the market will go limit up or limit down.
Calculating Price Limits
Price limits are re-calculated daily and remain in effect for all trading days except in certain physically-deliverable markets, where price limits are lifted prior to expiration so that futures prices are not prevented from converging on prices for the underlying commodity.
Typically, Agricultural futures will go limit up or down most often compared to Equity Index futures which very rarely if ever go limit up or down. When trading a specific product, it is important to be aware of price limits and the mechanisms that occur when limits are hit. Traders also know that it is possible for limits to be reached for more than one session in a row, however the expansion of limit thresholds over the last few years have reduced this occurrence.
Price Banding
Price banding is a similar mechanism which subjects all orders to price validation and rejects orders outside the given band to maintain orderly markets. Bands are calculated dynamically for each product based on the last price, plus or minus a fixed band value. Thus, if markets quickly move in one direction, the price bands dynamically adjust to accommodate new trading ranges.
Conclusion
The rules for each market can be found on cmegroup.com.
It is important to note that traders can place trades outside the daily price limits. These trades will be executed when price limits and price bands move within the specified range. So, traders still have the ability to place good-til-canceled or good-til-date orders inside and outside daily price limits.
In the last few years there are fewer and fewer times that markets will actually go limit up or down, but it is important to be aware of these pricing rules when you trade.
efa302e7 662d 4483 85eb 5655e4b45680


stars

3b644da2 2bee 4d39 8d98 5208a20bec39


  • Hot Market of the Week – May Bean Oil
Hot market of the week is provided by QT Market Center, A Swiss army knife charting package that’s not just for Hedgers, Cooperatives and Farmers alike but also for Spread traders, Swing traders and shorter time frame application for intraday traders with a unique proprietary indicator that can be applied to your specific trading needs.
May Bean Oil
The rally in May soybean oil accelerated to its second upside PriceCount objective and now the chart is correcting. At this point, IF you can resume the rally with new sustained highs, the third count would project a possible run to the 50.87 area.
PriceCounts – Not about where we’ve been , but where we might be going next!
5bd46875 4f13 4f46 8290 888342486818
The PriceCount study is a tool that can help to project the distance of a move in price. The counts are not intended to be an ‘exact’ science but rather offer a target area for the four objectives which are based off the first leg of a move with each subsequent count having a smaller percentage of being achieved. It is normal for the chart to react by correcting or consolidating at an objective and then either resuming its move or reversing trend. Best utilized in conjunction with other technical tools, PriceCounts offer one more way to analyze charts and help to manage your positions and risk. Learn more at www.qtchartoftheday.com
Trading in futures, options, securities, derivatives or OTC products entails significant risks which must be understood prior to trading and may not be appropriate for all investors. Past performance of actual trades or strategies is not necessarily indicative of future results.
  • Broker’s Trading System of the Week

With algorithmic trading systems becoming more prevalent in portfolio diversification, the following system has been selected as the broker’s choice for this month.
Spartan Gold
PRODUCT
SYSTEM TYPE
Swing
COST
USD 75 / monthly
Recommended Cannon Trading Starting Capital
$20,000
846f5ed4 d467 4de2 9c1d 75acf0c4f4af
The performance shown above is hypothetical in that the chart represents returns in a model account. The model account rises or falls by the average single contract profit and loss achieved by clients trading actual money pursuant to the listed system’s trading signals on the appropriate dates (client fills), or if no actual client profit or loss available – by the hypothetical single contract profit and loss of trades generated by the system’s trading signals on that day in real time (real‐time) less slippage, or if no real time profit or loss available – by the hypothetical single contract profit and loss of trades generated by running the system logic backwards on back adjusted data. Please read full disclaimer HERE.
Would you like to receive daily support & resistance levels?
Yes
S
No
S


Daily Levels for March 18th 2024

b6a2bf3a a499 4edd 8d8e e4d3d22769b4

Trading Reports for Next Week

58d4627d b4e3 4117 a10c 1ddf826463a9
First Notice (FN), Last trading (LT) Days for the Week:

Improve Your Trading Skills

Get access to proprietary indicators and trading methods, consult with an experienced broker at 1-800-454-9572.

Explore trading methods. Register Here

871e501d 3a1d 4e83 8ee9 a2be76e7992f

* This is not a solicitation of any order to buy or sell, but a current market view provided by Cannon Trading Inc. Any statement of facts here in contained are derived from sources believed to be reliable, but are not guaranteed as to accuracy, nor they purport to be complete. No responsibility is assumed with respect to any such statement or with respect to any expression of opinion herein contained. Readers are urged to exercise their own judgement in trading.

Triple Witching Tomorrow + Futures trading Levels for March 15th

Get Real Time updates and more by joining our Private Facebook Group!
Subscribe to our YouTube Channel


C26


TriPPPle witching tomorrow!

Stock Index March contracts (i.e., the E-mini and Micro S&P, Nasdaq, Dow Jones and Russell 2000.) expire Friday, March15th (8:30 A.M., Central Time). At that point, trading in these contracts halts. Stock index futures are CASH SETTLED contracts. If you hold any December futures contracts through 8:30 A.M., Central Time on Friday, Mar. 15th, they will be offset with the cash settlement price, as set by the exchange.

FRONT MONTH IS NOW JUNE , the symbol is M24, example for mini SP is ESM24

 Monday, March 18th is Last Trading Day for December currency futures. It is of the utmost importance for currency traders to exit all March futures contracts by Friday, March 15th and to start trading the June futures. Currency futures are DELIVERABLE contracts.

The month code for June is ‘M.’  Please consider carefully how you place orders when changing over.


Plan your trade and trade your plan


Watch video below on how to rollover from March to June contracts if you are a stock index trader on our E-Futures Platform!


thumbnail?url=http%3A%2F%2Fi.vimeocdn


stars

e35cb555 9ff3 4f00 9fe8 0655b28fbd90

Daily Levels for March 15th, 2024

d69d3d2b f11a 4e36 a041 cab7eee5bea1

b0ba1776 c0cd 4536 92c1 eef6595d7173

Economic Reports
provided by: ForexFactory.com
All times are Eastern Time ( New York)
312e053e 316d 43cd 8973 a7eb9de16fd2

Improve Your Trading Skills

Get access to proprietary indicators and trading methods, consult with an experienced broker at 1-800-454-9572.

Explore trading methods. Register Here

3b644da2 2bee 4d39 8d98 5208a20bec39

* This is not a solicitation of any order to buy or sell, but a current market view provided by Cannon Trading Inc. Any statement of facts here in contained are derived from sources believed to be reliable, but are not guaranteed as to accuracy, nor they purport to be complete. No responsibility is assumed with respect to any such statement or with respect to any expression of opinion herein contained. Readers are urged to exercise their own judgement in trading.

Rollover, CPI & Futures Trading Levels for 03.12.24

Get Real Time updates and more by joining our Private Facebook Group!
Subscribe to our YouTube Channel


C3 1


CPI Tomorrow – Trade June ES/NQ/YM and MICROS

by John Thorpe, Senior Broker


For all of you index traders, you may have noticed the shrinking Open Interest and Volume in the March contracts. It’s that time when volume shifts to the next quarterly expiration contract. June! the symbol is M.

March volume will be drying up quickly, don’t get stuck Friday morning with a March contract at the crack of dawn when the carousel stops. Start trading the June contract today!

According to Bloomberg, the S&P 500 has averaged an 0.8% move on CPI days over the past six months

Today, stocks are sideways, the dollar and gold are both up marginally as investors nervously await tomorrows 7:30 a.m. CDT Consumer Price Index release.

Last Month, on Feb 13th stocks slid sharply following the release and Treasury yields surged higher when a surprise CPI number, an Increase of 0.3% in January, crossed the newswires. Housing costs accounted for much of the price rise.

Overall prices are expected to rise 0.4% percent after increasing 0.3% percent in January. Annual rates, which in January were 3.1% percent overall and 3.9% percent for the core, are expected at 3.1% and 3.7% percent respectively. Per econoday.


Plan your trade and trade your plan


Watch video below on how to rollover from March to June contracts if you are a stock index trader on our E-Futures Platform!


thumbnail?url=http%3A%2F%2Fi.vimeocdn


37d7a522 9491 476e bccd 5d86442eda21


stars

e35cb555 9ff3 4f00 9fe8 0655b28fbd90

Daily Levels for March 12th, 2024

700b4a89 9678 42c2 b57f 894fc90822f3

b0ba1776 c0cd 4536 92c1 eef6595d7173

Economic Reports
provided by: ForexFactory.com
All times are Eastern Time ( New York)
1c9e26e4 46da 486b bf63 f4f09f2959a4

Improve Your Trading Skills

Get access to proprietary indicators and trading methods, consult with an experienced broker at 1-800-454-9572.

Explore trading methods. Register Here

3b644da2 2bee 4d39 8d98 5208a20bec39

* This is not a solicitation of any order to buy or sell, but a current market view provided by Cannon Trading Inc. Any statement of facts here in contained are derived from sources believed to be reliable, but are not guaranteed as to accuracy, nor they purport to be complete. No responsibility is assumed with respect to any such statement or with respect to any expression of opinion herein contained. Readers are urged to exercise their own judgement in trading.

NFP Tomorrow, Bitcoin Futures+ Futures Trading Levels for 03.08.24

Get Real Time updates and more by joining our Private Facebook Group!
Subscribe to our YouTube Channel


C22


NFP Tomorrow.

Non Farm payrolls – market moving report.

I personally like to be out few minutes before the report and look to get back in after the “smoke clears”.

I know some traders who try to play the extremes by placing buy orders on the lower bands and/or sell orders on the upper bands and attach automated brackets to these orders, trying to take advantage of the fast market moves.

Refer back to your journal and keep notes.


Bitcoin Futures on The Chicago Mercantile Exchange

e7e6a38b 9cb4 4b0c aef6 d71bc54709e5


With Bitcoin reaching unprecedented levels, investors are seeking dependable ways to participate. Apart from ETFs and complex offshore entities, the CME Group offers straightforward access to Futures on Bitcoin, Micro Bitcoin, Ether, and Micro Ether futures. Utilize a licensed broker to trade these futures on the esteemed CME Group exchange. Opportunities for engagement range from 1. self-directed trading 2. demo trials 3. opening an account seeking advice from a seasoned broker.


Plan your trade and trade your plan


stars

e35cb555 9ff3 4f00 9fe8 0655b28fbd90

Daily Levels for March 8th, 2024

d43ec5e6 eea6 41ef 8cb9 395920bf3c9a

b0ba1776 c0cd 4536 92c1 eef6595d7173

Economic Reports
provided by: ForexFactory.com
All times are Eastern Time ( New York)
cdfb666b 4ee1 4846 aeb2 424b5727c665

Improve Your Trading Skills

Get access to proprietary indicators and trading methods, consult with an experienced broker at 1-800-454-9572.

Explore trading methods. Register Here

3b644da2 2bee 4d39 8d98 5208a20bec39

* This is not a solicitation of any order to buy or sell, but a current market view provided by Cannon Trading Inc. Any statement of facts here in contained are derived from sources believed to be reliable, but are not guaranteed as to accuracy, nor they purport to be complete. No responsibility is assumed with respect to any such statement or with respect to any expression of opinion herein contained. Readers are urged to exercise their own judgement in trading.