
|
|||||||||||||||||||||||||||||||||||||||||||||||||||||||||||||||||||||||||||||||||||||||||||||||||
|
|||||||||||||||||||||||||||||||||||||||||||||||||||||||||||||||||||||||||||||||||||||||||||||||||
|

|
|||||||||||||||||||||||||||||||||||||||||||||||||||||||||||||||||||||||||||||||||||||||||||||||||
|
|||||||||||||||||||||||||||||||||||||||||||||||||||||||||||||||||||||||||||||||||||||||||||||||||
|
|
|||||||||||||||||||||||||||||||||||||||||||||||||||||||||||
|
|||||||||||||||||||||||||||||||||||||||||||||||||||||||||||
|

|
||||||||||||||||||||||||||||||||||||||||||||||||||||||||||
|
||||||||||||||||||||||||||||||||||||||||||||||||||||||||||
|

|
|
|

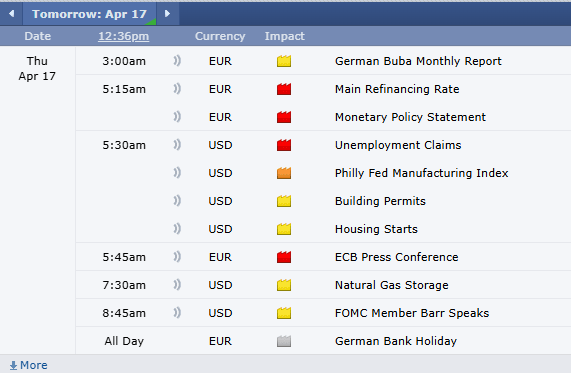
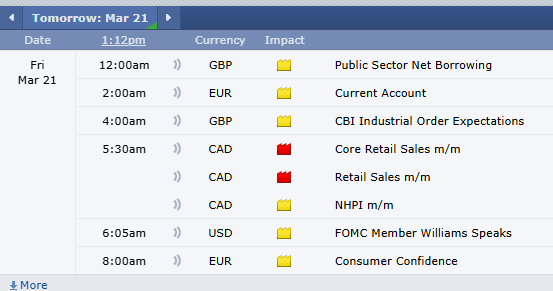
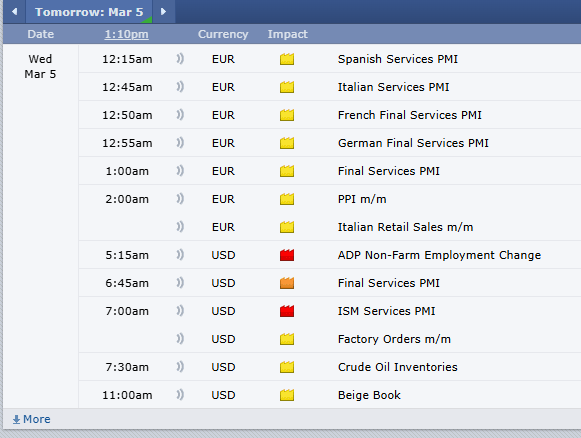
provided by: ForexFactory.com
All times are Eastern Time (New York)
|
||||||||||||||||||||||||||||
|
||||||||||||||||||||||||||||
|
By Mark O’Brien, Senior Broker
Zero-day options are normal options — puts and calls — that expire in less than one day, hence the “0DTE” nickname (short for “zero days to expiration”).
In the current high-volatility environment we’re experiencing – one very likely to last awhile – one of the better alternatives to day trading, particularly in stock index futures like the E-mini S&P 500, E-mini Nasdaq, etc., is buying short-term call and put options.
With expirations every day of the week, stock index futures options can be purchased with minimal overall time value and give you a maximum risk coupled with a limitless upside potential.
Especially with markets seemingly hair-triggered to make large daily moves, but with erratic action intraday, the purchase of a limited-risk option provides staying power that no amount of rapid in-and-out trading trying to catch a large move can outperform.

provided by: ForexFactory.com
All times are Eastern Time (New York)
|
||||||||||||||||||||||||||||
|
||||||||||||||||||||||||||||
|


As of this typing stock index futures and other futures contracts have experienced single-day range moves not seen in years and after being down, finished up:
→ E-mini Dow Jones: UP +3044 points / 8.4%
→ E-mini S&P 500: UP +480 points / 9.5%
→ E-mini Nasdaq: UP +2038 points / 11.71%
→ Crude Oil: UP +320 points / 5.2%
This is a completely different environment of extreme trading volatility than what we were trading in 3-4 weeks ago. Markets are evolving and you must adapt your trading to changing market conditions.
This is where you find out what kind of risk taker you are; brash, overbold, unheeding, or prudent, attentive, discriminating. Everyone possesses these traits – and they influence our decision-making differently in different situations.
In trading, if the historical price moves you’re seeing bring out the daredevil in you, plan to watch your trade results all over the place: up and down more than your everyday swings with the odds increasing your account will hit a wall.
Instead, incorporate patience and prudence. Start your trading by setting daily profit targets and daily loss limits and stick to them. Do that for each trade. These days, be aware of LIMIT moves and understand what happens when the market halts at limit levels.
Find daily price limits for CME Group Agricultural, Cryptocurrency, Energy, Equity Index, Interest Rates, and Metals products: click here.
|

provided by: ForexFactory.com
All times are Eastern Time (New York)
|
||||||||||||||||||||||||||||
|
||||||||||||||||||||||||||||
|


Stock index futures dipped today, led lower as pressure on the tariff front mounted. The June E-mini S&P 500 Futures contract lost ±1.4%, while the E-mini Dow traded ±250 points lower, or 0.6%. The E-mini Nasdaq shed about 2%.
Stock index futures hit session lows after the White House said that President Donald Trump will unveil new tariffs on auto imports during a press conference at 4 p.m. ET. This will come ahead of a broad array of additional levies expected to be revealed next week.
Discover new tools for planting season ahead of key reports. The upcoming Prospective Plantings report can significantly impact market prices, especially if the actual numbers differ from pre-release estimates. New Weekly options on crops such as Corn, Soybean, Soybean Meal, Soybean Oil and Chicago Wheat offer more precise risk management around the report’s release.
Micro Corn futures, Micro Wheat futures, Micro Soybean futures, Micro Soybean Meal futures and Micro Soybean Oil futures were launched on February 24, 2025, with the first weeks of trading already providing meaningful liquidity.
Financially settled Micro Agricultural futures allow customers to stay in their position closer to expiration, with no risk of physical delivery.
New Micro Agricultural futures are a tool for retail traders looking to gain exposure to commodity markets without incurring the risk of physical delivery and with less margin costs than standard Agricultural futures.
Small- to medium-size farmers can take advantage of Micro Agricultural futures to hedge parts of their expected harvest, without having to rely on standard Grains futures contracts of 5,000 bushels (according to the USDA, the average farm in the U.S. consists of 464 acres).
On December 31st, March copper futures settled at 4.0265. Today, they were trading at about 5.22; an increase of about 30% in the first three months of the year and a 5+ year high. This dramatic price action is driven by traders pricing in the possibility of hefty tariffs on the crucial industrial metal. The price gap between U.S. copper futures and the global benchmark on the London Metal Exchange has widened to record levels, creating a powerful incentive for traders to shift copper into the United States.

provided by: ForexFactory.com
All times are Eastern Time (New York)
|
||||||||||||||||||||||||||||
|
||||||||||||||||||||||||||||
|

|
|
|
|
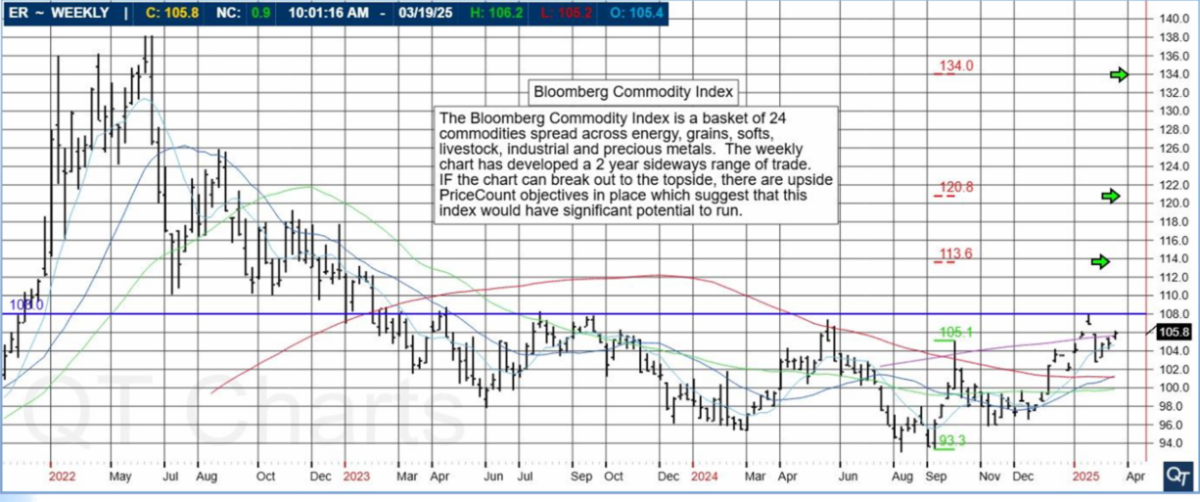
Chart above is provided by QT Market Center, A Swiss army knife charting package that’s not just for Hedgers, Cooperatives and Farmers alike but also for Spread traders, Swing traders and shorter time frame application for intraday traders with a unique proprietary indicator that can be applied to your specific trading needs.
The PriceCount study is a tool that can help to project the distance of a move in price. The counts are not intended to be an ‘exact’ science but rather offer a target area for the four objectives which are based off the first leg of a move with each subsequent count having a smaller percentage of being achieved. It is normalfor the chart to react by correcting or consolidating at an objective and then either resuming its move or reversing trend. Best utilized in conjunction with other technical tools, PriceCounts offer one more way to analyze charts and help to manage your positions and risk. Learn more at www.qtchartoftheday.com
Trading in futures, options, securities, derivatives or OTC products entails significant risks which must be understood prior to trading and may not be appropriate for all investors. Past performance of actual trades or strategies is not necessarily indicative of future results.

provided by: ForexFactory.com
All times are Eastern Time (New York)
|
||||||||||||||||||||||||||||
|
||||||||||||||||||||||||||||
|


|
|
|

provided by: ForexFactory.com
All times are Eastern Time (New York)
|
||||||||||||||||||||||||||||
|
||||||||||||||||||||||||||||
|