|
|
|
||||||||||||||||||||||||||||||||||||||||||||||||||||
|
||||||||||||||||||||||||||||||||||||||||||||||||||||
|
|
|
|
||||||||||||||||||||||||||||||||||||||||||||||||||||
|
||||||||||||||||||||||||||||||||||||||||||||||||||||
|


Trading the S&P 500 via futures is a powerful, flexible, and efficient way to gain exposure to the broad U.S. equity market, hedge existing portfolios, or express directional views with leverage. But doing so successfully requires more than just picking a direction — it requires the backing of a strong, responsive, knowledgeable futures broker.
In this long-form article, we’ll explore how your futures broker can materially assist you in S&P 500 futures trading (sometimes called futures SP, SP 500 futures trading, or simply “SP futures”) and then dive deeply into how Cannon Trading Company exemplifies each of those beneficial traits. We’ll integrate references to CannonX powered by CQG, the many 5 out of 5-star ratings on TrustPilot, decades of experience in the industry, regulatory reputation, platform selection, and more.
Before focusing on broker support, it helps to recap what makes S&P 500 futures such an attractive instrument (and why a futures broker matters).
But with these advantages come risks: leverage can magnify losses, margin calls loom, volatility can surprise, and you may need swift help in emergencies. That’s where the quality of your futures broker becomes critical.
A competent futures broker adds value well beyond merely executing your orders. Below are key roles and services a futures broker plays in helping you trade the S&P 500.

ow that we’ve laid out what a strong futures broker should offer, let’s examine how Cannon Trading Company stands as a real-world example of a broker that delivers on all those fronts — particularly for s&p 500 futures, futures SP, and SP 500 futures trading.
Cannon Trading Company has been operating since 1988 (over 35 years), giving it institutional depth, continuity, and resilience. Trustpilot+2Cannon Trading Company, Inc.+2 That long track record means that clients benefit from lessons across multiple market cycles, regulatory shifts, and technological transitions.
In blog content published by Cannon, the firm often points out that their decades of experience in the futures industry are a differentiator when interpreting macro and technical signals in the S&P 500 futures market. Cannon Trading Company, Inc.+2Cannon Trading Company, Inc.+2
Cannon Trading boasts numerous 5 out of 5-star ratings on TrustPilot, often cited in their marketing and client testimonials. Trustpilot+4Cannon Trading Company, Inc.+4Cannon Trading Company, Inc.+4 They maintain a TrustScore effectively near 4.9 to 5.0, with over 500 reviews. Cannon Trading Company, Inc.+3Trustpilot+3Cannon Trading Company, Inc.+3 Client reviews frequently mention how they feel “one call away,” or how brokers have helped during technical issues, which maps directly to the value of voice support and emergency assistance. Cannon Trading Company, Inc.+2Cannon Trading Company, Inc.+2
Cannon is a member of the National Futures Association (NFA) and subject to Commodity Futures Trading Commission (CFTC) regulations. Trustpilot+2Cannon Trading Company, Inc.+2 Their public statements emphasize a “pristine reputation with federal and independent futures industry regulators alike.” Cannon Trading Company, Inc.+3Cannon Trading Company, Inc.+3Cannon Trading Company, Inc.+3 In addition, they often promote that regulatory confidence is essential for futures traders in high-leverage markets like futures SP. Cannon Trading Company, Inc.+3Cannon Trading Company, Inc.+3Cannon Trading Company, Inc.+3
Because the futures industry is heavily regulated, knowing your broker is credible, transparent, and compliant is non-negotiable — especially when trading S&P 500 futures.
Platform excellence and technological depth: CannonX powered by CQG
One of Cannon’s standout offerings is CannonX powered by CQG — their flagship platform that combines CQG’s powerful data engine, charting, and execution capabilities with Cannon’s front-end customization and support. Cannon Trading Company, Inc.+3Cannon Trading Company, Inc.+3Cannon Trading Company, Inc.+3 This platform ensures traders in s&p 500 futures trading get low-latency data, advanced charting, custom layouts, and smooth trade routing.
In addition to CannonX, they also support other industry platforms to ensure flexibility and failover options. Cannon Trading Company, Inc.+3Cannon Trading Company, Inc.+3Cannon Trading Company, Inc.+3 That aligns exactly with the broker trait of giving you platform choice, redundancy, and API-level access.
Cannon emphasizes that traders are never left hanging: “Real, licensed futures brokers are just a call away — a rarity in today’s automated world.” Cannon Trading Company, Inc.+1 Their promotional and testimonial narratives underscore that in moments of platform failure or high volatility, their brokers can take telephone orders, flatten positions, or intervene as needed. Cannon Trading Company, Inc.+3Cannon Trading Company, Inc.+3Cannon Trading Company, Inc.+3 That element—“one phone call in case of emergency”—is featured repeatedly by clients reviewing the firm on TrustPilot. Cannon Trading Company, Inc.+1
Risk management, alerts, analytics, and client support
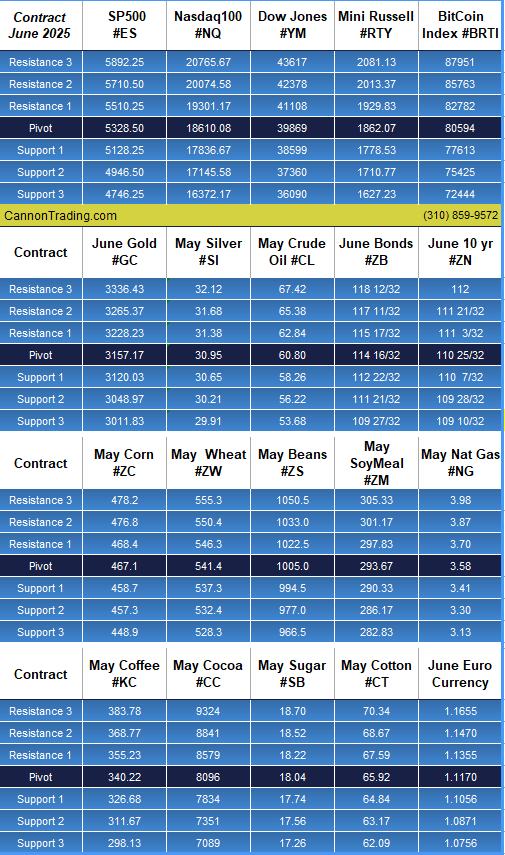
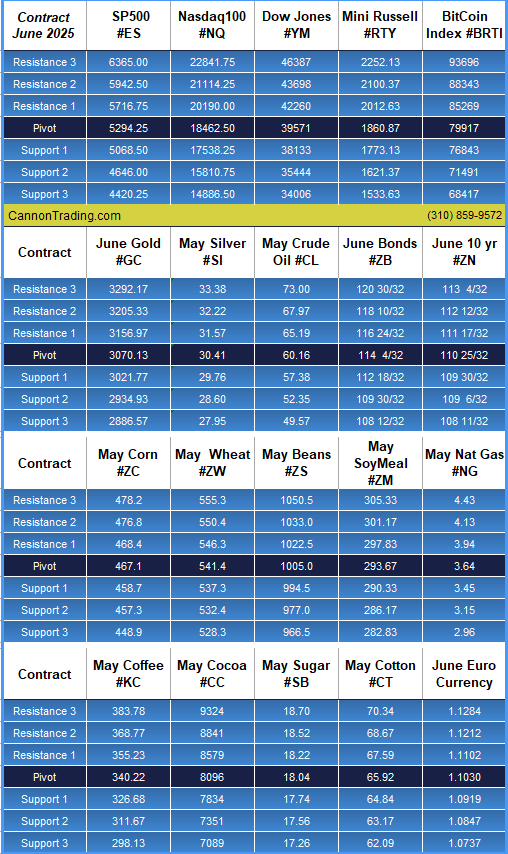
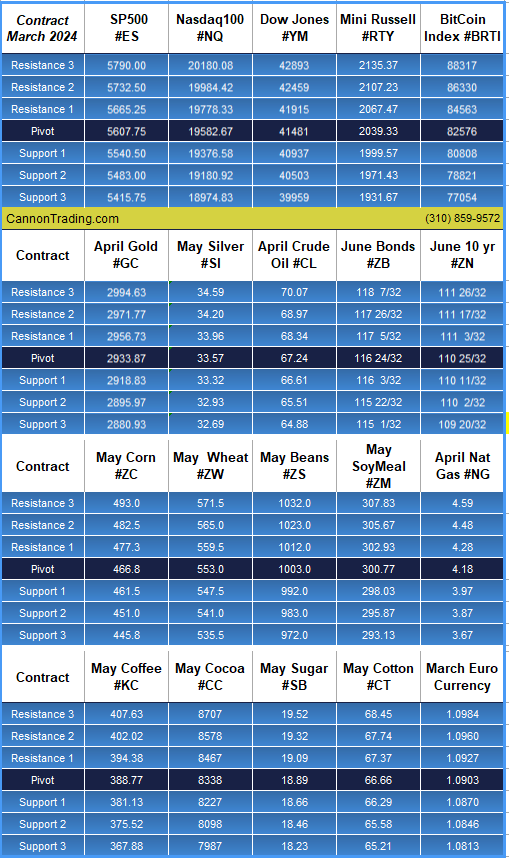
Cannon offers real-time support, educational materials, market commentary, and analytics tailored to S&P 500 futures, supporting both novice and advanced traders. Cannon Trading Company, Inc.+3Cannon Trading Company, Inc.+3Cannon Trading Company, Inc.+3 Their blog often contains articles on support/resistance levels, futures SP strategies, handling liquidity gaps, and technical indicators. Cannon Trading Company, Inc.+5Cannon Trading Company, Inc.+5Cannon Trading Company, Inc.+5 For example, they publish regular daily support & resistance levels for S&P 500 Index futures. Cannon Trading Company, Inc. They have also posted deep-dive articles like “Futures on S&P 500: Your 8 Important Need-to-Knows” to demystify challenges in futures S&P trading. Cannon Trading Company, Inc.
Client-centric service and personalization
Cannon markets itself as a broker that treats clients not as numbers, but as partners. Cannon Trading Company, Inc.+3Cannon Trading Company, Inc.+3Cannon Trading Company, Inc.+3 Their TrustPilot reviews often praise the prompt, personal responses, dedicated broker assignments, and hands-on help in platform setup or strategy implementation. Cannon Trading Company, Inc.+1 That level of client-centric service helps ease the steep learning curve of trading SP 500 futures.
Transparency of costs and commission
Cannon is clear about commissions, margin rules, exchange fees, and platform fees. Cannon Trading Company, Inc.+2Cannon Trading Company, Inc.+2 Transparent cost structures are vital for futures traders who often run high turnover in futures SP or SP 500 futures trading strategies.
For More on S&P 500 Futures Trading with Cannon
Cannon’s own blog domain carries domain authority and hosts multiple well-ranked articles focusing precisely on S&P 500 futures, futures SP, and SP 500 futures trading. For instance:
FAQ
Q1: Why not just trade S&P 500 ETFs instead of futures SP?
A1: ETFs require full capital for exposure, have slower execution, and can’t provide the same leverage, intraday hedging, or roll flexibility. Futures SP offers more efficiency, tighter spreads, and robust hedging capacity.
Q2: How risky is using leverage in SP 500 futures?
A2: High leverage amplifies both gains and losses. If the market moves sharply against your position, you may face margin calls or forced liquidation. A good futures broker helps you calibrate risk, alerts you early, and assists you in adverse conditions.
Q3: What if my broker doesn’t support platform redundancy or voice support?
A3: You may be stranded during technical failures or crises. That’s why selecting a broker like Cannon (with multi-platform support and phone backup) is essential for serious s&p 500 futures traders.
Q4: Can I hedge only part of my equity portfolio with S&P futures?
A4: Yes. Many traders run partial hedge overlays to limit downside, maintain upside participation, or dynamically adjust hedge ratios as markets shift.
Q5: Is CannonX powered by CQG available to all clients?
A5: Yes — brokers like Cannon offer access to CannonX (with the underlying CQG engine) alongside other platforms, giving traders flexibility in choosing the interface and tools they prefer.
Ready to start trading futures? Call us at 1(800)454-9572 (US) or (310)859-9572 (International), or email info@cannontrading.com to speak with one of our experienced, Series-3 licensed futures brokers and begin your futures trading journey with Cannon Trading Company today.
Disclaimer: Trading Futures, Options on Futures, and retail off-exchange foreign currency transactions involve substantial risk of loss and are not suitable for all investors. Past performance is not indicative of future results. Carefully consider if trading is suitable for you in light of your circumstances, knowledge, and financial resources. You may lose all or more of your initial investment. Opinions, market data, and recommendations are subject to change at any time.
Important: Trading commodity futures and options involves a substantial risk of loss. The recommendations contained in this article are opinions only and do not guarantee any profits. This article is for educational purposes. Past performances are not necessarily indicative of future results.
This article has been generated with the help of AI Technology and modified for accuracy and compliance.
Follow us on all socials: @cannontrading
|
|
|
||||||||||||||||||||||||||||||||||||||||||||||||||||||||||
|
||||||||||||||||||||||||||||||||||||||||||||||||||||||||||
|

|
||||||||||||||||||||||||||||||||||||||||||||||||||||||||||||||
|
||||||||||||||||||||||||||||||||||||||||||||||||||||||||||||||
|

|
||||||||||||||||||||||||||||||||||||||||||||||||||||||||||||||
|
||||||||||||||||||||||||||||||||||||||||||||||||||||||||||||||
|

|
|
|
|||||||||||||||||||||||||||||||||||||||||||||||||||||||||||||||||
|
|||||||||||||||||||||||||||||||||||||||||||||||||||||||||||||||||
|

|
|||||||||||||||||||||||||||||||||||||||||||||||||||||||||||
|
|||||||||||||||||||||||||||||||||||||||||||||||||||||||||||
|
By Mark O’Brien, Senior Broker
Zero-day options are normal options — puts and calls — that expire in less than one day, hence the “0DTE” nickname (short for “zero days to expiration”).
In the current high-volatility environment we’re experiencing – one very likely to last awhile – one of the better alternatives to day trading, particularly in stock index futures like the E-mini S&P 500, E-mini Nasdaq, etc., is buying short-term call and put options.
With expirations every day of the week, stock index futures options can be purchased with minimal overall time value and give you a maximum risk coupled with a limitless upside potential.
Especially with markets seemingly hair-triggered to make large daily moves, but with erratic action intraday, the purchase of a limited-risk option provides staying power that no amount of rapid in-and-out trading trying to catch a large move can outperform.

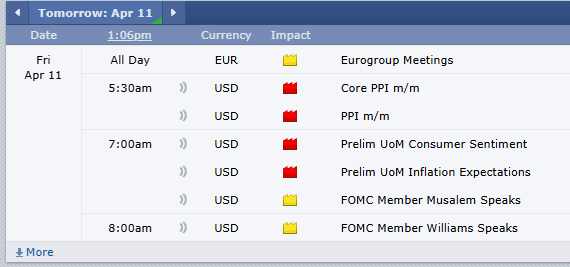
provided by: ForexFactory.com
All times are Eastern Time (New York)
|
||||||||||||||||||||||||||||
|
||||||||||||||||||||||||||||
|


As of this typing stock index futures and other futures contracts have experienced single-day range moves not seen in years and after being down, finished up:
→ E-mini Dow Jones: UP +3044 points / 8.4%
→ E-mini S&P 500: UP +480 points / 9.5%
→ E-mini Nasdaq: UP +2038 points / 11.71%
→ Crude Oil: UP +320 points / 5.2%
This is a completely different environment of extreme trading volatility than what we were trading in 3-4 weeks ago. Markets are evolving and you must adapt your trading to changing market conditions.
This is where you find out what kind of risk taker you are; brash, overbold, unheeding, or prudent, attentive, discriminating. Everyone possesses these traits – and they influence our decision-making differently in different situations.
In trading, if the historical price moves you’re seeing bring out the daredevil in you, plan to watch your trade results all over the place: up and down more than your everyday swings with the odds increasing your account will hit a wall.
Instead, incorporate patience and prudence. Start your trading by setting daily profit targets and daily loss limits and stick to them. Do that for each trade. These days, be aware of LIMIT moves and understand what happens when the market halts at limit levels.
Find daily price limits for CME Group Agricultural, Cryptocurrency, Energy, Equity Index, Interest Rates, and Metals products: click here.
|

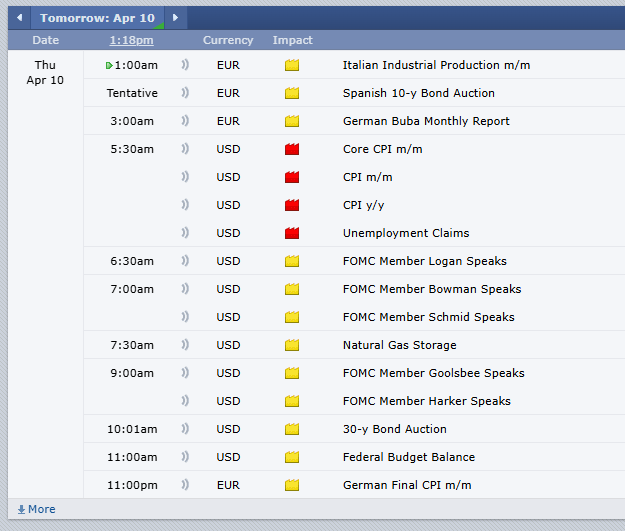
provided by: ForexFactory.com
All times are Eastern Time (New York)
|
||||||||||||||||||||||||||||
|
||||||||||||||||||||||||||||
|


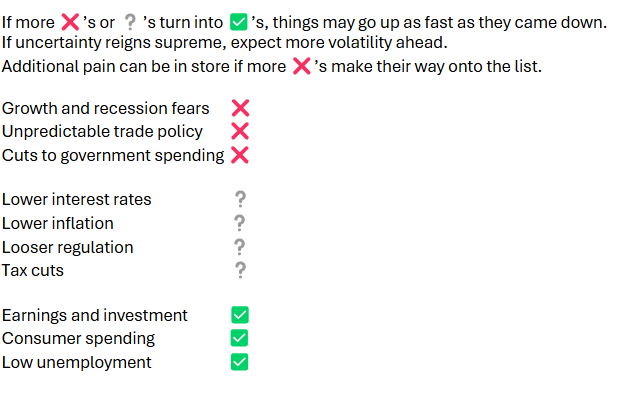
It was only three weeks ago that the March E-mini Standard and Poor 500 futures contract hit an all-time high. Markets have been dealt a blow by growth and recession fears, the unpredictability of trade policy, and risks to sector-wide investment and spending.
Whether it’s a good buying opportunity or another growl towards a bear market is still up for debate, the Standard and Poor 500 index futures contract fell into correction territory yesterday, registering a decline of 10% in the span of less than a month. While the Standard and Poor 500 futures contract trimmed some of the losses, big questions are still swirling over what lies ahead. The Trump administration is attempting to engineer a long-term structural change to the U.S. economy. The reality of that goal is hotly debated, but it is no doubt taking a toll on the short-term animal spirits that enveloped the market since November.
Here’s a 10-point checklist that will determine the market’s future trajectory:

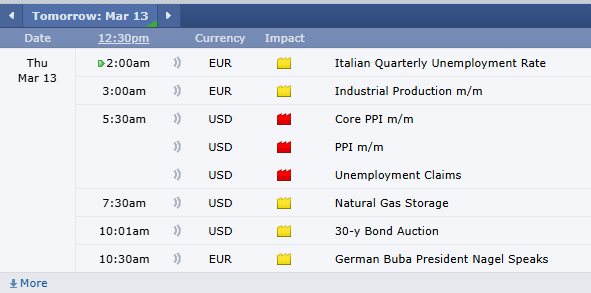
provided by: ForexFactory.com
All times are Eastern Time (New York)
|
||||||||||||||||||||||||||||
|
||||||||||||||||||||||||||||
|