Overnight Edge, December Mini Dow, Levels, Reports; Your 4 Important Need-To-Knows for Trading Futures on October 21st, 2025

9dc1e02e d5f7 4ff4 abf7 1df60775f196

Where is the Edge?

edge

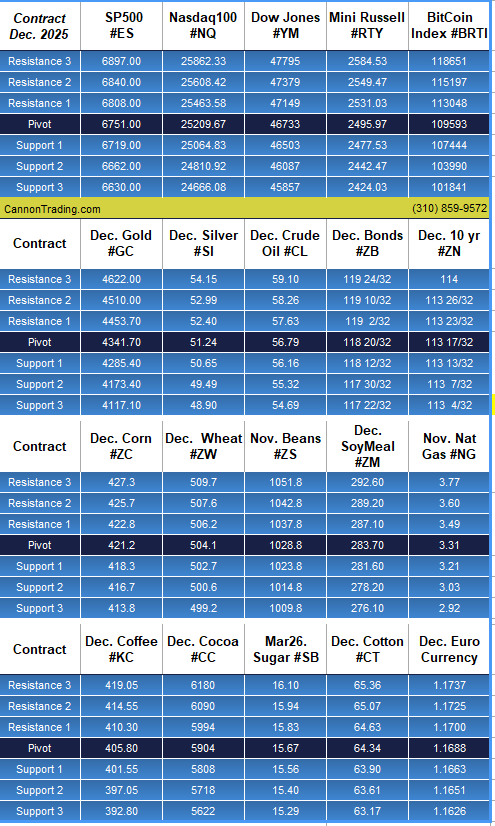
At-a-Glance Levels

Instrument S2 S1 Pivot R1 R2
Gold (GC) — Dec (GCZ5) 4173.40 4285.40 4341.70 4453.70 4510.00
Silver (SI) — Dec (SIZ5) 49.49 50.65 51.24 52.40 52.99
Crude Oil (CL) — Nov (CLX5) 55.32 56.16 56.79 57.63 58.26
 Dow Jones (YM) — Dec 2025 46087 46503 46733 47149 47379

Over the past few months, and especially in recent weeks, we’ve seen unusually large overnight moves. Some moves appear random, others reverse quickly, and some are driven by headlines such as tariff news. These dynamics have increased gap risk, reduced overnight liquidity, and produced frequent open-time dislocations.

Common question

Where is the edge?

Short answer

  • Trade the first 30 minutes and focus on short-term gap-fill or rejection setups.
  • Use same-day options when you expect a large directional move to limit tail risk and avoid being stopped out only to see the market move in your favor.
  • Trade spreads when relative strength diverges across instruments (for example, gold vs silver or mini-Dow vs ES).

Extended answer

I want to focus on the practical elements of trading like pre-market context, move behavior, market news correlation, liquidity, options limits, and whether to use mean reversion or momentum. I’ll also want to highlight key parts like risk management, stop placement, and position sizing. Planning should be direct with a simple checklist and no more than six sections. I should also consider using a relevant citation about tariff-related movements, but just one, and make sure it’s only placed where necessary. No framing or extra explanations.

Futures day-trading edge

You find edge by matching a repeatable hypothesis to the current market regime, then executing it with strict risk and execution rules.

Regime diagnosis (what the market is doing now)

  • Volatility regime: large overnight gaps and erratic premarket prints mean the market is in a news-driven, headline-sensitive volatility regime.
  • Catalyst profile: moves are often tied to macro headlines and tariff noise; those headlines create directional gaps that either persist into the session or sharply reverse at the open.
  • Liquidity profile: overnight liquidity is thin and fragmented, increasing slippage and fake outs at the open.

Reliable, tradeable edges you can use

  • Pre-open directional bias with size filter. Trade opens when overnight gap exceeds a threshold (e.g., 0.5% or X ticks) and pre-market order flow confirms (sustained prints, not one-off sweep).
  • Use reduced size and wider stops for gaps caused by headline noise.
  • Fade headline gap into first 30 minutes when structure is weakIf gap lacks follow-through volume and price fails to make a clean microstructure breakout, favor mean reversion to the first-tail or VWAP.
  • Trend-follow breakouts in high conviction regimeWhen overnight move is accompanied by aligned macro flow (rates, FX, commodities) and volume ramps into the open, follow momentum with a continuation plan.
  • Volatility arbitrage playsUse options or calendar spreads where available to sell realized volatility after spikes and buy protection around known headline windows.
  • Session-timing edgeTrade smaller and tighter in the first 15–30 minutes after the open; increase size after the market establishes structure (first clean high/low and confirmation).
  • Microstructure edge: limit vs market tacticsUse passive limit entries near structural levels and aggressive exits into liquidity. Avoid market entries into thin pre-open auction prints.

Concrete execution rules (checklist)

  • Pre-market checklist: identify gap size, top 3 headlines, correlated markets (bonds, FX, oil), and pre-open volume trend.
  • Entry rules: require either structural confirmation (higher high / lower low) or a mean-reversion setup with defined edge-to-risk ratio ≥ 2:1.
  • Sizing: reduce notional by 25–50% on headline-driven nights; increase only after two clean consecutive edges are realized.
  • Stops and targets: place stop where edge invalidates (clearly definable price level); scale out at predefined targets; never trade without a stop.
  • Slippage buffer: add tick buffer to stops and profit targets during thin liquidity opens.

How to test and keep the edge

  • Backtest regime-specific rules: label historical sessions by overnight gap size and headline events, test mean-reversion vs momentum rules separately.
  • Forward-test with small capital: run a two-week rolling simulator and log slippage, win rate, and expectancy.
  • Adaptive rules: codify a volatility threshold that switches you between momentum and fade strategies automatically.

Brief trade plan template

  • Hypothesis: (e.g., “Overnight tariff headline caused a 0.7% gap that lacks confirmatory volume; first 20 minutes will mean-revert to VWAP.”)
  • Entry: limit at VWAP + X ticks or on 1-minute reversal candle.
  • Stop: invalidation beyond the overnight high/low + slippage buffer.
  • Target: partial at VWAP, final at first structure level.
  • Size: 50% normal when gap driver = headline; full size only when macro alignment confirmed.

Be systematic: diagnose regime, pick the strategy that historically wins in that regime, enforce execution and risk rules, and iterate from measured data.

Important: Trading commodity futures and options involves a substantial risk of loss.  

The recommendations contained in this blog are of opinion only and do not guarantee any profits.  

Past performances are not necessarily indicative of future results.

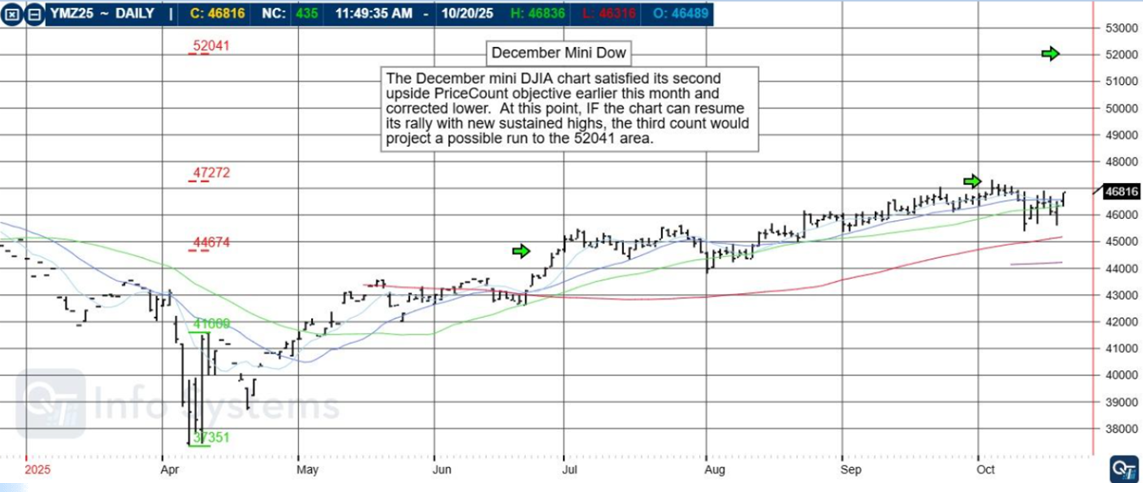
December Mini DOW

The December mini DJIA chart satisfied its second upside PriceCount objective earlier this month and corrected lower. At this point, IF the chart can resume its rally with new sustained highs, the third count would project a possible run to the 52041 area.

ae992987 2d47 4be3 a8d7 b9228ddcdb34

The PriceCount study is a tool that can help to project the distance of a move in price. The counts are not intended to be an ‘exact’ science but rather offer a target area for the four objectives which are based off the first leg of a move with each subsequent count having a smaller percentage of being achieved.

It is normal for the chart to react by correcting or consolidating at an objective and then either resuming its move or reversing trend. Best utilized in conjunction with other technical tools, PriceCounts offer one more way to analyze charts and help to manage your positions and risk. Learn more at www.qtchartoftheday.com

Trading in futures, options, securities, derivatives or OTC products entails significant risks which must be understood prior to trading and may not be appropriate for all investors. Past performance of actual trades or strategies is not necessarily indicative of future results.

Daily Levels for Oct. 21st, 2025

29a2db9b 5496 4c1a 90af 7b5a30e75999

Want to feature our updated trading levels on your website? Simply paste a small code, and they’ll update automatically every day! 

Click here for quick and easy instructions.

Economic Reports

 U.S. government data may be impacted by the shutdown. ‘Tentative’ events are subject to delay, revision, or cancellation

provided by: ForexFactory.com

All times are Central Time ( Chicago)

584def4f 193c 48ef 8762 24bbb1449316

Find us on Trustpilot

stars

Trading Futures, Options on Futures, and retail off-exchange foreign currency transactions involves substantial risk of loss and is not suitable for all investors. You should carefully consider whether trading is suitable for you in light of your circumstances, knowledge, and financial resources. You may lose all or more of your initial investment. Opinions, market data, and recommendations are subject to change at any time.

Join our Private Facebook group

Subscribe to our YouTube Channel

Listen to our podcast: Subscribe on AppleSpotify, Amazon

or wherever you listen to podcasts!

S
Facebook  Instagram  LinkedIn
S
ef3ab1c9 8d6d 4e60 a3f1 af5d9d4ecbb3
Services
Software
Tools
Community
Contact

Trading Alerts – Free Trial! Plus Levels, Reports; Your 3 Crucial, Important Need-To-Knows for Trading Futures on August 22nd, 2025

9dc1e02e d5f7 4ff4 abf7 1df60775f196

Trading Alerts Free Trial

By Ilan Levy-Mayer, VP

trading

Trading Alerts!

Real Time Email and/or Text Alerts

Directly to your Phone!

·    You will receive an email each time there is an entry or exit in a simple language along with the current price for that specific market.

·    Example from Tuesday Aug. 19th 2025:

Buy Nov. Beans at 1039’0 limit.

If filled Stop at 1026’0

Target at 1058’0

·    A licensed series 3 broker at your fingertips

·    Email alerts available to US and Canada and Int’l clients

·    Alerts available for: Stock Indices, Grains, Metals, Rates, Currencies, Meats & Softs

·    Alerts are SWING Trades

Start Now, Free Trial, No Obligation or credit Card Needed!

Questions? We are happy to help!

S

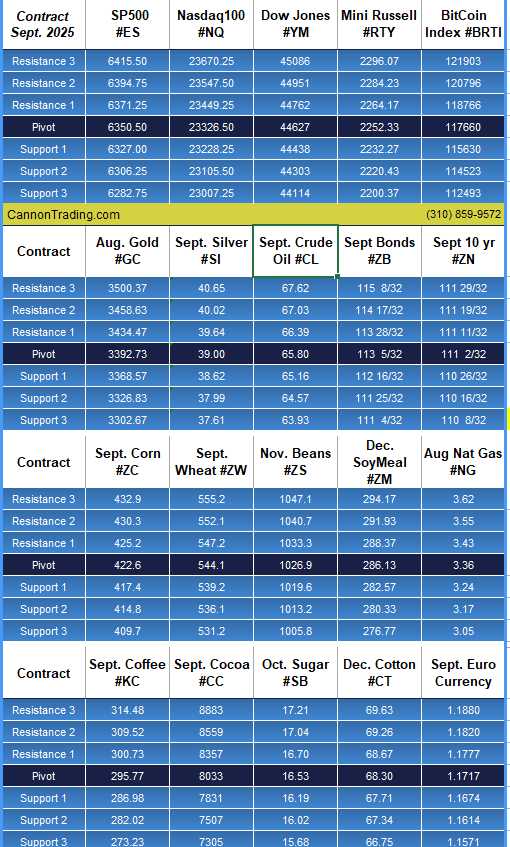
Daily Levels for Aug 22nd, 2025

82fd9f50 6e0d 40bc a802 623ccaaceafb

Want to feature our updated trading levels on your website? Simply paste a small code, and they’ll update automatically every day! 

Click here for quick and easy instructions.

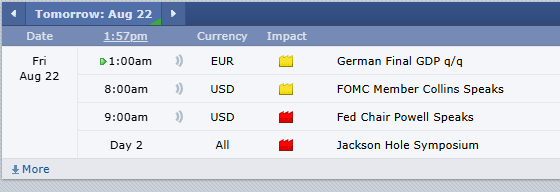
Economic Reports

provided by: ForexFactory.com

All times are Eastern Time ( New York)

327d007e 9261 49d1 ae77 f4567f297b69

Find us on Trustpilot

stars

Trading Futures, Options on Futures, and retail off-exchange foreign currency transactions involves substantial risk of loss and is not suitable for all investors. You should carefully consider whether trading is suitable for you in light of your circumstances, knowledge, and financial resources. You may lose all or more of your initial investment. Opinions, market data, and recommendations are subject to change at any time.

Join our Private Facebook group

Subscribe to our YouTube Channel

Listen to our podcast: Subscribe on AppleSpotify, Amazon

or wherever you listen to podcasts!

S
Facebook  Instagram  LinkedIn
S
ef3ab1c9 8d6d 4e60 a3f1 af5d9d4ecbb3
Services
Software
Tools
Community
Contact

Summer Trading, E-Mini S&P 500, December Meal V. Corn Spread, Levels, Reports; Your 5 Important Need-To-Knows for Trading Futures on July 22nd, 2025

9dc1e02e d5f7 4ff4 abf7 1df60775f196

Summer Trading

By Ilan Levy-Mayer, VP

summer

Summer Trading at the Halfway Point

Today’s E-mini S&P 500 (ES) futures volume clocked in at just 874,000 contracts—a level we haven’t seen in months. Summer trading often brings thinner liquidity and choppier price action, so adapting your strategy is key.

To capture steadier intraday moves, diversify into other high-liquidity markets like gold futures, crude oil, and 30-year Treasury bond futures, where volume and volatility tend to hold up better in the off-season.

Also, swapping out time-based bars for range bars or volume bars will filter out noise and highlight true buying and selling pressure, giving you cleaner signals for entries, stops, and exits.

S
eb23d89b a6ee 494c a74a 38b5f4e886e7

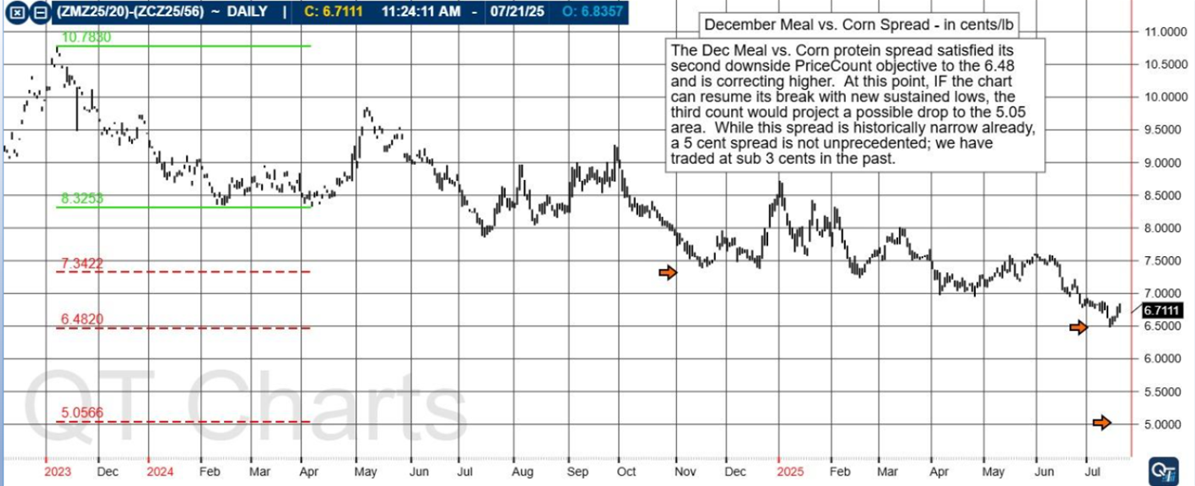
December Meal vs. Corn Spread – in cents/lb

The Dec Meal vs. Corn protein spread satisfied its second downside PriceCount objective to the 6.48 and is correcting higher. At this point, IF the chart can resume its break with new sustained lows, the third count would project a possible drop to the 5.05 area. While this spread is historically narrow already, a 5 cent spread is not unprecedented; we have traded at sub 3 cents in the past.

8f18ded9 2a02 4da4 bf72 1dcfce7b821e

Daily Levels for July 22nd, 2025

d1454376 df33 4af7 b206 d9060d21a449

The PriceCount study is a tool that can help to project the distance of a move in price. The counts are not intended to be an ‘exact’ science but rather offer a target area for the four objectives which are based off the first leg of a move with each subsequent count having a smaller percentage of being achieved.

It is normal for the chart to react by correcting or consolidating at an objective and then either resuming its move or reversing trend. Best utilized in conjunction with other technical tools, PriceCounts offer one more way to analyze charts and help to manage your positions and risk. Learn more at www.qtchartoftheday.com

Trading in futures, options, securities, derivatives or OTC products entails significant risks which must be understood prior to trading and may not be appropriate for all investors.

Past performance of actual trades or strategies is not necessarily indicative of future results.

Want to feature our updated trading levels on your website? Simply paste a small code, and they’ll update automatically every day! 

Click here for quick and easy instructions.

Economic Reports

provided by: ForexFactory.com

All times are Eastern Time ( New York)

9ff70e9c f878 4d57 9ffb 456adf235230

Find us on Trustpilot

stars
Trading Futures, Options on Futures, and retail off-exchange foreign currency transactions involves substantial risk of loss and is not suitable for all investors. You should carefully consider whether trading is suitable for you in light of your circumstances, knowledge, and financial resources. You may lose all or more of your initial investment. Opinions, market data, and recommendations are subject to change at any time.

Join our Private Facebook group

Subscribe to our YouTube Channel

Listen to our podcast: Subscribe on AppleSpotify, Amazon

or wherever you listen to podcasts!

S
Facebook  Instagram  LinkedIn
S
ef3ab1c9 8d6d 4e60 a3f1 af5d9d4ecbb3
Services
Software
Tools
Community
Contact

June Emini S&P, CannonX Custom Time on the Chart, Levels; 3 Important Need-To-Knows for Trading Futures on May 20th, 2025

9dc1e02e d5f7 4ff4 abf7 1df60775f196

What to Know Before Trading Futures on May 20th, 2025

June Emini S&P

emini

Emini S&P

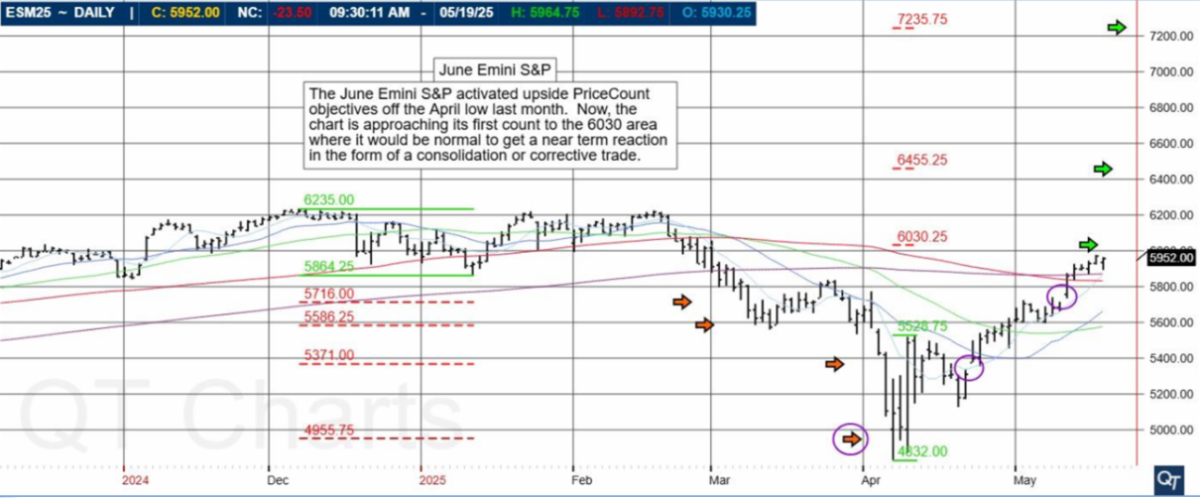
The June Emini S&P activated upside PriceCount objectives off the April low last month. Now, the chart is approaching its first count to the 6030 area where it would be normal to get a near term reaction in the form of a consolidation or corrective trade.

29d6df69 8503 4871 bee1 a285e9f170ec

The PriceCount study is a tool that can help to project the distance of a move in price. The counts are not intended to be an ‘exact’ science but rather offer a target area for the four objectives which are based off the first leg of a move with each subsequent count having a smaller percentage of being achieved.

It is normal for the chart to react by correcting or consolidating at an objective and then either resuming its move or reversing trend. Best utilized in conjunction with other technical tools, PriceCounts offer one more way to analyze charts and help to manage your positions and risk. Learn more at www.qtchartoftheday.com

Trading in futures, options, securities, derivatives or OTC products entails significant risks which must be understood prior to trading and may not be appropriate for all investors. Past performance of actual trades or strategies is not necessarily indicative of future results.

S
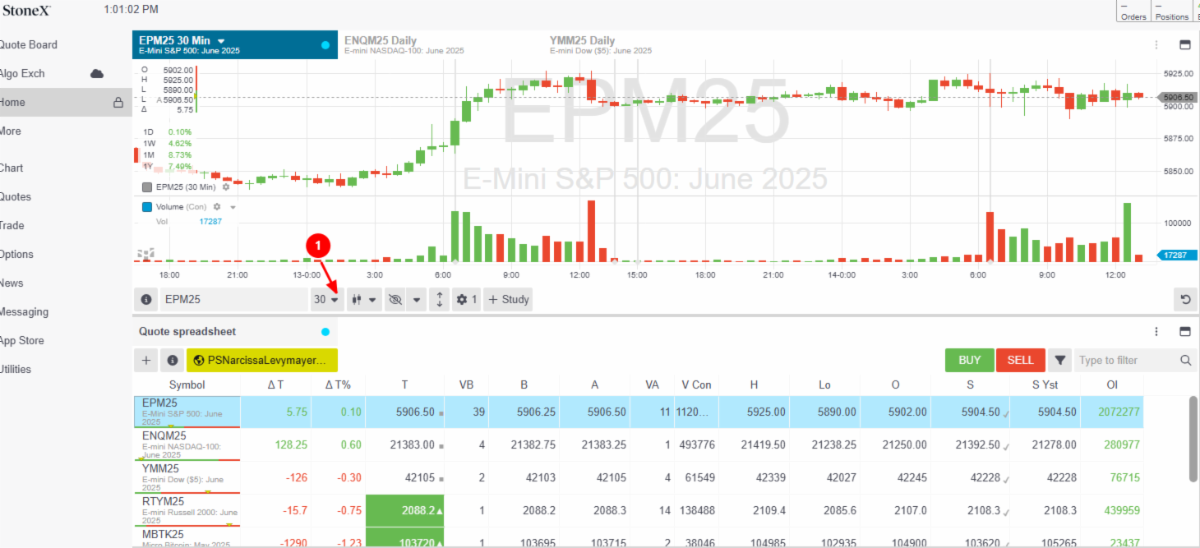
On a different note, here are some tips on creating a custom time chart interface using our FREE CannonX platform! (free demo)

How to create a custom Time on the charts?

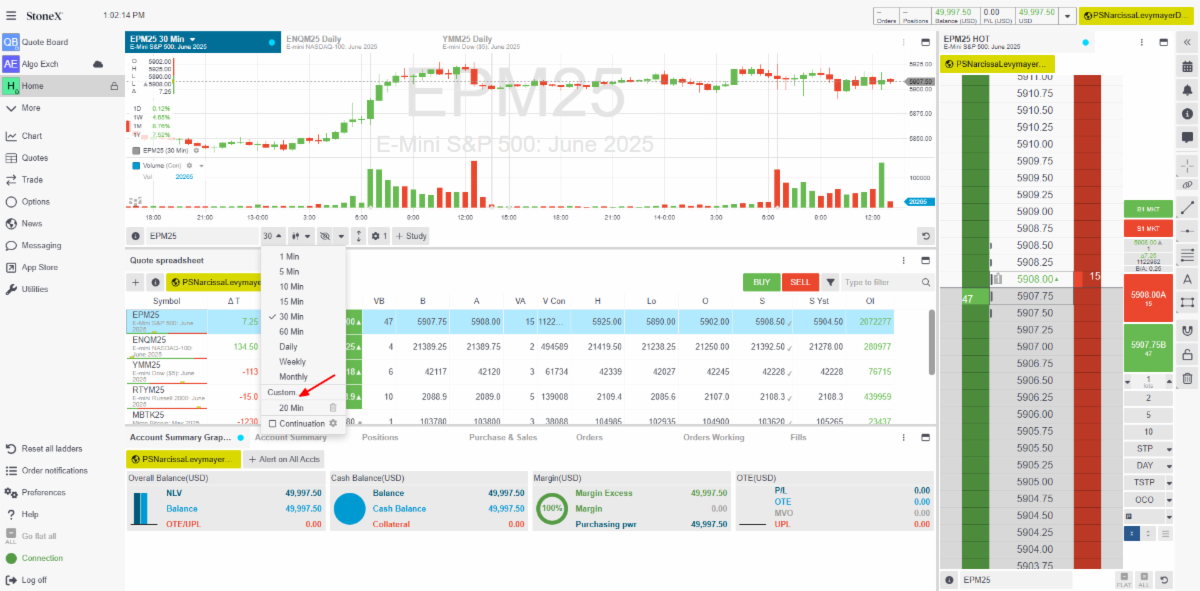
Click on the arrow next to the current time interval

7862db77 9b30 4aca 8904 fbc25f21ca1e
Click on the custom option and type in the number of minutes or days you would like to see.
cba6258e 1077 416f 82aa 776d3f2d0a5b
Click ok and your new chart with custom time is available! In this example i selected 13 minutes.
8bfee785 e13b 4837 bd51 e65da93adb30

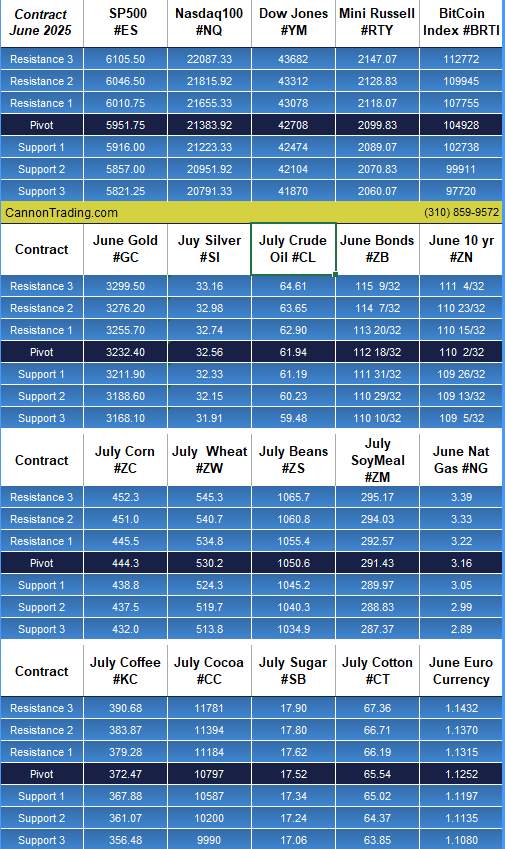
Daily Levels for May 20th, 2025

fbb3748e fceb 4c40 9b32 0c535da599f0

Want to feature our updated trading levels on your website? Simply paste a small code, and they’ll update automatically every day! 

Click here for quick and easy instructions.

822b33c5 2339 45ed bc84 e9c8f8c7358e

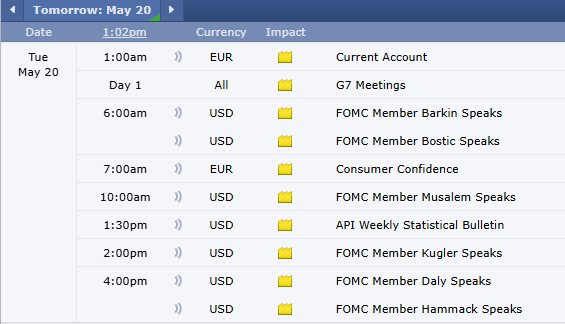
Economic Reports

provided by: ForexFactory.com

All times are Eastern Time (New York)

67ceaf55 65a4 4a59 927f 3b7ab33c0794

Find us on Trustpilot

stars

Trading Futures, Options on Futures, and retail off-exchange foreign currency transactions involves substantial risk of loss and is not suitable for all investors. 

You should carefully consider whether trading is suitable for you in light of your circumstances, knowledge, and financial resources. You may lose all or more of your initial investment.

Opinions, market data, and recommendations are subject to change at any time.

Join our Private Facebook group

Subscribe to our YouTube Channel

Listen to our podcast: Subscribe on AppleSpotify, Amazon

or wherever you listen to podcasts!

S
Facebook  Instagram  LinkedIn
S
ef3ab1c9 8d6d 4e60 a3f1 af5d9d4ecbb3
Services
Software
Tools
Community
Contact

Voice of The Tomb: Seasonals, Corn, Wheat, & More Crucial, Important Need-To-Knows for Trading Futures on May 14th, 2025

9dc1e02e d5f7 4ff4 abf7 1df60775f196

Voice from the Tomb

Voice from The Tomb, Seasonals & more

by John Thorpe, Senior Broker

Day trade margins are back to normal valuations.

A quiet data day tomorrow.

    Market volatility is here to stay for the foreseeable future

Choose your opportunities wisely. Today’s market swings were largely back to normal (pre tariff talk normal)

I thought the timing would be correct to revisit this sage wisdom from the not-so-distant past since April WASDE was released yesterday.

This 8 ½ x 11, well worn, sheet of paper version has been pinned to the corkboard in my office for decades and is worth a share. Called “Voice from the Tomb”, I have noticed a web page dedicated solely to this Myth or Non-Fiction? Lore or Fact? and his experiences following the execution dates.

It’s interesting to contemplate the prospective impact of following the note left to family members, in light of some of the upcoming dates provided. What follows is simply a brief of the contents, feel free to google search the topic to follow the trader’s experiences, you too may end up saving the primary authors advice.

Voice From the Tomb

This is the legend of a wise grain trader that made a fortune trading “seasonals” in the pits of the Chicago Board of Trade.

“After his wife died, a millionaire grain trader dedicated his life to raising their children. The children were lazy and thought they’d inherit all of their father’s money. He felt that his children were wasteful and believed they took him for granted. When he died, all the money went to charity. All he left them in his will were the following dates of when to buy and sell. The will said that if they strictly followed his advice, they’d have the fortunes they always thought were going to drop in their laps.”

Seasonals, Corn, Wheat

seasonals corn wheat

So what is a “seasonal”? “Seasonality often plays a part in determining prices for commodities in regular cycles throughout the year. Normal increases and decreases in supply and demand for particular commodities seem to occur every year in fairly consistent patterns. Commodity seasonal patterns might appear to be an easy trading strategy for commodities, but seasonal tendencies are just that – tendencies.” Chuck Kowalski

Wheat

  • Sell March Wheat on January 10
  • Buy May and/or July Wheat on February 22
  • Sell July Wheat on May 10
  • Buy December Wheat on July 1
  • Sell December Wheat on September 10
  • Buy March Wheat on November 28

Corn

  • Buy July Corn on March 1
  • Sell July Corn on May 20
  • Buy December Corn on June 25
  • Sell December and March Corn on August 10

Disclaimers:

* Past results are not necessarily indicative of future results. The risk of loss in the futures trading market can be substantial, carefully consider the inherent risks of such an investment in light of your financial condition.

** SEASONAL TENDENCIES ARE A COMPOSITE OF SOME OF THE MORE CONSISTENT COMMODITY FUTURES SEASONAL THAT HAVE OCCURRED OVER THE PAST 15 YEARS. THERE ARE USUALLY UNDERLYING FUNDAMENTAL CIRCUMSTANCES THAT OCCUR ANNUALLY THAT TEND TO CAUSE THE FUTURES TRADING MARKETS TO REACT IN A SIMILAR DIRECTIONAL MANNER DURING A CERTAIN CALENDAR PERIOD OF THE YEAR.

EVEN IF A SEASONAL TENDENCY OCCURS IN THE FUTURE, IT MAY NOT RESULT IN A PROFITABLE TRANSACTION AS FEES, AND THE TIMING OF THE ENTRY AND LIQUIDATION MAY IMPACT ON THE RESULTS. NO REPRESENTATION IS BEING MADE THAT ANY ACCOUNT HAS IN THE PAST OR WILL IN THE FUTURE ACHIEVE PROFITS UTILIZING THESE STRATEGIES. NO REPRESENTATION IS BEING MADE THAT PRICE PATTERNS WILL RECUR IN THE FUTURE.

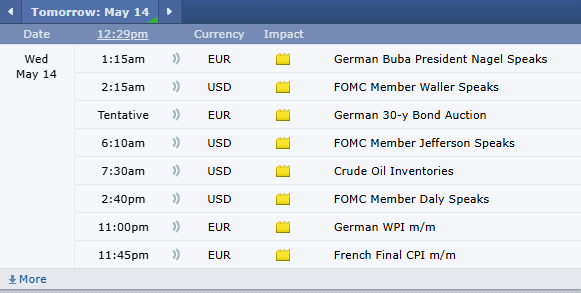
Tomorrow:

Econ Data:  EIA Energy stocks.

FED Speak: Three speakers

Earnings: TenCent, Siemens, Cisco systems, Sony

Tariff news: Anything goes!

S

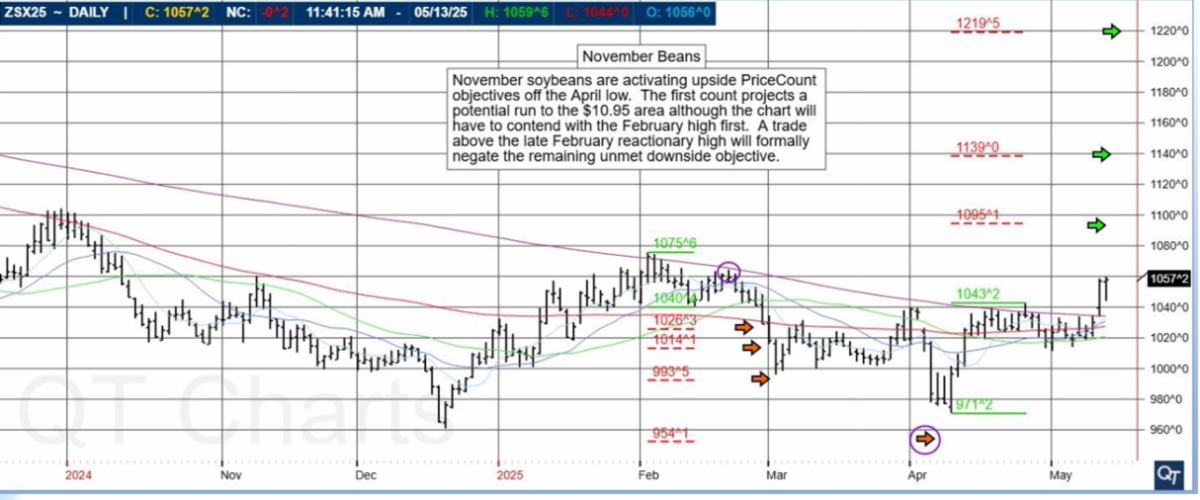
November Beans

November soybeans are activating upside PriceCount objectives off the April low. The first count projects a potential run to the $10.95 area although the chart will have to contend with the February high first. A trade above the late February reactionary high will formally negate the remaining unmet downside objective.

ebf4a4c6 f339 4bf2 901d 713af0464d2c

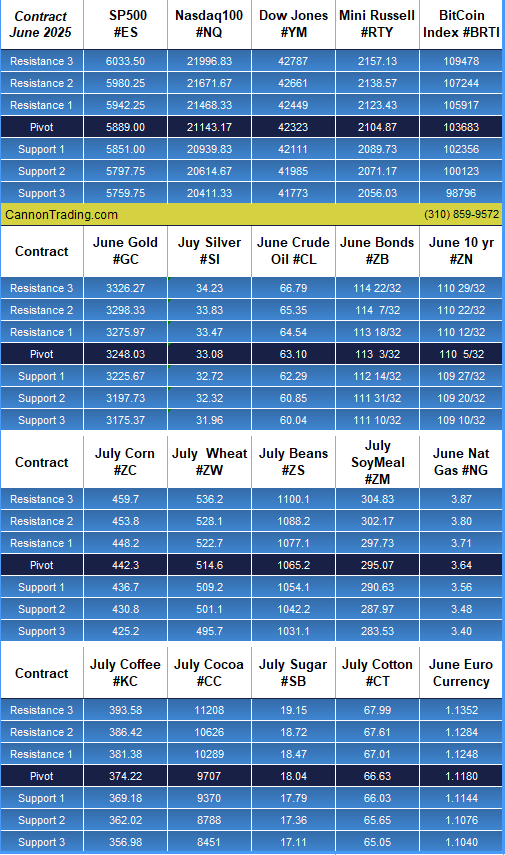
Daily Levels for May 14th, 2025

81f4f47c 4e84 47db 94a6 ef1426b23a7f

Want to feature our updated trading levels on your website? Simply paste a small code, and they’ll update automatically every day! 

Click here for quick and easy instructions.

28ae1ddf f400 4901 82b9 03a497f63f26

Economic Reports

provided by: ForexFactory.com

All times are Eastern Time ( New York)

fcb094a8 dfd3 490d aa87 6b054e8f18b1

Find us on Trustpilot

stars

Trading Futures, Options on Futures, and retail off-exchange foreign currency transactions involves substantial risk of loss and is not suitable for all investors. 

You should carefully consider whether trading is suitable for you in light of your circumstances, knowledge, and financial resources.

You may lose all or more of your initial investment. Opinions, market data, and recommendations are subject to change at any time.

Join our Private Facebook group

Subscribe to our YouTube Channel

Listen to our podcast: Subscribe on AppleSpotify, Amazon

or wherever you listen to podcasts!

S
Facebook  Instagram  LinkedIn
S
ef3ab1c9 8d6d 4e60 a3f1 af5d9d4ecbb3
Services
Software
Tools
Community
Contact

FOMC Key Takeaways from CME, Dollar Index; 4 Important Need-To-Knows When Trading Futures Tomorrow

9dc1e02e d5f7 4ff4 abf7 1df60775f196

FOMC Takeaways

FOMC Key Takeaways with Craig of CME Group

The awaited Fed Interest Rate decision was released yesterday, and as expected, the Fed kept the interest rates unchanged while signaling that rate cuts could be on the horizon for the remainder of the year.

With this announcement, the equity indices initially broke to the downside and then were able to recover at the end of the session. Gold, Silver, and Crude Oil all traded lower today after seeing strong gains to start the week.

FOMC

The CME Fed Watch Tool has been moving today with the interest rate decision along with the volatility in different markets, and seeing the changes over time can be beneficial.

This morning at 9:00 A.M. Central Time, the tool was pricing in a pause for the June meeting with a 69% probability, and that figure went up to 76% as of 3:00 Central Time after hearing remarks from Powell.

In a similar way, the probability for a rate cut at the July meeting remained the same near 56%. What this tells traders is that the market is pricing in a higher chance of the first interest rate cut coming at the July meeting instead of the previous expectation of the June meeting.

Would you like to view daily updates/takeaways and general research?

Visit our RESEARCH section which updates throughout the day!

Craig Bewick has spent 25 years in futures and options markets, starting at CBOT and CME working in risk management, regulatory, technology, product management and client development.

S

June Dollar Index

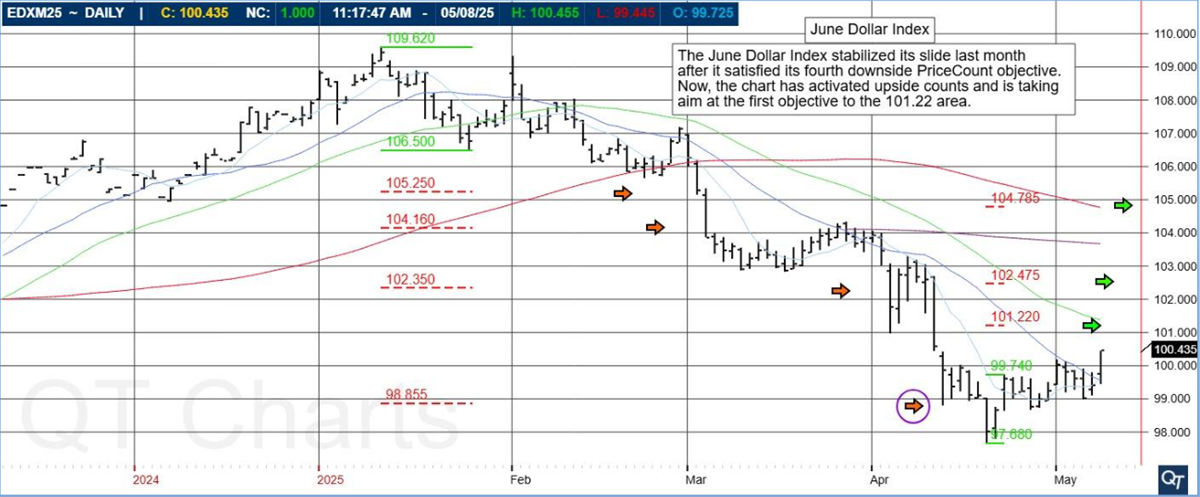
The June Dollar Index stabilized its inside last month after it satisfied its fourth downside PriceCount objective. Now, the chart has activated upside counts and is taking aim at the first objective to the 101.22 area.

73ecc020 47a6 45ae 93fd 242aa08058fa

The PriceCount study is a tool that can help to project the distance of a move in price. The counts are not intended to be an ‘exact’ science but rather offer a target area for the four objectives which are based off the first leg of a move with each subsequent count having a smaller percentage of being achieved.

It is normal for the chart to react by correcting or consolidating at an objective and then either resuming its move or reversing trend. Best utilized in conjunction with other technical tools, PriceCounts offer one more way to analyze charts and help to manage your positions and risk.

Learn more at www.qtchartoftheday.com

Trading in futures, options, securities, derivatives or OTC products entails significant risks which must be understood prior to trading and may not be appropriate for all investors. Past performance of actual trades or strategies is not necessarily indicative of future results.

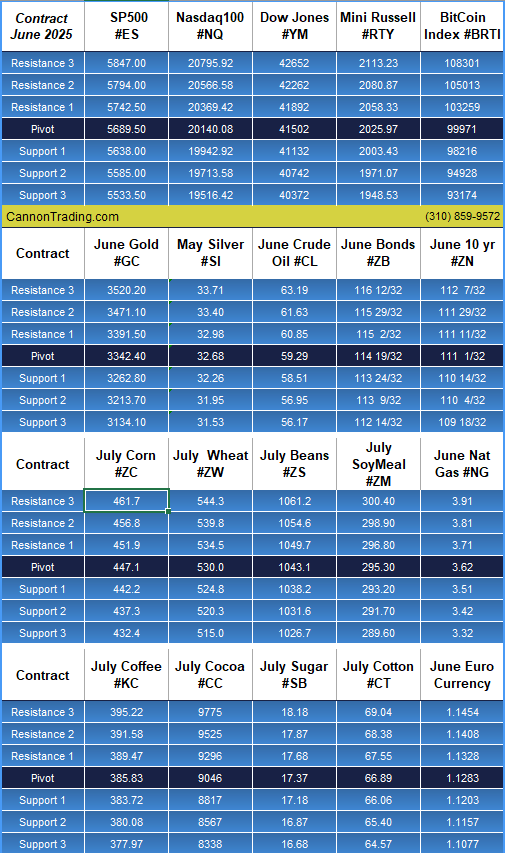
Daily Levels for May 9th 2025

332f851e 9380 4512 83f4 0ca9337e446e

Want to feature our updated trading levels on your website? Simply paste a small code, and they’ll update automatically every day! 

Click here for quick and easy instructions.

822b33c5 2339 45ed bc84 e9c8f8c7358e

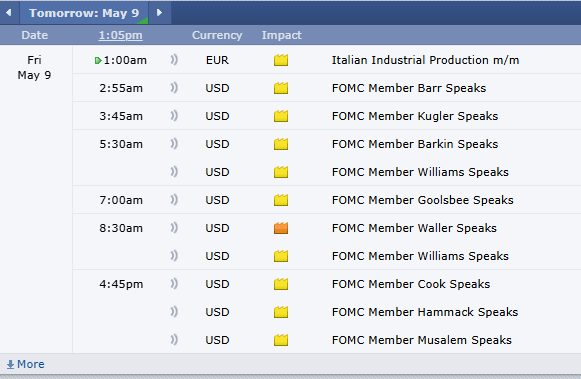
Economic Reports

provided by: ForexFactory.com

All times are Eastern Time (New York)

8ae5b15c 4faf 4b03 bc21 79185307a5fc

Find us on Trustpilot

stars

Trading Futures, Options on Futures, and retail off-exchange foreign currency transactions involves substantial risk of loss and is not suitable for all investors. You should carefully consider whether trading is suitable for you in light of your circumstances, knowledge, and financial resources. You may lose all or more of your initial investment. Opinions, market data, and recommendations are subject to change at any time.

Join our Private Facebook group

Subscribe to our YouTube Channel

Listen to our podcast: Subscribe on AppleSpotify, Amazon

or wherever you listen to podcasts!

S
Facebook  Instagram  LinkedIn
S
ef3ab1c9 8d6d 4e60 a3f1 af5d9d4ecbb3
Services
Software
Tools
Community
Contact

Trading the High Volatility Futures Markets

In this post:

1. Market Commentary
2. Support and Resistance Levels
3. December Mini S&P 500 Continuous Futures chart
4. Economic Reports
5. Highlighted Earnings Releases

divider black 190

1. Market Commentary

What platforms hold up during high volatility futures market trading sessions?

Over the last few weeks and particularly the last 4-5 trading sessions, we have witnessed unprecedented volatility, volume and market speed.

I want to share some of my experience as I have been trading with clients and definitely following the second-to-second moves. I have two very powerful machines along with multiple internet connections that are very fast. I must admit that during these times when the SP moved as much as 20 points in minutes and 10-12 points in seconds, two platforms stood out in keeping up with market data without any delays.

On my two machines I run CQG, eSignal, NINJA, PFG best, MFGlobal and couple more. All very solid, respectable trading and charting packages. However the two that ranked the highest in my opinion in regards to speed, no latency and reliability are TransactAT (TransactAT demo here), and E-Futures (E-Futures demo here). I welcome you to contact us for more information/ feedback and/ or to try a free demo if you not already using one of these two.

On a different note, below you will see a screen shot from today’s live trading signals webinar I hold DAILY. If you have not had the trial before, feel free to register and come visit the live charts and the set ups I share real time.

You can also sign up for my real time intraday charts service. Continue reading “Trading the High Volatility Futures Markets”