Futures Trading Levels and Economic Reports for July 30, 2013

Connect with Us! Use Our Futures Trading Levels and Economic Reports RSS Feed.

Like us on FacebookFollow us on TwitterView our profile on LinkedInFind us on Google+Cannon Trading Futures Trading Resistance & Support Levels and Economic ReportsFind us on Yelp

1. Market Commentary
2. Futures Support and Resistance Levels – S&P, Nasdaq, Dow Jones, Russell 2000, Dollar Index
3. Commodities Support and Resistance Levels – Gold, Euro, Crude Oil, T-Bonds
4. Commodities Support and Resistance Levels – Corn, Wheat, Beans, Silver
5. Futures Economic Reports for Tuesday July 30, 2013

Hello Traders,

For 2013 I would like to wish all of you discipline and patience in your trading! 

Earning season is in full speed and we are seeing a little bit more volatility in stock index futures but not much to be honest. In addition, this last few weeks mark some of the lowest volume I have personally seen in markets like the mini SP 500 futures.

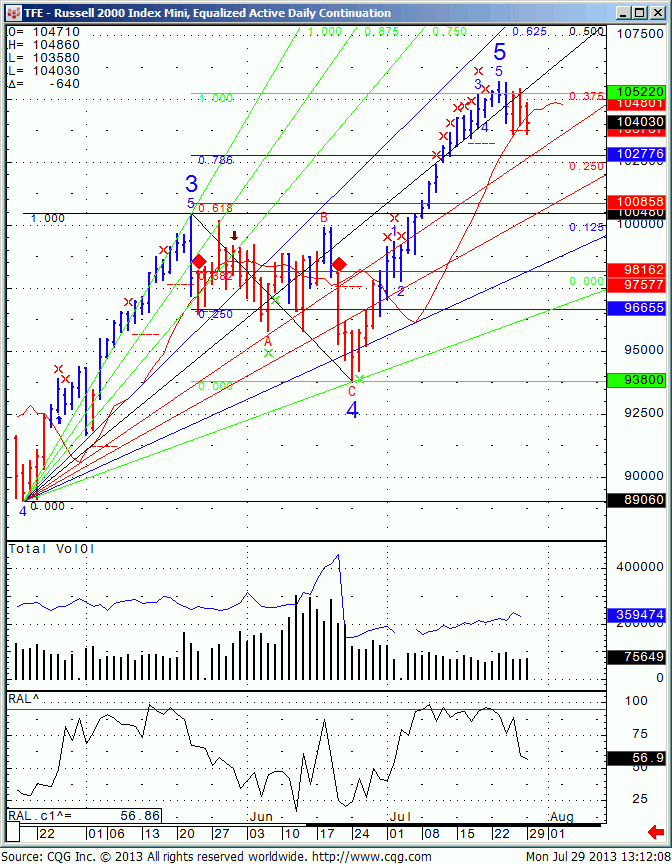
Below is a daily chart of the mini Russell 2000. Many lines, somehow of a confusing chart maybe but the bottom line is that 1027 area is the first support we need to see violated before the markets can make a more significant move lower.

TFE - Mini Russell 2000 Daily
TFE – Mini Russell 2000 Daily

Planning Ahead Trading Futures

The following was written by Kimberly Pabillon, a Commodity Broker with Cannon Trading since 2009

Trading futures requires research of particular markets (planning ahead and analyzing market behavior), a well thought out strategy when it comes to trading a particular futures market, and finding the right futures trading platform that allows you to execute your trading strategy. There is no Holy Grail or one right answer when it comes to trading futures.  Many new traders think that trading in and out of the market for a one or two tick profit target will make them a large sum of money. And that’s definitely not the case. Futures markets can hold some what unpredictable terms when trading.

Before new and old traders take the dive into futures trading, traders want to make sure that they have done their research about the particular futures markets they are looking to trade. Keeping a daily journal of market behavior of a particular futures market can be very helpful when coming up with a trading strategy. Analyzing how a particular market behaves when certain reports are released and taking note can help a trader see market reaction with particular reports and numbers. You may also see a future trader’s chart littered with many studies. This can be distracting to many traders. Find a few studies that work well with your strategy and stick with those instead of adding studies you hear about from educators or other traders alike. No trader needs the extra noise on their chart if it’s not applicable to their trading strategy.

Continue reading “Planning Ahead Trading Futures”

Which Futures Market is Right for You?

So you got a taste of the markets and trading and now you are getting more involved, excited and looking to progress. Many questions ahead for you as a trader and as time progresses you will evolve and find out if trading is suitable for you and if so what type of trading, what type of risk capital and other questions that will come up. Many of these will appear as you progress and your knowledge increase. Some of these questions need to be answered before you start trading.

  1. How much risk capital do I have?
  2. What markets do I want to trade?

The answer to question 1 will vary for each trader based on their financial situation but the bottom line is, make sure you trade with money you can afford to lose.

The answer to question 2 has a few levels: First is what asset class are you looking to trade? Stocks/equities? perhaps FOREX or maybe futures? Since my area of expertise is futures, commodities and future options I would like to expand on this asset class.

Trading futures offers many advantages as well as some drawbacks. For many traders who prefer to day trade ( you enter and exit the position during the same session and avoid holding positions from one day to another), trading futures is a great alternative to day trading stocks. In stocks you need to have minimum of $25,000 to day-trade. In futures you only need $2500. The build in leverage in the futures market, intensified by the even more so reduced day trading margins, creates a double edge sword: Small moves can translate into big wins in your pocket BUT small moves against you will also translate into big losses in your account….

Continue reading “Which Futures Market is Right for You?”

Futures Trading Levels and Economic Reports for July 25, 2013

Connect with Us! Use Our Futures Trading Levels and Economic Reports RSS Feed.

Like us on FacebookFollow us on TwitterView our profile on LinkedInFind us on Google+Cannon Trading Futures Trading Resistance & Support Levels and Economic ReportsFind us on Yelp

1. Market Commentary
2. Futures Support and Resistance Levels – S&P, Nasdaq, Dow Jones, Russell 2000, Dollar Index
3. Commodities Support and Resistance Levels – Gold, Euro, Crude Oil, T-Bonds
4. Commodities Support and Resistance Levels – Corn, Wheat, Beans, Silver
5. Futures Economic Reports for Thursday July 25, 2013

Hello Traders,

For 2013 I would like to wish all of you discipline and patience in your trading! 


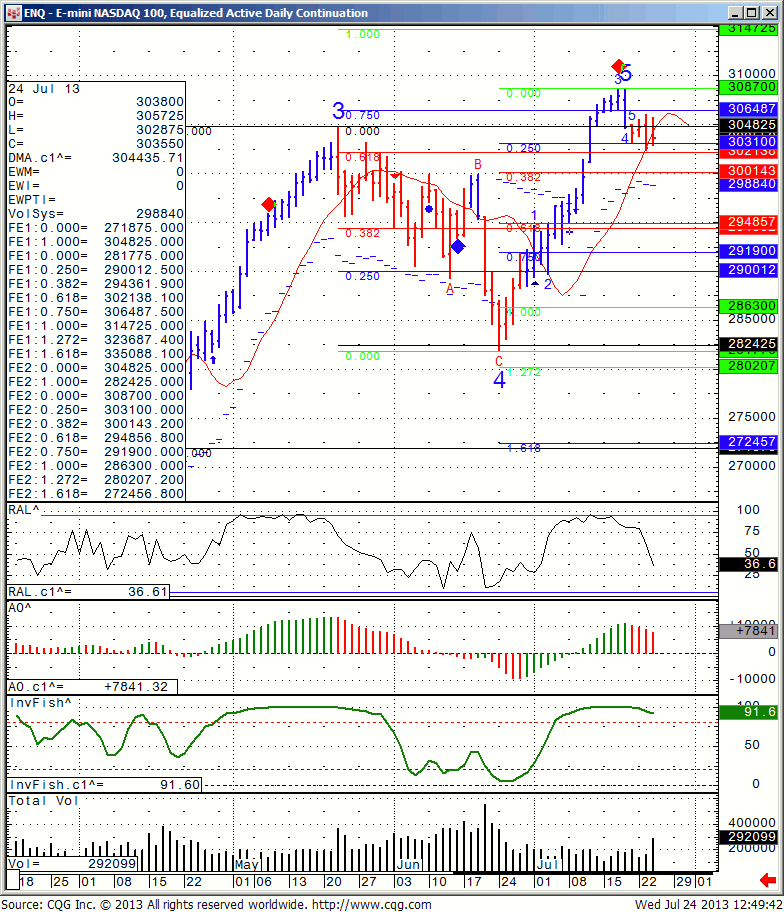
I wrote about stock index futures and the confusing technical picture we have. Today was the first down day in the SP 500 in a while, however, AAPL earnings sent the NASDAQ futures higher.

I think if NASDAQ futures can take out the 3021 level basis the September contract, we can actually see a more meaningful decline across the board.

Mini NASDAQ 100 futures daily chart for your review below.

mini NASDAQ futures


You like the information we share? We would appreciate your positive reviews on Google+ , Facebook, Yelp etc…use the icons below to share, recommend, review us and more!

Like us on FacebookFollow us on TwitterView our profile on LinkedInFind us on Google+Cannon Trading Futures Trading Resistance & Support Levels and Economic ReportsFind us on Yelp

Futures Trading Levels and Economic Reports for July 24, 2013

Connect with Us! Use Our Futures Trading Levels and Economic Reports RSS Feed.

Like us on FacebookFollow us on TwitterView our profile on LinkedInFind us on Google+Cannon Trading Futures Trading Resistance & Support Levels and Economic ReportsFind us on Yelp

1. Market Commentary
2. Futures Support and Resistance Levels – S&P, Nasdaq, Dow Jones, Russell 2000, Dollar Index
3. Commodities Support and Resistance Levels – Gold, Euro, Crude Oil, T-Bonds
4. Commodities Support and Resistance Levels – Corn, Wheat, Beans, Silver
5. Futures Economic Reports for Wednesday July 24, 2013

Hello Traders,

For 2013 I would like to wish all of you discipline and patience in your trading!  

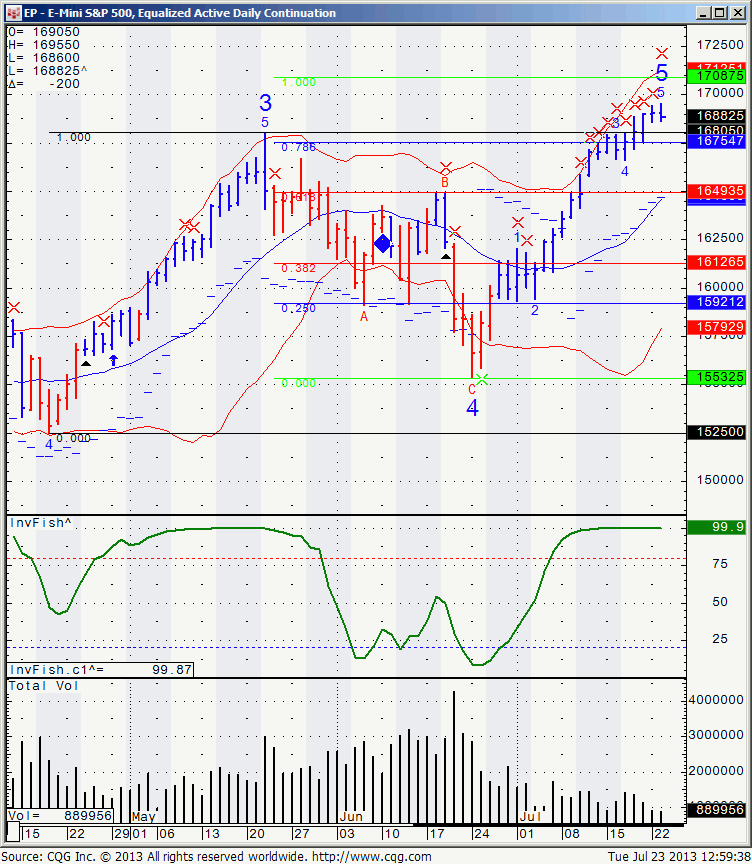
I must admit that stock index futures ( and the most popular one, the mini SP 500 or ESU3) are quite confusing for me these days….I am not getting a good read and the low volume ( notice at the bottom of the chart how much lower volume is the last few weeks) is adding to this confusion. Using some Fibonacci extensions, I am looking at a possible resistance at 1708.75 but it will be tempting to try the short side if the market can break 1675.00. In between, my personal opinion is to stay out if you are a swing trader as I dont see any swings yet….on the other hand if you are a day trader, mark your chart with important levels, get a feel for the early volume and try to asses early enough if the trading day going to be quiet and narrow like today or if there is chances for wider ranges and higher volatility like we witnessed few weeks ago.

Not an easy job. In between daily chart for your review below.

On a different note: I am getting very nice feedback on the content of this blog from clients as well as prospects and I appreciate it! In return I would like to ask you to take a few minutes and post positive reviews on:

Google Plus  ( you need to be logged in to your gmail account first)
I thank you in advance and hope you take a few minutes to do so.

Daily mini SP 500 chart for your review:

EP - E Mini S&P 500, Equalized Active Daily Continuation
EP – E Mini S&P 500, Equalized Active Daily Continuation

Futures Trading Levels and Economic Reports for July 19, 2013

Connect with Us! Use Our Futures Trading Levels and Economic Reports RSS Feed.

Like us on FacebookFollow us on TwitterView our profile on LinkedInFind us on Google+Cannon Trading Futures Trading Resistance & Support Levels and Economic ReportsFind us on Yelp

1. Market Commentary
2. Futures Support and Resistance Levels – S&P, Nasdaq, Dow Jones, Russell 2000, Dollar Index
3. Commodities Support and Resistance Levels – Gold, Euro, Crude Oil, T-Bonds
4. Commodities Support and Resistance Levels – Corn, Wheat, Beans, Silver
5. Futures Economic Reports for Friday July 19, 2013

Hello Traders,

For 2013 I would like to wish all of you discipline and patience in your trading! 

Big divergence today between NASDAQ futures and the rest of the indices ( SP500, Dow Jones, Russell). To be honest I am not sure if this can be a start of a turning point or not but if you are trading stock indices be aware of it.

As I wrote yesterday, i would like to see SP futures break below 1665 before going short and this did not happen yet.

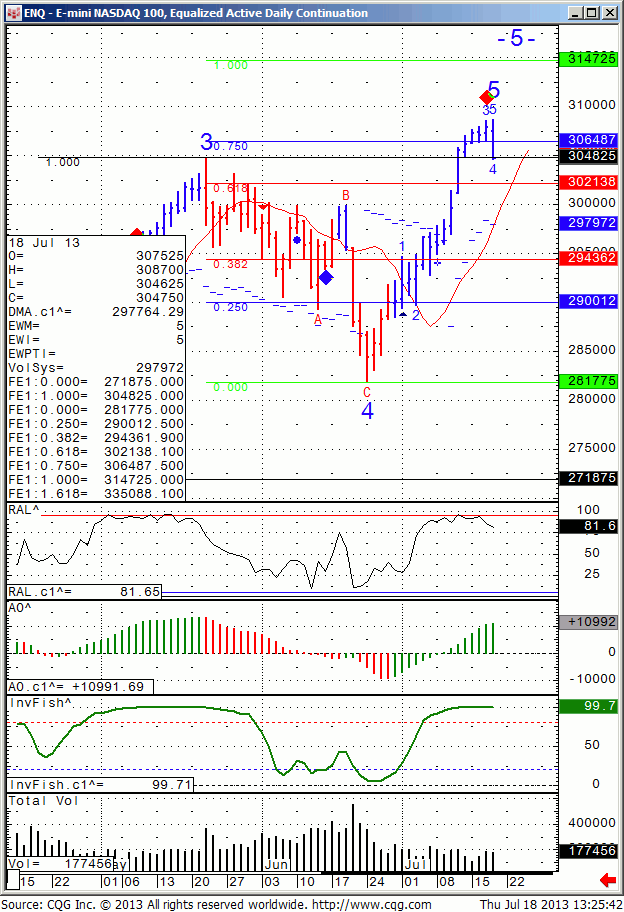
On the other hand the signal I got on the NASDAQ did get a confirmation once we broke below 3064 level. Daily chart with possible levels for your review below.

Futures Trading Levels and Economic Reports for July 18, 2013

Connect with Us! Use Our Futures Trading Levels and Economic Reports RSS Feed.

Like us on FacebookFollow us on TwitterView our profile on LinkedInFind us on Google+Cannon Trading Futures Trading Resistance & Support Levels and Economic ReportsFind us on Yelp

1. Market Commentary
2. Futures Support and Resistance Levels – S&P, Nasdaq, Dow Jones, Russell 2000, Dollar Index
3. Commodities Support and Resistance Levels – Gold, Euro, Crude Oil, T-Bonds
4. Commodities Support and Resistance Levels – Corn, Wheat, Beans, Silver
5. Futures Economic Reports for Thursday July 18, 2013

Hello Traders,

For 2013 I would like to wish all of you discipline and patience in your trading! 


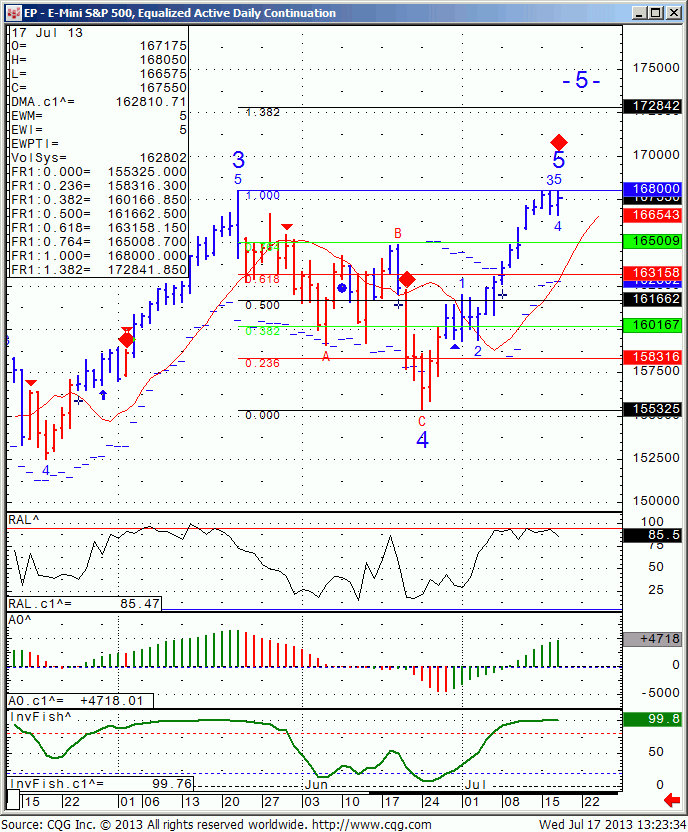
I got a sell signal on the daily mini SP chart ( see below the red diamond) . To be honest it does not mean much UNLESS price can break 1665.00. At that point I think we have better chances for a more meaningful pullback.
There are times when I like to enter trades using a stop order. i do this when I feel that I need to see certain levels brake and that if these specific levels break, I think the market has better chances of picking up speed and momentum in the same direction.  This is a good way to avoid picking tops and bottoms prematurely, like in todays example. I.E if market continues higher and does not break 1665 I will not get in a short position and stay out of the market. If it does, I may have given up a few points but for me personally, I will have more confidence in the trade.


EP - E Mini S&P 500, Equalized Active Daily Continuation
EP – E Mini S&P 500, Equalized Active Daily Continuation

Continue reading “Futures Trading Levels and Economic Reports for July 18, 2013”

E-Mini NASDAQ 100 Futures Technical Analysis for July 16th 2013

Sept. Mini NASDAQ futures ( symbol on most platforms is NQU3) are trading at 3070.00 at the time I am writing this analysis – July 16th 2013.

As a commodity futures broker,  I am going to focus on the technical aspect of this market and provide my technical opinion, I think it is important to be aware of the fundamental aspects and the events coming up which can move the market either way. To start with,  Traders are probably already looking forward to today’s testimony before Congress by Fed Chairman Ben Bernanke. The big question he will be asked is how does the FED plans on tapering down the massive injection of cash or what we know as QE. I think the reason the markets are down today is in anticipation of this testimony. Economic numbers will continue to pour in as well as a G20 meeting and earning season is in place.

Continue reading “E-Mini NASDAQ 100 Futures Technical Analysis for July 16th 2013”

Trading Levels and Economic Reports July 17, 2013

Connect with Us! Use Our Futures Trading Levels and Economic Reports RSS Feed.

Like us on FacebookFollow us on TwitterView our profile on LinkedInFind us on Google+Cannon Trading Futures Trading Resistance & Support Levels and Economic ReportsFind us on Yelp

1. Market Commentary
2. Futures Support and Resistance Levels – S&P, Nasdaq, Dow Jones, Russell 2000, Dollar Index
3. Commodities Support and Resistance Levels – Gold, Euro, Crude Oil, T-Bonds
4. Commodities Support and Resistance Levels – Corn, Wheat, Beans, Silver
5. Futures Economic Reports for Wednesday July 17, 2013

Hello Traders,

For 2013 I would like to wish all of you discipline and patience in your trading! 


In today’s post I actually want to share how I create volume charts using Sierra Charts (also known as AT charts). Email me to find out how you can have Sierra Charts for free!

I like to use volume charts for futures trading when it comes to intraday or high frequency trading. So if you are an active trader or a scalper, you may want to explore the use of volume charts and see if you can find an edge.


My theory is that when it comes to short term day trading, volume is much more important than time, hence the use of volume bars. I use bars of between 1,000 to 18,000 contracts traded (pending the specific market, based on recent volatility, trade volume and a few other factors). That means that instead of bars completing based on time frame (i.e. 1 minute or 15 minutes etc.), we use volume instead of time. So each time X,000 contracts traded, a new bar will complete. When the specific market has high volume and is moving fast, the bars will complete faster. When market is in low volume without much action, the bars will complete slower.


For me personally, this has helped getting signals ahead of time when there is fast action in the market and avoiding false signals when volume is low.


So in Sierra Charts I right click inside the chart and choose chart settings.


In chart settings I use the drop down menu under the Bar Period like in the screen shot below.


739


I then specify the amount of volume I want per bar. (I normally look at average daily volume and divide that by 20) and click apply.


Below you will see my intraday chart for the mini SP from today, using 10000 volume charts. That means that each time 10000 contracts traded, a new bar will start.


Hope this helps and if you have any questions, feel free to email me.


image.php?l=1374004498440


You like the information we share? We would appreciate your positive reviews on Google+ , Facebook, Yelp etc…use the icons below to share, recommend, review us and more!

Like us on FacebookFollow us on TwitterView our profile on LinkedInFind us on Google+Cannon Trading Futures Trading Resistance & Support Levels and Economic ReportsFind us on Yelp

If you like the information we share? We would appreciate your positive reviews on our new yelp!!

GOOD TRADING


Trading Futures, Options on Futures, and retail off-exchange foreign currency transactions involves substantial risk of loss and is not suitable for all investors. You should carefully consider whether trading is suitable for you in light of your circumstances, knowledge, and financial resources. You may lose all or more of your initial investment. Opinions, market data, and recommendations are subject to change at any time.


Futures Trading Levels

For complete contract specifications for the futures markets listed above click here!

5. Economic Reports

source:http://www.forexfactory.com/calendar.php

All times are Eastern time Zone (EST)

Date 3:42pm Currency Impact Detail Actual Forecast Previous Graph
WedJul 17  Tentative EUR German 10-y Bond Auction 1.55|1.5
8:30am USD Building Permits 1.00M 0.99M
USD Housing Starts 0.96M 0.91M
10:00am USD Fed Chairman Bernanke Testifies
10:30am USD Crude Oil Inventories -1.9M -9.9M
12:30pm USD FOMC Member Raskin Speaks
2:00pm USD Beige Book

This is not a solicitation of any order to buy or sell, but a current market view provided by Cannon Trading Inc. Any statement of facts herein contained are derived from sources believed to be reliable, but are not guaranteed as to accuracy, nor they purport to be complete. No responsibility is assumed with respect to any such statement or with respect to any expression of opinion herein contained. Readers are urged to exercise their own judgment in trading

Trading Levels and Economic Reports for July 16, 2013

Connect with Us! Use Our Futures Trading Levels and Economic Reports RSS Feed.

Like us on FacebookFollow us on TwitterView our profile on LinkedInFind us on Google+Cannon Trading Futures Trading Resistance & Support Levels and Economic ReportsFind us on Yelp

1. Market Commentary
2. Futures Support and Resistance Levels – S&P, Nasdaq, Dow Jones, Russell 2000, Dollar Index
3. Commodities Support and Resistance Levels – Gold, Euro, Crude Oil, T-Bonds
4. Commodities Support and Resistance Levels – Corn, Wheat, Beans, Silver
5. Futures Economic Reports for Tuesday July 13, 2013

Hello Traders,

For 2013 I would like to wish all of you discipline and patience in your trading! 


Stocks continue to move higher BUT on very low summer type of trading volume.
For most of you who are daytraders, the main question should be how does that changes the “personality ” of the trading day?
Are we back to narrower trading days with lower volatility? or is this just a break from the more volatile/wider trading ranges we witnessed when the market was moving lower?
Are we back to buying intraday dips and the market will continue to rally?
For those of you who are swing traders, the main question is what are the extended targets for this rally and is this a short covering rally from the recent sell off or a new leg up?

Obviously the answers are unknown at this point but knowing what to consider while trading can be helpful by itself.
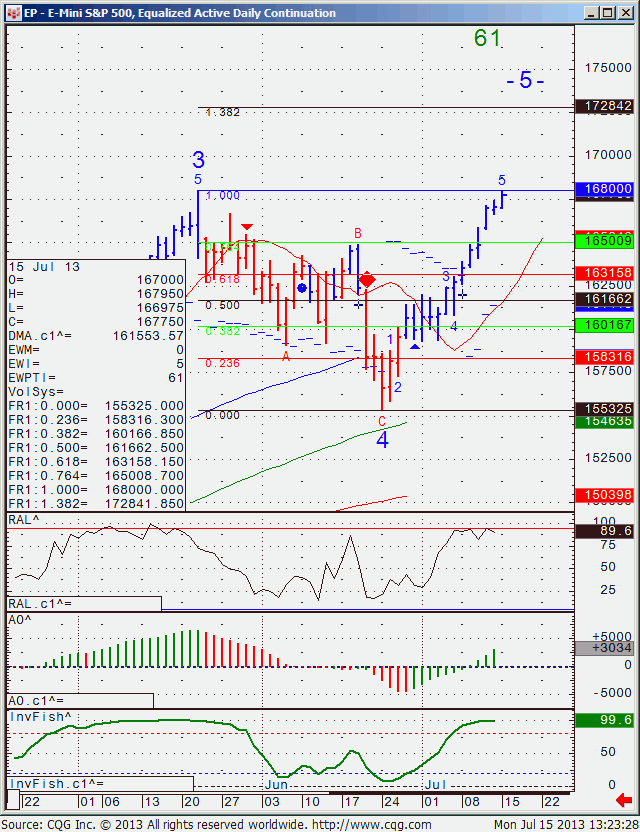
Daily chart of the mini SP 500 along with potential extensions to the upside and possible support levels below for your review


mini sp daily chart Continue reading “Trading Levels and Economic Reports for July 16, 2013”

SERVICES
SOFTWARE
Day Trading/Order Flow
COMPANY
QUICK LINKS

Follow Us On Social Media

Cannon Trading Company, Inc., Commodity Broker, Beverly Hills, CA