Futures Trading Levels and Economic Reports for July 19, 2013
Posted By:- Ilan Levy-Mayer Vice President, Cannon Trading Futures Blog
Connect with Us! Use Our Futures Trading Levels and Economic Reports RSS Feed.
![]()
![]()
![]()
![]()
![]()
![]()
1. Market Commentary
2. Futures Support and Resistance Levels – S&P, Nasdaq, Dow Jones, Russell 2000, Dollar Index
3. Commodities Support and Resistance Levels – Gold, Euro, Crude Oil, T-Bonds
4. Commodities Support and Resistance Levels – Corn, Wheat, Beans, Silver
5. Futures Economic Reports for Friday July 19, 2013
Hello Traders,
For 2013 I would like to wish all of you discipline and patience in your trading!
Big divergence today between NASDAQ futures and the rest of the indices ( SP500, Dow Jones, Russell). To be honest I am not sure if this can be a start of a turning point or not but if you are trading stock indices be aware of it.
As I wrote yesterday, i would like to see SP futures break below 1665 before going short and this did not happen yet.
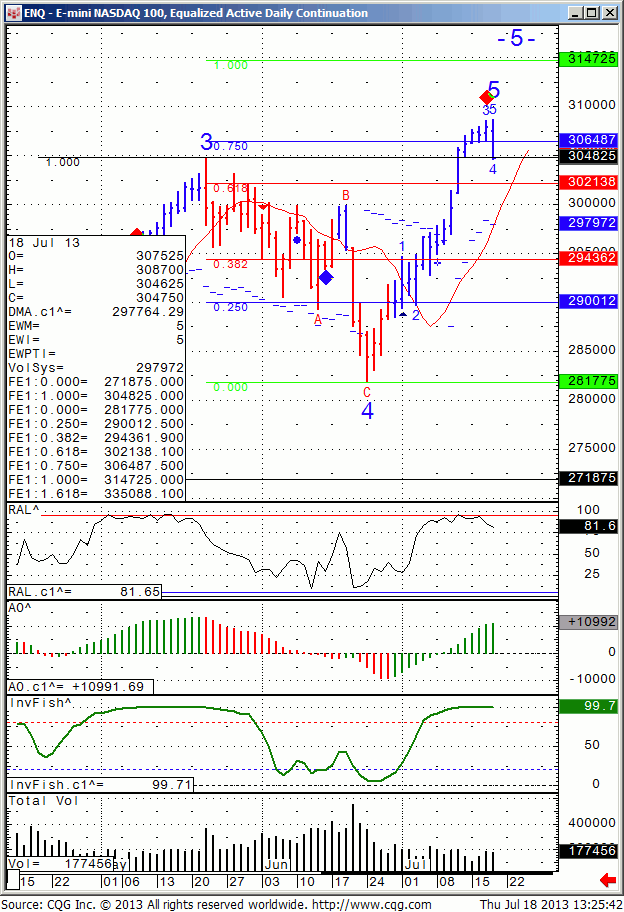
On the other hand the signal I got on the NASDAQ did get a confirmation once we broke below 3064 level. Daily chart with possible levels for your review below.

Mini Nasdaq 100 Futures Daily Chart
You like the information we share? We would appreciate your positive reviews on Google+ , Facebook, Yelp etc…use the icons below to share, recommend, review us and more!
If you like the information we share? We would appreciate your positive reviews on our new yelp!!
GOOD TRADING
Trading Futures, Options on Futures, and retail off-exchange foreign currency transactions involves substantial risk of loss and is not suitable for all investors. You should carefully consider whether trading is suitable for you in light of your circumstances, knowledge, and financial resources. You may lose all or more of your initial investment. Opinions, market data, and recommendations are subject to change at any time.
| Contract Sept. 2013 | SP500 (big & Mini) | Nasdaq100 (big & Mini) | Dow Jones (big & Mini) | Mini Russell | Dollar Index |
| Resistance 3 | 1706.50 | 3106.83 | 15676 | 1065.97 | 83.53 |
| Resistance 2 | 1697.50 | 3096.92 | 15605 | 1058.93 | 83.35 |
| Resistance 1 | 1689.75 | 3077.33 | 15543 | 1052.47 | 83.13 |
| Pivot | 1680.75 | 3067.42 | 15472 | 1045.43 | 82.95 |
| Support 1 | 1673.00 | 3047.83 | 15410 | 1038.97 | 82.73 |
| Support 2 | 1664.00 | 3037.92 | 15339 | 1031.93 | 82.55 |
| Support 3 | 1656.25 | 3018.33 | 15277 | 1025.47 | 82.33 |
| Contract | August Gold | Sept. Silver | August Crude Oil | Sept. Bonds | Sept. Euro |
| Resistance 3 | 1303.8 | 1989.7 | 111.24 | 136 19/32 | 1.3198 |
| Resistance 2 | 1295.9 | 1973.3 | 109.83 | 136 5/32 | 1.3164 |
| Resistance 1 | 1289.2 | 1954.2 | 108.96 | 135 11/32 | 1.3138 |
| Pivot | 1281.3 | 1937.8 | 107.55 | 134 29/32 | 1.3104 |
| Support 1 | 1274.6 | 1918.7 | 106.68 | 134 3/32 | 1.3078 |
| Support 2 | 1266.7 | 1902.3 | 105.27 | 133 21/32 | 1.3044 |
| Support 3 | 1260.0 | 1883.2 | 104.40 | 132 27/32 | 1.3018 |
| Contract | Dec Corn | Sept. Wheat | Nov.Beans | Dec. SoyMeal | Dec. bean Oil |
| Resistance 3 | 509.9 | 669.7 | 1288.83 | 393.93 | 46.07 |
| Resistance 2 | 505.6 | 667.8 | 1281.92 | 389.17 | 45.84 |
| Resistance 1 | 503.2 | 664.2 | 1273.83 | 383.53 | 45.61 |
| Pivot | 498.8 | 662.3 | 1266.92 | 378.77 | 45.38 |
| Support 1 | 496.4 | 658.7 | 1258.8 | 373.1 | 45.2 |
| Support 2 | 492.1 | 656.8 | 1251.92 | 368.37 | 44.92 |
| Support 3 | 489.7 | 653.2 | 1243.83 | 362.73 | 44.69 |
source:http://www.forexfactory.com/calendar.php
All times are Eastern time Zone (EST)
| Date | 3:48pm | Currency | Impact | Detail | Actual | Forecast | Previous | Graph | |
|---|---|---|---|---|---|---|---|---|---|
| FriJul 19 | 2:00am | EUR | German PPI m/m | -0.2% | -0.3% | ||||
| Tentative | EUR | Spanish HPI q/q | -0.8% | ||||||
| Day 1 | ALL | G20 Meetings |


