Trading Levels and Economic Reports for July 16, 2013
Posted By:- Ilan Levy-Mayer Vice President, Cannon Trading Futures Blog
Connect with Us! Use Our Futures Trading Levels and Economic Reports RSS Feed.
![]()
![]()
![]()
![]()
![]()
![]()
1. Market Commentary
2. Futures Support and Resistance Levels – S&P, Nasdaq, Dow Jones, Russell 2000, Dollar Index
3. Commodities Support and Resistance Levels – Gold, Euro, Crude Oil, T-Bonds
4. Commodities Support and Resistance Levels – Corn, Wheat, Beans, Silver
5. Futures Economic Reports for Tuesday July 13, 2013
Hello Traders,
For 2013 I would like to wish all of you discipline and patience in your trading!
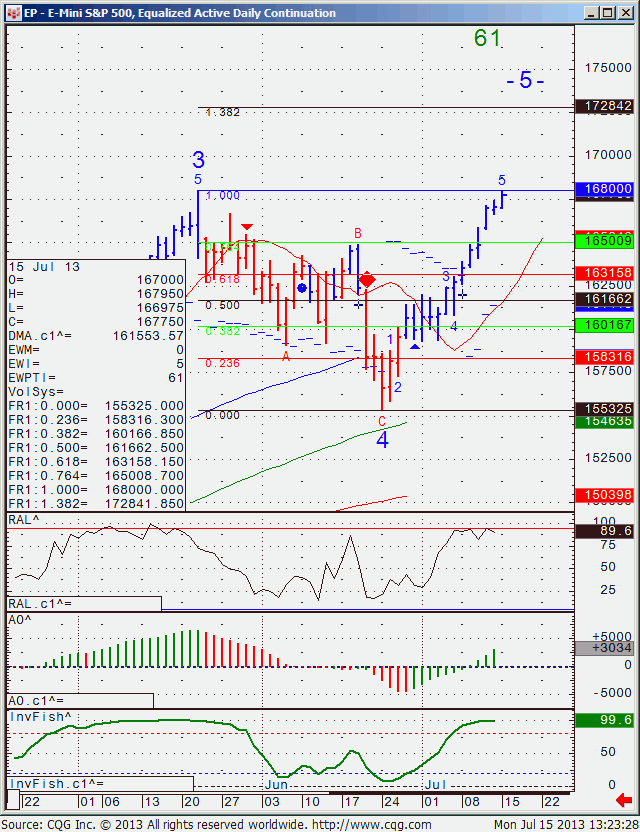
Obviously the answers are unknown at this point but knowing what to consider while trading can be helpful by itself.Daily chart of the mini SP 500 along with potential extensions to the upside and possible support levels below for your review

You like the information we share? We would appreciate your positive reviews on Google+ , Facebook, Yelp etc…use the icons below to share, recommend, review us and more!
If you like the information we share? We would appreciate your positive reviews on our new yelp!!
GOOD TRADING
Trading Futures, Options on Futures, and retail off-exchange foreign currency transactions involves substantial risk of loss and is not suitable for all investors. You should carefully consider whether trading is suitable for you in light of your circumstances, knowledge, and financial resources. You may lose all or more of your initial investment. Opinions, market data, and recommendations are subject to change at any time.
| Contract Sept. 2013 | SP500 (big & Mini) | Nasdaq100 (big & Mini) | Dow Jones (big & Mini) | Mini Russell | Dollar Index |
| Resistance 3 | 1691.17 | 3092.83 | 15538 | 1057.37 | 84.11 |
| Resistance 2 | 1685.33 | 3084.67 | 15491 | 1050.03 | 83.87 |
| Resistance 1 | 1681.42 | 3079.08 | 15455 | 1045.97 | 83.53 |
| Pivot | 1675.58 | 3070.92 | 15408 | 1038.63 | 83.28 |
| Support 1 | 1671.67 | 3065.33 | 15372 | 1034.57 | 82.94 |
| Support 2 | 1665.83 | 3057.17 | 15325 | 1027.23 | 82.70 |
| Support 3 | 1661.92 | 3051.58 | 15289 | 1023.17 | 82.36 |
| Contract | August Gold | Sept. Silver | August Crude Oil | Sept. Bonds | Sept. Euro |
| Resistance 3 | 1315.3 | 2079.8 | 109.12 | 136 21/32 | 1.3188 |
| Resistance 2 | 1304.4 | 2046.7 | 107.87 | 135 24/32 | 1.3136 |
| Resistance 1 | 1294.2 | 2020.3 | 107.14 | 135 8/32 | 1.3101 |
| Pivot | 1283.3 | 1987.2 | 105.89 | 134 11/32 | 1.3049 |
| Support 1 | 1273.1 | 1960.8 | 105.16 | 133 27/32 | 1.3014 |
| Support 2 | 1262.2 | 1927.7 | 103.91 | 132 30/32 | 1.2962 |
| Support 3 | 1252.0 | 1901.3 | 103.18 | 132 14/32 | 1.2927 |
| Contract | Dec Corn | Sept. Wheat | Nov.Beans | Dec. SoyMeal | Dec. bean Oil |
| Resistance 3 | 508.0 | 671.0 | 1279.17 | 386.17 | 46.00 |
| Resistance 2 | 506.5 | 670.5 | 1271.58 | 381.83 | 45.83 |
| Resistance 1 | 505.0 | 670.0 | 1267.67 | 379.37 | 45.55 |
| Pivot | 503.5 | 669.5 | 1260.08 | 375.03 | 45.38 |
| Support 1 | 502.0 | 669.0 | 1256.2 | 372.6 | 45.1 |
| Support 2 | 500.5 | 668.5 | 1248.58 | 368.23 | 44.93 |
| Support 3 | 499.0 | 668.0 | 1244.67 | 365.77 | 44.65 |
source:http://www.forexfactory.com/calendar.php
All times are Eastern time Zone (EST)
| Date | 3:54pm | Currency | Impact | Detail | Actual | Forecast | Previous | Graph | |
|---|---|---|---|---|---|---|---|---|---|
| TueJul 16 | 4:00am | EUR | Italian Trade Balance | 2.14B | 1.91B | ||||
| 5:00am | EUR | German ZEW Economic Sentiment | 39.8 | 38.5 | |||||
| EUR | ZEW Economic Sentiment | 31.8 | 30.6 | ||||||
| EUR | CPI y/y | 1.6% | 1.6% | ||||||
| EUR | Core CPI y/y | 1.2% | 1.2% | ||||||
| EUR | Trade Balance | 15.8B | 16.1B | ||||||
| 8:30am | USD | Core CPI m/m | 0.2% | 0.2% | |||||
| USD | CPI m/m | 0.3% | 0.1% | ||||||
| 9:00am | USD | TIC Long-Term Purchases | 14.3B | -37.3B | |||||
| 9:15am | USD | Capacity Utilization Rate | 77.8% | 77.6% | |||||
| USD | Industrial Production m/m | 0.2% | 0.0% | ||||||
| 10:00am | USD | NAHB Housing Market Index | 51 | 52 | |||||
| 2:15pm | USD | FOMC Member George Speaks |


