|
- Bitcoin Futures (111)
- Charts & Indicators (297)
- Commodity Brokers (589)
- Commodity Trading (845)
- Corn Futures (64)
- Crude Oil (229)
- Currency Futures (102)
- Day Trading (658)
- Day Trading Webinar (61)
- E-Mini Futures (162)
- Economic Trading (166)
- Energy Futures (127)
- Financial Futures (177)
- Future Trading News (3,151)
- Future Trading Platform (326)
- Futures Broker (665)
- Futures Exchange (347)
- Futures Trading (1,263)
- futures trading education (446)
- Gold Futures (108)
- Grain Futures (101)
- Index Futures (271)
- Indices (233)
- Metal Futures (128)
- Nasdaq (79)
- Natural Gas (40)
- Options Trading (191)
- S&P 500 (143)
- Trading Guide (421)
- Trading Webinar (60)
- Trading Wheat Futures (45)
- Uncategorized (26)
- Weekly Newsletter (221)
Category: Charts & Indicators
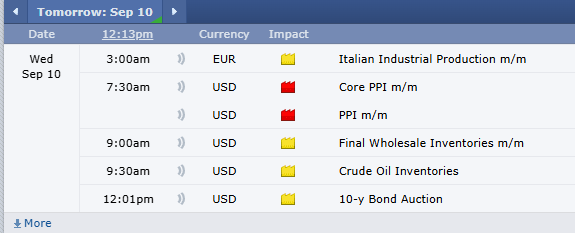
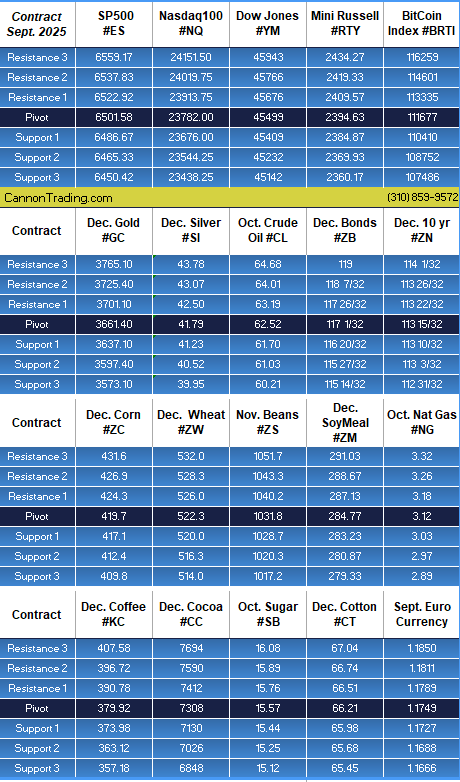
Cattle – Live & Feeder, Core PPI, Webinar TOMORROW MORNING!!! Levels, Reports; Your 5 Important Must-Knows for Trading Futures on Wednesday, September 10th, 2025
|
|
|
||||||||||||||||||||||||||||||||||||||||||||||||||||||||||||||||
|
||||||||||||||||||||||||||||||||||||||||||||||||||||||||||||||||
|
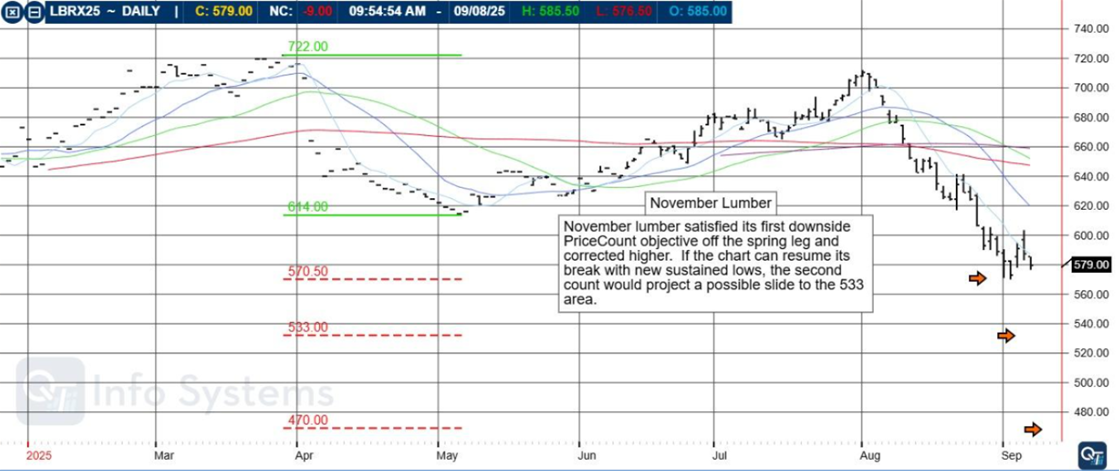
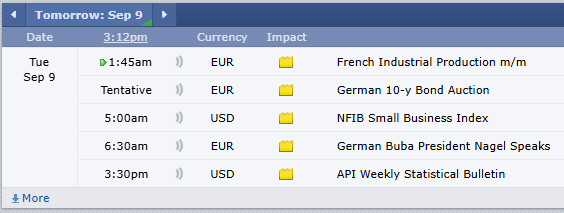
Webinar Wednesday – Decoding the Markets, November Lumber, Levels, Reports: Your 4 Important Must-Knows for Trading Futures on September 9th, 2025
|
 |
|
Fed Announcements, CPI, PPI, WASDE, Levels, Reports; Your 6 Important Must-Knows for Trading Futures the Week of September 8th, 2025
|
||||||||||||||||||||||||||||||||||||||||||||||||||||||||||||||||||||||||||||||||||||
|
||||||||||||||||||||||||||||||||||||||||||||||||||||||||||||||||||||||||||||||||||||
|
First Notice Last Trading Days, December Wheat Corn Spread, Levels, Reports; Your 4 Important Must-Knows for Trading Futures on September 5th, 2025
|
|
|||||||||||||||||||||||||||||||||||||||||||||||||||||||||||||||||
|
|||||||||||||||||||||||||||||||||||||||||||||||||||||||||||||||||
|
Futures Brokers; Five Undeniable Traits of the Top Futures Brokers

Futures Brokers

The second half of 2025 presents traders with extraordinary opportunities in futures trading, but it also demands heightened responsibility, discipline, and insight. Volatility remains elevated across commodities, equities, cryptocurrencies, and interest-rate derivatives as central banks adjust policies amid a turbulent global economy. Traders are increasingly relying on their futures brokers not just for execution but also for guidance, risk management tools, and robust trading platforms.
Choosing the best futures brokers isn’t just about low commissions or fast executions—it’s about aligning yourself with a trusted partner who helps you navigate complexity with confidence. In this context, Cannon Trading Company stands out as one of the top-rated futures brokers USA, thanks to its decades of industry experience, an exemplary regulatory record, cutting-edge platform offerings, and hundreds of verified five-star ratings on TrustPilot.
In this article, we’ll explore:
- How traders can leverage their futures broker to ensure responsible trading in H2 2025.
- The evolving role of futures brokers in the age of AI-driven, high-speed markets.
- Why Cannon Trading Company is a leading ally for traders navigating today’s markets.
- The importance of technology, compliance, and education when trading futures responsibly.
Try a FREE Demo!
The Evolving Role of Futures Brokers in 2025
In 2025, the role of a futures broker has transformed from that of a simple trade executor to that of a comprehensive trading partner. Traditional brokers offered order execution and access to exchanges, but modern futures brokers are now:
- Risk Advisors – Helping traders understand leverage, margin requirements, and downside exposure.
- Platform Gatekeepers – Providing access to powerful futures options trading platforms like CQG, Rithmic, TradingView, MotiveWave, and Bookmap.
- Compliance Leaders – Ensuring traders meet federal regulations and exchange guidelines.
- Educators – Equipping traders with research, insights, and learning resources.
- Innovation Hubs – Integrating AI, analytics, and high-speed routing to support optimal trade decisions.
When working with the best futures brokers, traders aren’t just selecting a transactional service—they’re choosing a strategic partner capable of helping them make smarter, more responsible decisions when trading futures.
Why Responsible Futures Trading Matters in H2 2025
The second half of 2025 brings heightened uncertainty across asset classes:
- Interest Rates: Central banks are balancing inflation and slowing growth.
- Commodities: Energy and agricultural markets remain volatile amid supply chain disruptions.
- Equity Futures: The S&P 500 and Nasdaq futures show increased sensitivity to geopolitical developments.
- Digital Assets: Cryptocurrencies and micro ether futures continue attracting speculative interest.
These dynamics underscore the importance of disciplined strategies. Traders who over-leverage or ignore risk parameters face amplified losses. Responsible trading in this environment involves:
- Setting realistic position sizes.
- Using stop-loss orders effectively.
- Diversifying across asset classes.
- Leveraging analytics from futures options trading platforms.
- Working closely with a knowledgeable futures broker to stay informed and compliant.
The right futures brokers USA empower traders to adapt, manage risk, and maintain consistency amid shifting markets.
How Traders Can Leverage Their Futures Broker for Responsible Trading
- Access to Top-Tier Futures Trading Platforms
In H2 2025, execution speed and analytical capabilities matter more than ever. The best futures brokers provide traders with access to world-class futures options trading platforms, such as:
- CQG – Known for lightning-fast execution and institutional-grade charting.
- TradingView – Offers an intuitive interface and integrated social trading insights.
- Bookmap – Delivers granular order-flow visualization for scalpers and high-frequency traders.
- Rithmic/RTrader Pro – Ideal for algorithmic traders seeking low-latency connectivity.
- MotiveWave – Advanced Elliott Wave and Gann analysis tools for technical traders.
By leveraging these technologies, traders can better evaluate price action, manage positions, and implement advanced strategies responsibly.
- Guidance on Risk Management
A seasoned futures broker serves as an invaluable resource for risk mitigation. They help traders:
- Understand margin requirements for different contracts.
- Set maximum daily loss limits to prevent emotional overtrading.
- Implement trailing stops and hedge positions using futures options trading strategies.
- Diversify across multiple products to reduce portfolio volatility.
Traders working with experienced futures brokers USA gain a safety net against avoidable mistakes, enabling them to maintain longevity in volatile markets.
- Education and Market Research
The best futures brokers go beyond execution to deliver actionable intelligence. Educational resources include:
- Webinars on evolving futures markets and strategies.
- Real-time news feeds and economic event alerts.
- Analysis of open interest, volume, and sentiment data.
- Tutorials on futures broker options for hedging and speculation.
This combination of technology and education is essential for building a disciplined approach to trading futures responsibly.
- Personalized Support and Compliance Assistance
Unlike discount-only firms, full-service futures brokers like Cannon Trading Company offer personal guidance. In 2025, compliance remains critical as regulators tighten oversight to protect retail traders. A trusted futures broker helps ensure:
- Adherence to CFTC and NFA guidelines.
- Correct reporting of positions and margins.
- Proper understanding of leverage and exposure.
By acting as both a compliance resource and execution partner, a broker reduces legal and financial risks for traders.
Why Cannon Trading Company Stands Out

Decades of Experience
Founded in 1988, Cannon Trading Company has spent nearly four decades helping traders succeed in dynamic futures markets. This depth of experience gives the firm unparalleled insight into market cycles, trader psychology, and technological innovation.
Five-Star TrustPilot Ratings
With numerous verified 5 out of 5-star ratings on TrustPilot, Cannon Trading Company has earned a stellar reputation among traders worldwide. These reviews highlight exceptional customer service, transparent pricing, and fast execution.
Exemplary Regulatory Reputation
Cannon maintains spotless relationships with federal and independent regulators, including the CFTC and NFA. Their emphasis on compliance gives traders confidence that they’re working with one of the best futures brokers in the industry.
Wide Selection of Futures Trading Platforms
Unlike brokers tied to a single platform, Cannon offers a diverse suite of futures options trading platforms to match every trader’s style, including CQG, Rithmic, TradingView, and MotiveWave.
This flexibility empowers traders to choose the ideal tools for their strategy while enjoying expert support from Cannon’s team.
The Power of Futures Options with the Right Broker
An area where a skilled futures options broker shines is helping traders incorporate options into their strategies. Options on futures contracts enable traders to:
- Hedge against downside risks while holding long futures positions.
- Generate income through premium-selling strategies.
- Structure trades with asymmetric risk-reward profiles.
With Cannon Trading Company’s expertise, traders gain access to cutting-edge futures broker options and personalized guidance on how to integrate options into their portfolio responsibly.
Responsible Trading Strategies for H2 2025
To thrive in today’s markets, traders should combine advanced tools with discipline. Here are key strategies:
- Adopt a Risk-First Mindset
- Limit exposure per trade to a fixed percentage of account equity.
- Use volatility-based position sizing to account for fluctuating markets.
- Leverage Broker Research and Insights
- Utilize analytics and educational materials provided by futures brokers USA.
- Use Futures and Options Together
- Combine outright futures contracts with protective options to limit downside while keeping upside potential.
- Harness Automation Responsibly
- Use algorithmic features on futures options trading platforms but maintain manual oversight.
With a trusted futures broker like Cannon Trading Company, these strategies become easier to execute effectively.
The second half of 2025 will test traders’ discipline, adaptability, and strategy. Partnering with the best futures brokers—especially those with deep experience, regulatory excellence, and cutting-edge tools—is essential for success.
Cannon Trading Company continues to stand out as a premier choice among futures brokers USA, offering:
- Decades of expertise.
- Exceptional customer satisfaction with countless five-star TrustPilot reviews.
- A strong regulatory reputation.
- Access to elite futures options trading platforms for every trading style.
For traders looking to navigate complex markets responsibly, Cannon Trading Company is more than just a futures broker—it’s a strategic ally.
Try a FREE Demo!
Ready to start trading futures? Call us at 1(800)454-9572 (US) or (310)859-9572 (International), or email info@cannontrading.com to speak with one of our experienced, Series-3 licensed futures brokers and begin your futures trading journey with Cannon Trading Company today.
Disclaimer: Trading Futures, Options on Futures, and retail off-exchange foreign currency transactions involve substantial risk of loss and are not suitable for all investors. Past performance is not indicative of future results. Carefully consider if trading is suitable for you in light of your circumstances, knowledge, and financial resources. You may lose all or more of your initial investment. Opinions, market data, and recommendations are subject to change at any time.
Important: Trading commodity futures and options involves a substantial risk of loss. The recommendations contained in this article are opinions only and do not guarantee any profits. This article is for educational purposes. Past performances are not necessarily indicative of future results.
This article has been generated with the help of AI Technology and modified for accuracy and compliance.
Follow us on all socials: @cannontrading
Labor Department Reports, Non Farm Payroll, ADP, Levels, Reports; Your 5 Important Must-Knows for Trading Futures on September 4th, 2025
|
Labor Day Weekend 2025, Non Farm Payroll, December 10 Year Notes, Levels, Reports; Your 4 Important Must-Knows for Trading Futures the Week of September 1st, 2025
|
||||||||||||||||||||||||||||||||||||||||||||||||||||||||||||||||||||||||||||||||||||||||
|
||||||||||||||||||||||||||||||||||||||||||||||||||||||||||||||||||||||||||||||||||||||||
|
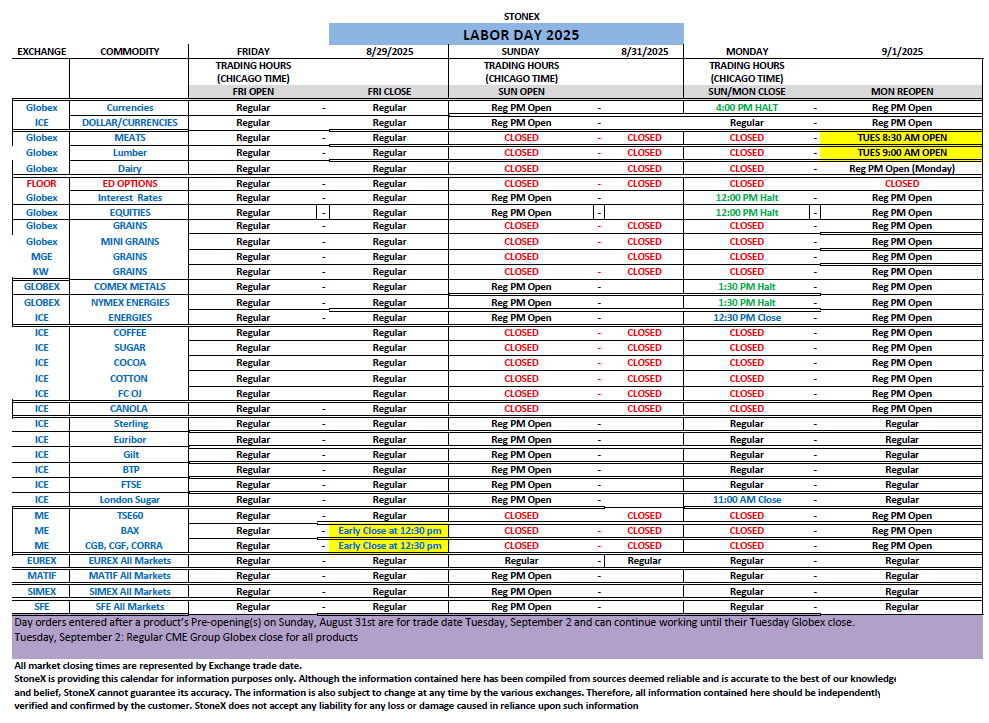
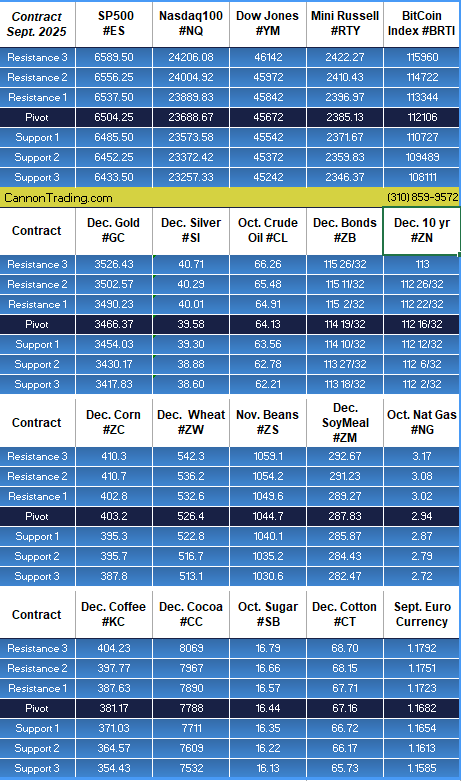
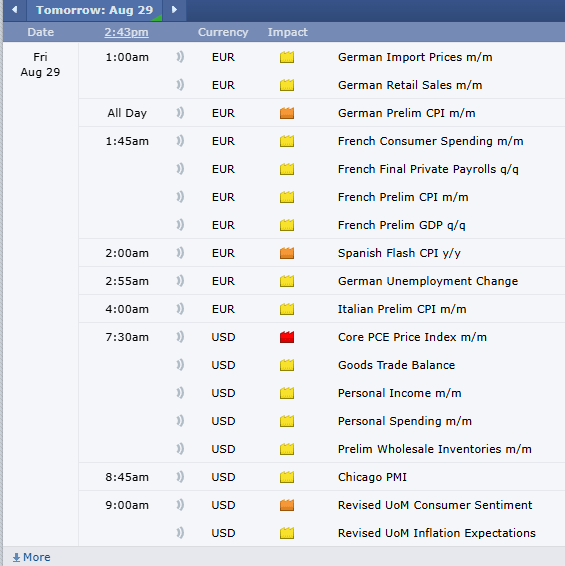
PCE Tomorrow, Labor Day Weekend Trading Hours, Levels, Reports; Your 5 Important Need-To-Knows for Trading Futures on August 29th, 2025
|
|
|
|||||||||||||||||||||||||||||||||||||||||||||||||||||||||||||
|
|||||||||||||||||||||||||||||||||||||||||||||||||||||||||||||
|
Silver Futures Contract; Your 6 Important Need-To-Knows for Trading Silver Futures Contracts
Silver Futures Contract


The silver futures contract is a powerful instrument for investors and speculators seeking exposure to the silver market without directly owning the physical metal. As we move into the final two trimesters of 2025, the silver market stands at a critical juncture influenced by macroeconomic shifts, industrial demand, and investor sentiment. In this detailed analysis, we’ll explore the expected trajectory of silver futures prices, key drivers shaping the market, and how reputable firms like Cannon Trading Company provide a robust foundation for trading success.
With decades of experience, 5-star TrustPilot ratings, and a reputation for excellence with both federal and independent regulators, Cannon Trading Company is one of the best futures brokers for navigating the complexities of trading futures—particularly in volatile markets like silver.
The Role and Mechanics of a Silver Futures Contract
A silver futures contract is a legally binding agreement to buy or sell a specific quantity of silver (typically 5,000 troy ounces) at a predetermined price and date in the future. These contracts are traded on commodities exchanges like the CME Group and are used for hedging, speculation, and price discovery.
Key Features
- Standardization: Contracts are standardized, ensuring uniformity in terms of quantity and quality of silver.
- Leverage: Futures trading allows traders to control large amounts of silver with a relatively small amount of capital.
- Liquidity: Silver futures are among the most actively traded contracts, providing high liquidity.
Whether you’re hedging against inflation or speculating on silver futures prices, this instrument offers a level of flexibility and exposure that spot silver simply cannot match.
Macroeconomic Landscape: What Lies Ahead for Silver Futures Contracts in 2025?
As we enter the second half of 2025, several critical factors are shaping the outlook for silver future prices.
- Monetary Policy and Interest Rates
The Federal Reserve’s trajectory in the latter half of 2025 is expected to shift slightly dovish after a series of rate hikes between late 2024 and early 2025. A cooling labor market and slowing inflation have raised the possibility of modest rate cuts. This could benefit precious metals, particularly silver, which tends to thrive in low-interest-rate environments.
Silver futures are inversely correlated with real interest rates. As yields decline, the opportunity cost of holding non-yielding assets like silver diminishes, potentially driving up silver futures prices.
- Geopolitical Uncertainty
Escalating tensions in Eastern Europe and disruptions in global trade routes have increased the appeal of safe-haven assets. Investors traditionally turn to gold, but silver, being both a precious and industrial metal, sees dual inflows from risk-averse and opportunistic investors.
These geopolitical developments could lead to increased volatility in the silver futures contract market, attracting traders looking for profitable price swings.
- Industrial Demand Boom
Silver’s unique properties make it indispensable for several high-growth industries:
- Green Energy: Solar panels use large quantities of silver. With global solar deployment expected to hit record levels in late 2025, demand will rise.
- EV Manufacturing: Electric vehicles utilize silver in batteries, wiring, and semiconductors.
- Electronics: 5G infrastructure and AI server farms require significant silver input.
As industrial usage rises, silver future prices may experience strong upward pressure, especially during Q3 and Q4 when many factories ramp up production ahead of the holiday and fiscal year-end cycles.
Silver Futures Price Forecast for the Final Trimesters of 2025
Q3 2025: Moderate Bullish Outlook
- Expected range: $33.00 – $42.00 per ounce
- Drivers:
- Rate cut expectations from the Federal Reserve
- Strong Q2 earnings in renewable energy and EV sectors
- Ongoing geopolitical instability
Market participants may see silver futures prices move steadily upward in Q3, but not without periods of pullbacks and profit-taking.
Q4 2025: High Volatility with Bullish Tilt
- Expected range: $33.50 – $40.00 per ounce
- Drivers:
- End-of-year fund reallocations
- Strong holiday season demand for electronics
- Potential short-covering rallies
Q4 may witness explosive moves in silver futures, driven by institutional repositioning and tight physical supply constraints. Traders should be prepared for sudden price swings, making risk management crucial.
Why Cannon Trading Company Is a Leading Futures Brokerage for Silver Traders


Navigating the nuanced world of trading futures, especially something as volatile as silver, requires expertise, reliable tools, and exceptional client support. That’s exactly what Cannon Trading Company delivers.
- Decades of Experience
Established in 1988, Cannon Trading Company has weathered every major market storm, from the Dot-Com Bubble to the 2008 financial crisis to the COVID-19 crash. Their longevity is a testament to their deep knowledge of futures trading and their ability to adapt to new challenges.
When dealing with complex instruments like the silver futures contract, experience is everything.
- Exceptional Regulatory Reputation
Cannon Trading maintains an exemplary standing with both federal regulators (such as the CFTC and NFA) and independent industry watchdogs. This ensures clients operate in a secure, compliant, and transparent trading environment.
Among futures brokers USA, very few match the regulatory track record of Cannon Trading Company.
- TrustPilot Reviews: A Testament to Client Satisfaction
Cannon boasts numerous 5 out of 5-star ratings on TrustPilot, an independent consumer review platform. Clients routinely praise their responsiveness, personalized service, and the quality of their trading insights. This makes them a strong contender among the best futures brokers in the world.
“Knowledgeable brokers and amazing service. Always willing to help. Highly recommend!” – Verified TrustPilot Reviewer
- Wide Selection of Top-Tier Trading Platforms
Whether you’re a scalper, swing trader, or long-term investor in silver futures, Cannon Trading provides access to powerful trading platforms:
- CannonX powered by CQG: A premium platform known for lightning-fast execution and detailed market data. Ideal for traders who require precision and speed.
- MultiCharts and RTrader Pro: Advanced platforms offering robust charting and risk management tools.
Having access to multiple platforms allows traders to customize their strategy, which is essential when dealing with unpredictable silver future prices.
CannonX Powered by CQG: The Game-Changer
Among the various platforms offered, CannonX powered by CQG stands out. Built on one of the most reliable infrastructures in the industry, this platform enables:
- Real-time quotes for silver futures contracts
- Depth-of-market views to analyze order flow
- Risk management tools tailored for trading futures
- Mobile and desktop compatibility
For traders focused on silver futures prices, speed, accuracy, and low latency can mean the difference between a gain and a missed opportunity. CannonX delivers all three with finesse.
Futures Brokers vs. Best Futures Brokers: Why Cannon Leads
The difference between ordinary futures brokers and the best futures brokers lies in the details:
| Criteria | Average Brokers | Cannon Trading Company |
| Years in Business | 5–10 | 35+ |
| Platform Variety | 1–2 | 10+ |
| Regulatory Standing | Mixed | Exceptional |
| TrustPilot Ratings | 3.5–4.0 stars | 5 out of 5 stars |
| Client Support Hours | Limited | Extended (phone/email/chat) |
| Educational Resources | Basic | Extensive (blogs, webinars, 1-on-1 coaching) |
Traders seeking the best futures brokers for silver contracts will find that Cannon offers unmatched value in service and tools.
Educational Support: Equipping Traders for Success
Beyond just account management, Cannon Trading believes in empowering its clients. Their suite of educational materials includes:
- Webinars on silver futures contract trading
- Daily market commentaries
- Technical and fundamental analysis
- One-on-one mentorship sessions
This commitment to client growth distinguishes them from many future brokers who focus solely on transactional relationships.
Risk Management Strategies for Silver Futures Contracts
Trading silver futures contracts involves inherent risks due to leverage and market volatility. Here are some essential strategies Cannon brokers recommend:
- Set Stop-Loss Orders
To prevent catastrophic losses during rapid price reversals, use stop-loss levels based on technical indicators or volatility bands.
- Use Hedging Techniques
For portfolio managers, hedging with silver futures can protect against price fluctuations in physical holdings or ETFs.
- Stay Informed
Track economic indicators like interest rates, GDP data, and industrial production. These elements directly impact silver futures prices.
Cannon Trading supports these efforts by offering real-time market updates and personalized trading alerts, making it one of the most responsive futures brokers USA has to offer.
Silver Futures Contracts in the Global Context
It’s essential to remember that silver futures prices are influenced not just by domestic trends but by global events. Key international factors include:
- Chinese industrial output: China is the largest consumer of silver in manufacturing.
- Latin American mining supply: Peru and Mexico supply a significant portion of global silver.
- Currency volatility: A weakening dollar generally supports higher silver future prices.
Cannon Trading provides global insights through its research desk, ensuring clients stay ahead of international trends affecting silver futures.
The silver futures contract continues to be one of the most dynamic and rewarding financial instruments available to modern traders. With the final two trimesters of 2025 promising high volatility and potential bullish momentum, now is a pivotal time to get involved. Whether you’re a seasoned veteran or new to trading futures, choosing the right brokerage partner is crucial.
Cannon Trading Company stands out among futures brokers USA thanks to its:
- Decades of market expertise
- Top-tier platforms like CannonX powered by CQG
- 5-star TrustPilot reputation
- Commitment to education and client success
- Strong standing with federal and independent regulators
When evaluating futures brokers, there’s a clear distinction between average and elite. Cannon belongs in the upper echelon of best futures brokers, delivering consistent value, integrity, and results.
Ready to start trading futures? Call us at 1(800)454-9572 (US) or (310)859-9572 (International), or email info@cannontrading.com to speak with one of our experienced, Series-3 licensed futures brokers and begin your futures trading journey with Cannon Trading Company today.
Disclaimer: Trading Futures, Options on Futures, and retail off-exchange foreign currency transactions involve substantial risk of loss and are not suitable for all investors. Past performance is not indicative of future results. Carefully consider if trading is suitable for you in light of your circumstances, knowledge, and financial resources. You may lose all or more of your initial investment. Opinions, market data, and recommendations are subject to change at any time.
Important: Trading commodity futures and options involves a substantial risk of loss. The recommendations contained in this article are opinions only and do not guarantee any profits. This article is for educational purposes. Past performances are not necessarily indicative of future results.
This article has been generated with the help of AI Technology and modified for accuracy and compliance.
Follow us on all socials: @cannontrading
- January 2026
- December 2025
- November 2025
- October 2025
- September 2025
- August 2025
- July 2025
- June 2025
- May 2025
- April 2025
- March 2025
- February 2025
- January 2025
- December 2024
- November 2024
- October 2024
- September 2024
- August 2024
- July 2024
- June 2024
- May 2024
- April 2024
- March 2024
- February 2024
- January 2024
- December 2023
- November 2023
- October 2023
- September 2023
- August 2023
- July 2023
- June 2023
- May 2023
- April 2023
- March 2023
- February 2023
- January 2023
- December 2022
- November 2022
- October 2022
- September 2022
- August 2022
- July 2022
- June 2022
- May 2022
- April 2022
- March 2022
- February 2022
- January 2022
- December 2021
- November 2021
- October 2021
- September 2021
- August 2021
- July 2021
- June 2021
- May 2021
- April 2021
- March 2021
- February 2021
- January 2021
- December 2020
- November 2020
- October 2020
- September 2020
- August 2020
- July 2020
- June 2020
- May 2020
- April 2020
- March 2020
- February 2020
- January 2020
- December 2019
- November 2019
- October 2019
- September 2019
- August 2019
- July 2019
- June 2019
- May 2019
- April 2019
- March 2019
- February 2019
- January 2019
- December 2018
- November 2018
- October 2018
- September 2018
- August 2018
- July 2018
- June 2018
- May 2018
- April 2018
- March 2018
- February 2018
- January 2018
- December 2017
- November 2017
- October 2017
- September 2017
- August 2017
- July 2017
- June 2017
- May 2017
- April 2017
- March 2017
- February 2017
- January 2017
- December 2016
- November 2016
- October 2016
- September 2016
- August 2016
- July 2016
- June 2016
- May 2016
- April 2016
- March 2016
- February 2016
- January 2016
- December 2015
- November 2015
- October 2015
- September 2015
- August 2015
- July 2015
- June 2015
- May 2015
- April 2015
- March 2015
- February 2015
- January 2015
- December 2014
- November 2014
- October 2014
- September 2014
- August 2014
- July 2014
- June 2014
- May 2014
- April 2014
- March 2014
- February 2014
- January 2014
- December 2013
- November 2013
- October 2013
- September 2013
- August 2013
- July 2013
- June 2013
- May 2013
- April 2013
- March 2013
- February 2013
- January 2013
- December 2012
- November 2012
- October 2012
- September 2012
- August 2012
- July 2012
- June 2012
- May 2012
- April 2012
- March 2012
- February 2012
- January 2012
- December 2011
- November 2011
- October 2011
- September 2011
- August 2011
- July 2011
- June 2011
- May 2011
- April 2011
- March 2011
- February 2011
- January 2011
- December 2010
- November 2010
- October 2010
- September 2010
- August 2010
- July 2010
- June 2010
