Post FOMC Market Action? + 03.23.2023 Trading Levels

Get Real Time updates and more on our private FB group!

Post FOMC:

By Mark O’Brien, Senior broker

General


Count ‘em: nine in a row. That’s how many meetings the Federal Reserve has increased its key interest rate. As of today’s .25-point increase, the federal funds rate target range stands at 4.75%-5.00%, the highest level since September 2007. The vote by all 11 members of the Federal Open Market Committee was unanimous. Clearly, the bank runs that toppled Silicon Vally Bank and roiled the banking industry have been front and center in the financial world the last two weeks, but the situation fazed Fed officials little if at all. “The U.S. banking system is sound and resilient,” said the prepared policy statement released at 1:00 P.M., Central Time today. Fighting inflation, it seems, remains the Central Bank’s focus.


Metals


On Monday, gold futures (basis April) pierced through $2,000 per ounce intraday for the first time in a year as the U.S. banking crisis spread to Europe with Credit Suisse, a preeminent name in global investment banking, sought help from Switzerland’s central bank and then put itself up for sale. This marked a ±$18,000 per 100-oz. futures contract move in just eight trading sessions from March 9.


Grains


Wheat continued its ±8-month slide from its multi-year spike high above $13/bushel on the heels of Russia’s invasion of Ukraine to lows not seen since July ’21 as traders see improvement in U.S. winter wheat crop conditions and a lack of significant weather issues across key northern hemisphere wheat producers. The front month May contract closed today at it’s life-of-contract low of $6.22 ¾ per bushel.


Energy


Crude oil continued its almost 9-month decline in prices from over $120 per barrel last June to trade below $65 per barrel (basis May) on Monday, including a ±$15 / $15,000 per contract fall from March 7, scarcely two weeks.


Natural gas basis its May futures contract tested 32-month lows yesterday, threatening to punch through $2.00 per million British thermal units (MMBtu). With the North American winter heating season approaching its end, residential, commercial, and industrial gas demand has been on the decline.


5f29f1c3 9928 42f7 8cf9 648a27f6e4fb

7e5a85e8 2911 4f09 a34d 2b5bdff3ba80


Plan your trade and trade your plan. 


Trading Futures, Options on Futures, and retail off-exchange foreign currency transactions involves substantial risk of loss and is not suitable for all investors.  You should carefully consider whether trading is suitable for you in light of your circumstances, knowledge, and financial resources. You may lose all or more of your initial investment. Opinions, market data, and recommendations are subject to change at any time when it comes to Futures Trading.

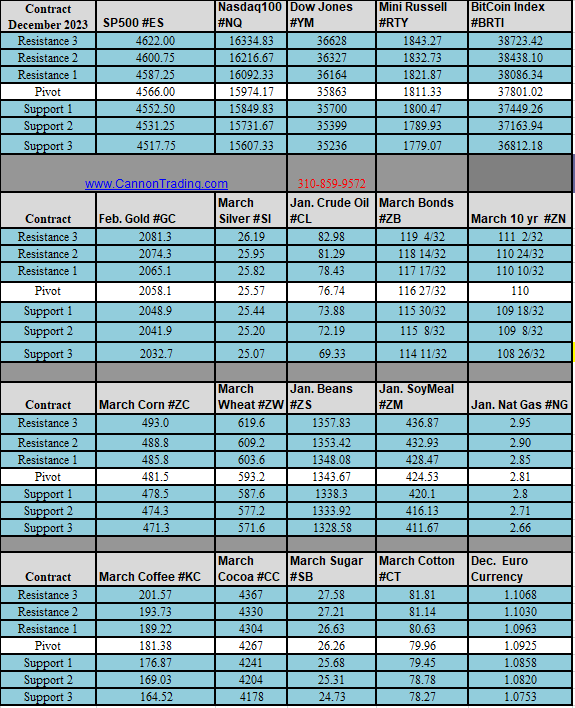
Futures Trading Levels

for 03-23-2023

#ES, #NQ, #YM, #RTY, #XBT, #GC, #SI, #CL, #ZB, #6E, #ZC, #ZW, #ZS, #ZM, #NG


3b644da2 2bee 4d39 8d98 5208a20bec39

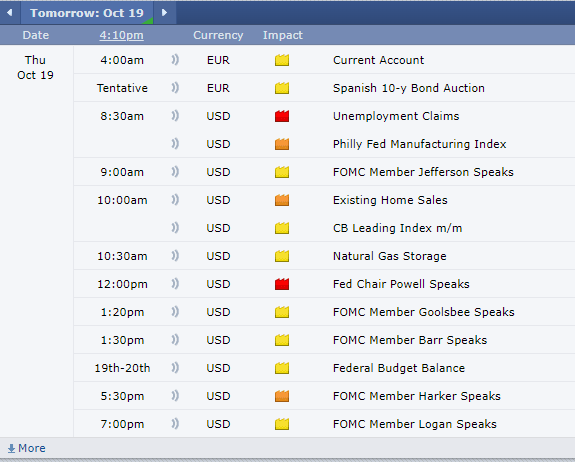
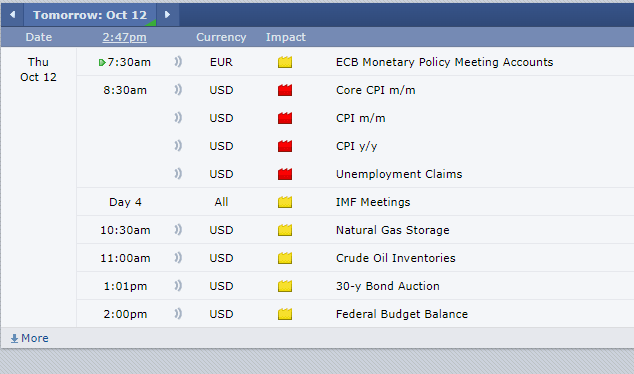
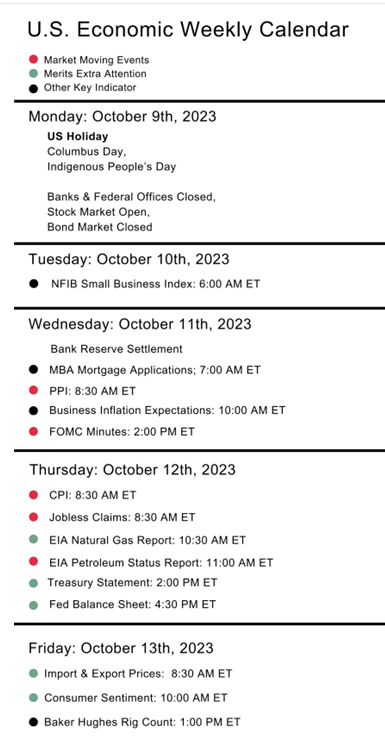
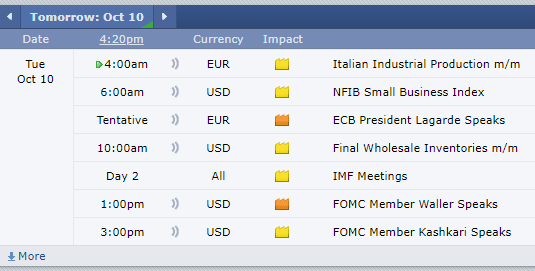
Economic Reports, Source: 

Forexfactory.com


333e2912 a11c 483f 9851 76975914ce07


This is not a solicitation of any order to buy or sell, but a current market view provided by Cannon Trading Inc. Any statement of facts here in contained are derived from sources believed to be reliable, but are not guaranteed as to accuracy, nor they purport to be complete. No responsibility is assumed with respect to any such statement or with respect to any expression of opinion herein contained. Readers are urged to exercise their own judgement in trading.

Weekly Newsletter: WTI Crude Futures Trading Challenge + Trading Levels 3.20.2023

Cannon Futures Weekly Newsletter Issue # 1138


Join our private Facebook group for additional insight into trading and the futures markets!

In this issue:

  • Important Notices – WTI Crude Futures Trading Challenge
  • Trading Resource of the Week – Live Breaking News Audio Service
  • Hot Market of the Week – April Gold
  • Broker’s Trading System of the Week
  • Trading Levels for Next Week
  • Trading Reports for Next Week


  • Important Notices – WTI Futures Trading Challenge

WTI Futures Trading Challenge
March 26-31, 2023
The global benchmark for crude oil is fabulous at 40
Take part in our special Trading Challenge to honor the 40th anniversary of WTI Crude Oil futures. Practice trading in a simulated environment with the most liquid crude oil futures benchmark in the world. Use our established, time-tested market with around-the-clock liquidity and global participation as you get to know our suite of WTI contracts in a risk-free environment that mimics live markets.
Learn why WTI has amassed worldwide interest
Have a gas as you explore WTI futures and simulate trading with the world’s most liquid oil contract. Receive daily education lessons from CME Group’s Owain Johnson, Managing Director of Research and Product Development. Gain valuable experience in a simulated environment while competing for a top spot.
Prizes for eligible participants
The top three finishers for this challenge will earn cash prizes. The top 40 finishers will also receive a complimentary copy of the recent book written by Owain Johnson, titled 40 Classic Crude Oil Trades.
This competition is open to residents in the United States (US), Canada (CA) excluding Quebec, *Brazil (BR), United Kingdom (UK), Germany (DE), Netherlands (NL), Switzerland (CH), Republic of Korea (KR), Taiwan (TW), and Japan (JP).
*Residents of Brazil must have a bank account in the United States to be eligible to receive a prize.


  • Trading Resource of the Week

  • Futures Market Squawk Box Features
  • Up to the second trading information
  • Informative streaming audio for accurate price and volume data
  • Firsthand knowledge that was once only available to floor traders
  • Expertise regarding buyers and sellers and how the market reacts
Hot market of the week is provided by QT Market Center, A swiss army knife charting package that’s not just for Hedgers, Cooperatives and Farmers alike but also for Spread traders, Swing traders and shorter time frame application for intraday traders with a unique proprietary indicator that can be applied to your specific trading needs.
PriceCounts – Not about where we’ve been , but where we might be going next!
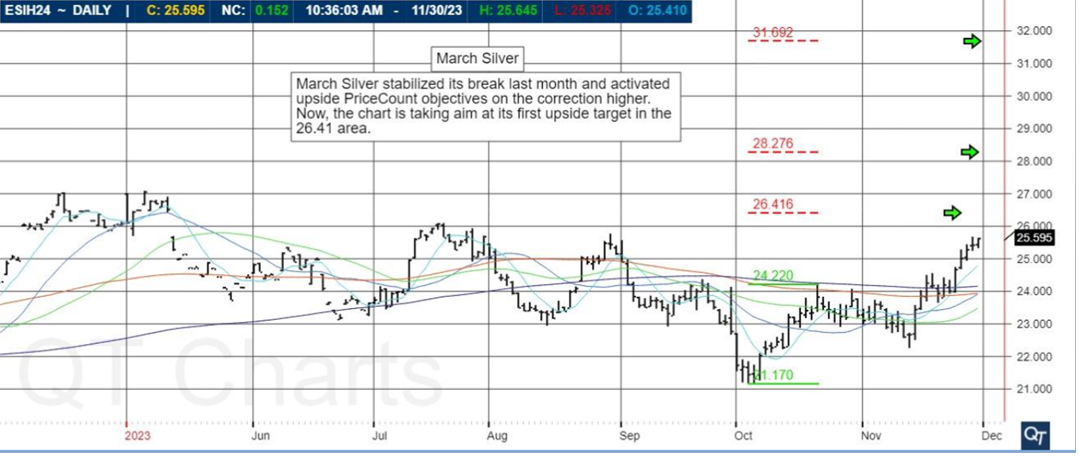
April Gold: April gold corrected after completing the first upside PriceCount objective in January now the chart is threatening to resume its rally where a sustained high would project a run to the second count in the 2052 area
April Gold, #GC
The PriceCount study is a tool that can help to project the distance of a move in price. The counts are not intended to be an ‘exact’ science but rather offer a target area for the four objectives which are based off the first leg of a move with each subsequent count having a smaller percentage of being achieved. It is normal for the chart to react by correcting or consolidating at an objective and then either resuming its move or reversing trend. Best utilized in conjunction with other technical tools, PriceCounts offer one more way to analyze charts and help to manage your positions and risk. Learn more at www.qtchartoftheday.com
Trading in futures, options, securities, derivatives or OTC products entails significant risks which must be understood prior to trading and may not be appropriate for all investors. Past performance of actual trades or strategies is not necessarily indicative of future results.
3b644da2 2bee 4d39 8d98 5208a20bec39
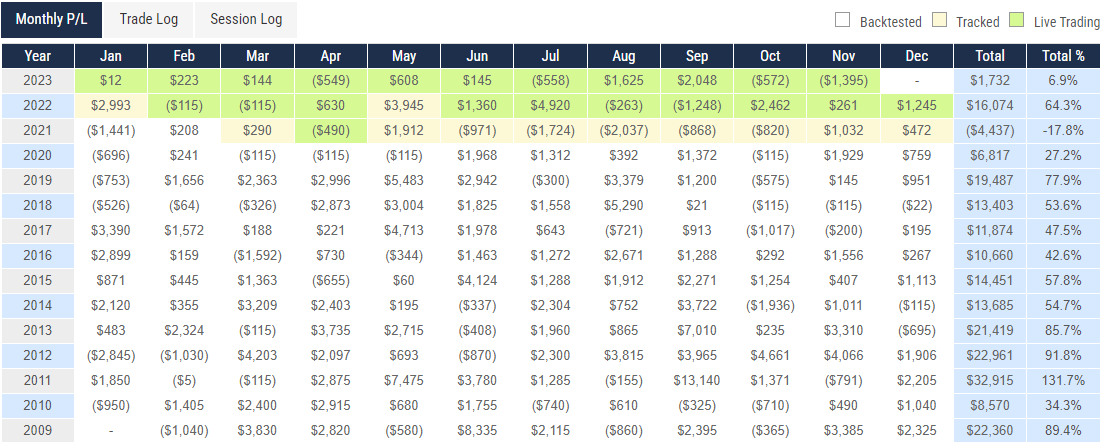
With algorithmic trading systems becoming more prevalent in portfolio diversification, the following system has been selected as the broker’s choice for this month.
PRODUCT
SYSTEM TYPE
Swing
Recommended Cannon Trading Starting Capital
$25,000
COST
USD 70 / monthly
c7dfcf51 533e 4cc5 b207 1c78a691c89f
The performance shown above is hypothetical in that the chart represents returns in a model account. The model account rises or falls by the average single contract profit and loss achieved by clients trading actual money pursuant to the listed system’s trading signals on the appropriate dates (client fills), or if no actual client profit or loss available – by the hypothetical single contract profit and loss of trades generated by the system’s trading signals on that day in real time (real‐time) less slippage, or if no real time profit or loss available – by the hypothetical single contract profit and loss of trades generated by running the system logic backwards on back adjusted data. Please read full disclaimer HERE.
Sign Up for a Free Personalized Consultation with a Broker from Cannon Trading Company
Questions about the markets? trading? platforms? technology? trading systems? Get answers with a complimentary, confidential consultation with a Cannon Trading Company series 3 broker.
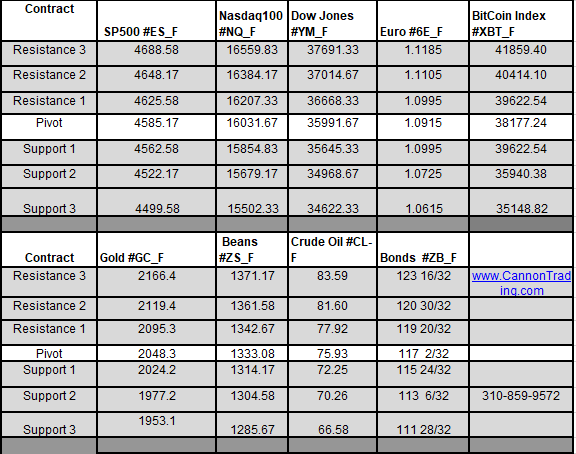
  • Trading Levels for Next Week

Daily Levels for March 20th, 2022
#ES, #NQ, #YM, #RTY, #XBT, #GC, #SI, #CL, #ZB, #6E, #ZC, #ZW, #ZS, #ZM, #NG

Weekly Levels

867b5377 4c3b 4788 979a 1cb8eda428f6


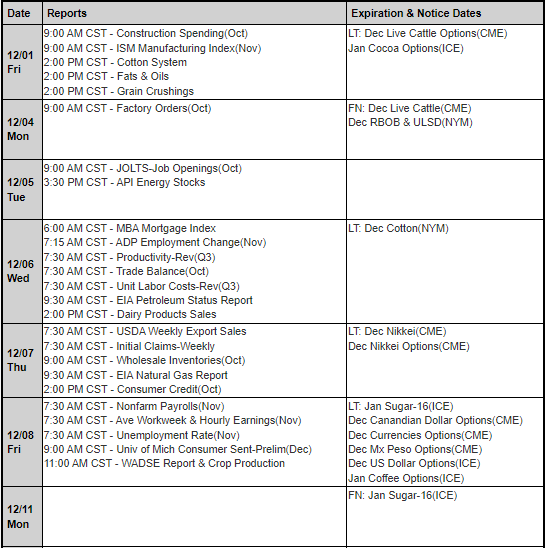
  • Trading Reports for Next Week

First Notice (FN), Last trading (LT) Days for the Week:
567ffcb2 2618 4274 ac96 47e938b6ce4c

This is not a solicitation of any order to buy or sell, but a current market view provided by Cannon Trading Inc. Any statement of facts herein contained are derived from sources believed to be reliable but are not guaranteed as to accuracy, nor they purport to be complete. No responsibility is assumed with respect to any such statement or with respect to any expression of opinion herein contained. Readers are urged to exercise their own judgment in trading

Weekly Newsletter #1134: Gold Outlook + President’s Day Schedule + Trading Levels 2.20.2023

Cannon Futures Weekly Newsletter Issue # 1134


Join our private Facebook group for additional insight into trading and the futures markets!

In this issue:

  • Important Updates: President’s Day Trading Schedule
  • Trading Resource of the Week – Measuring Your Trading Progress
  • Hot Market of the Week – Gold Futures
  • Trading Levels for Next Week
  • Trading Reports for Next Week


Presidents Day Futures Trading Schedule 2023
GLOBEX CME, ICE Presidents Day Futures Trading Schedule 2023
At some point in nearly everyone’s trading timelines, they wonder how their trading successes (or failures) compare with those of other traders. Wondering just how well you stack up to other traders in the industry is a natural curiosity and a human psychological tendency. However, actually knowing the success or failure rates of others doesn’t do a lot to move you farther down the road of where you want to be regarding trading success.
Most traders also wonder about the success rates of the “professional” traders—the ones who make their living solely by the profits they generate from trading. I will provide you with an answer to this question at the end of this feature.
Below are 10 questions regarding measuring your own trading progress and success. These questions should help you determine where you stand in this challenging field of endeavor.
1. What is trading “success?” This is a most basic question. Most would agree that ultimate trading success is defined as being profitable at trading—making more money than you lose. There are other secondary factors that also define success in trading, such as finding a “balance” between trading and other life activities. But it’s being profitable at trading that is the benchmark of defining success.
2. What is trading “progress?” Beginning traders should not expect to have immediate and ultimate success trading futures, stocks or FOREX markets. What they can expect in the early going is to make steady progress through gaining knowledge and experience. Even veteran successful traders continue to make trading progress. Achieving and maintaining trading success requires continual progress—namely continuing to seek out trading and market knowledge. Traders who truly enjoy the “progress” and process of trading do have a significant trading edge over those who do not enjoy learning and gaining experience.
3. At what point in my trading timeline should I expect trading “success?” Trading success (winning trades) can come right away—even for the beginning traders. What is less likely for the inexperienced traders is sustained trading success. Beginners can even run into a “hot streak” that skews the overall reality of trading. Immediate (and likely fleeting) success for a beginning futures trader can do longer-term psychological harm—if he or she does not fully recognize and understand the hard work and perseverance required on the road to trading success. Many times I get questions from less-experienced traders that go something like this: “I’ve been trading two years and I’ve only been able to about break even.” My reply to them is, “Hey, you should not be too discouraged with those results. Many traders don’t have that kind of success in the early going.”
368db221 6c82 4b49 9336 1ad2496cfaa4
Hot market of the week is provided by QT Market Center, A swiss army knife charting package that’s not just for Hedgers, Cooperatives and Farmers alike but also for Spread traders, Swing traders and shorter time frame application for intraday traders with a unique proprietary indicator that can be applied to your specific trading needs.
PriceCounts – Not about where we’ve been , but where we might be going next!
April Gold satisfied its first upside PriceCount objective last month and could not sustain further strength. Now, the chart has activated downside counts on the correction lower. The first objective projects a run to the 1797. It would take a trade below the November reactionary low to negate the remaining upside targets.
#GC
April Gold Futures Chart
The PriceCount study is a tool that can help to project the distance of a move in price. The counts are not intended to be an ‘exact’ science but rather offer a target area for the four objectives which are based off the first leg of a move with each subsequent count having a smaller percentage of being achieved. It is normal for the chart to react by correcting or consolidating at an objective and then either resuming its move or reversing trend. Best utilized in conjunction with other technical tools, PriceCounts offer one more way to analyze charts and help to manage your positions and risk. Learn more at www.qtchartoftheday.com
Trading in futures, options, securities, derivatives or OTC products entails significant risks which must be understood prior to trading and may not be appropriate for all investors. Past performance of actual trades or strategies is not necessarily indicative of future results.


3b644da2 2bee 4d39 8d98 5208a20bec39
Sign Up for a Free Personalized Consultation with a Broker from Cannon Trading Company
Questions about the markets? trading? platforms? technology? trading systems? Get answers with a complimentary, confidential consultation with a Cannon Trading Company series 3 broker.
  • Trading Levels for Next Week

Daily Levels for February 6th, 2022
#ES, #NQ, #YM, #RTY, #XBT, #GC, #SI, #CL, #ZB, #6E, #ZC, #ZW, #ZS, #ZM, #NG

Weekly Levels

3f2c6ad7 9dea 4758 a947 9f1b600e1f28


  • Trading Reports for Next Week

First Notice (FN), Last trading (LT) Days for the Week:
15046dc8 cc18 446e acd7 63fd2acc6028

This is not a solicitation of any order to buy or sell, but a current market view provided by Cannon Trading Inc. Any statement of facts herein contained are derived from sources believed to be reliable but are not guaranteed as to accuracy, nor they purport to be complete. No responsibility is assumed with respect to any such statement or with respect to any expression of opinion herein contained. Readers are urged to exercise their own judgment in trading

Finish the Week Strong! + Trading levels for 12.08.2022

Get Real Time updates and more on our private FB group!

What to Look for as we Finish the Trading Week

By Mark O’Brien, Senior Broker

Energy:

After starting the year near $72 per barrel, by June, West Texas crude oil (Jan. ’23 futures contract) climbed to its highs above $108 per barrel. Today, Jan. crude oil traded to an intraday low of $71.75, a ±$36 per barrel (±$36,000) leap and fall.

Not to be out don’t, after breaching $10.00 per million British thermal units in early August, natural gas traded below $5.34 intraday yesterday, a whopping ±46% cut in the asset’s value and a ±$46,000 move for a single futures contract (Jan. ’23 futures contract).

Metals:

Albeit experiencing a slight correction this week so far, gold (Feb. ’23 futures contract) managed to hold nearly all of its ±$170 rally through $1,800 per ounce off its multi-year lows of early November near $1,635 per ounce – a ±$17,000 move in one month.

Announcements:

Keep an eye on the calendar for important U.S. government reports this Friday, starting with the Labor Department’s release of its Producer Price Index showing the cost of wholesale goods and services. The reading reflects what companies pay for supplies such as grains, fuel, metals, lumber, packaging and so forth. This is a key inflation gauge in the midst of four-decade high wholesale prices. Release time: 7:30 A.M., Central Time.

Also on Friday, the USDA will release its Crop Production Report along with its World Supply/Demand report (likely the more critical). It’s delivered at 11:00 A.M., Central Time.

A Cannon broker will be able to assist, provide feedback and answer any questions.

Trading Futures, Options on Futures, and retail off-exchange foreign currency transactions involves substantial risk of loss and is not suitable for all investors.  You should carefully consider whether trading is suitable for you in light of your circumstances, knowledge, and financial resources. You may lose all or more of your initial investment. Opinions, market data, and recommendations are subject to change at any time when it comes to Futures Trading.

Futures Trading Levels

for 12-08-2022

3fa9828f 7fae 4a13 9eef b02cc91193e3
SP500 #ES_FNasdaq100 #NQ_FDow Jones #YM_FMini Russell #RTY_FBitCoin Index #BRTI SP500 Feb. Gold #GC_F March Silver #SI_F Jan. Crude Oil #CL-F March Bonds #ZB_F March 10 yr #ZN_F March Corn #ZC_F March Wheat #ZW_F March Beans #ZS_F March SoyMeal #ZM_F Jan. Nat Gas #NG_F March Coffee #KC_F March Cocoa #CC_F March Sugar #SB_F March Cotton #CT_F March Euro Currency


Economic Reports, Source: 

Forexfactory.com

682f3493 8cbd 4f03 a940 c604781c9db8

This is not a solicitation of any order to buy or sell, but a current market view provided by Cannon Trading Inc. Any statement of facts here in contained are derived from sources believed to be reliable, but are not guaranteed as to accuracy, nor they purport to be complete. No responsibility is assumed with respect to any such statement or with respect to any expression of opinion herein contained. Readers are urged to exercise their own judgement in trading.

Weekly Newsletter – Trading Resources and more! 12.05.2022

Cannon Futures Weekly Newsletter Issue # 1124


Join our private Facebook group for additional insight into trading and the futures markets!

In this issue:
  • Trading Resource of the Week
  • Hot Market of the Week
  • Broker’s Trading System of the Week
  • Trading Levels for Next Week
  • Trading Reports for Next Week


  • Trading Resource of the Week

If you traded recently while Powell was speaking, perhaps during a CPI report or even more so as NFP (non farm payrolls) numbers come out – YOU KNOW HOW IMPORTANT THESE NEWS ITEMS ARE!!
TRADETHENEWS.COM IS A SERVICE WHICH PROVIDES BREAKING NEWS VIA AUDIO AND TEXT. INSIGHT INTO HOW THE MARKET IS REACTING AND MANY OTHER VALUABLE TOOLS!
The First
To provide audio news squawks in 1998.
Entering our second decade of market
moving analysis.
Depth of Coverage
Professional analysts broadcasting 24 hrs
for American, European and
Asian markets.
Speed
Analyst teams are recognized
globally as the fastest source
for market intelligence.
Diverse Platform Offerings
Audio, text headlines, calendars and ability to ask questions to analysts live through platform.
Unbiased Insight
Completely independent – Unlike other services,
Trade The News is not backed by any trading firm.
Confidence
Extensive 10+ year proprietary databases
that allow analysts to back check news instantly to prevent errors.

  • Hot Market of the Week – Feb Gold

Hot market of the week is provided by QT Market Center, A swiss army knife charting package that’s not just for Hedgers, Cooperatives and Farmers alike but also for Spread traders, Swing traders and shorter time frame application for intraday traders with a unique proprietary indicator that can be applied to your specific trading needs.
PriceCounts – Not about where we’ve been , but where we might be going next!
78d37c69 f156 4e62 acf9 db8b2b473e96

The PriceCount study is a tool that can help to project the distance of a move in price. The counts are not intended to be an ‘exact’ science but rather offer a target area for the four objectives which are based off the first leg of a move with each subsequent count having a smaller percentage of being achieved. It is normal for the chart to react by correcting or consolidating at an objective and then either resuming its move or reversing trend. Best utilized in conjunction with other technical tools, PriceCounts offer one more way to analyze charts and help to manage your positions and risk. Learn more at www.qtchartoftheday.com
Trading in futures, options, securities, derivatives or OTC products entails significant risks which must be understood prior to trading and may not be appropriate for all investors. Past performance of actual trades or strategies is not necessarily indicative of future results.
  • Broker’s Trading System of the Week

With algorithmic trading systems becoming more prevalent in portfolio diversification, the following system has been selected as the broker’s choice for this month.
PRODUCT
SYSTEM TYPE
Intraday
Recommended Cannon Trading Starting Capital
$10,000
COST
USD 175 / monthly
05bcd7da b165 4f0c ae8e 5f1c1f75d472
The performance shown above is hypothetical in that the chart represents returns in a model account. The model account rises or falls by the average single contract profit and loss achieved by clients trading actual money pursuant to the listed system’s trading signals on the appropriate dates (client fills), or if no actual client profit or loss available – by the hypothetical single contract profit and loss of trades generated by the system’s trading signals on that day in real time (real‐time) less slippage, or if no real time profit or loss available – by the hypothetical single contract profit and loss of trades generated by running the system logic backwards on back adjusted data. Please read full disclaimer HERE.
Sign Up for a Free Personalized Consultation with a Broker from Cannon Trading Company
Questions about the markets? trading? platforms? technology? trading systems? Get answers with a complimentary, confidential consultation with a Cannon Trading Company series 3 broker.


  • Trading Levels for Next Week

Daily Levels for December 5th

3d7c78a3 8bdb 4152 8e75 6417ac878ed6

Weekly Levels

9dc14f72 86ec 4707 9701 762252119f67


  • Trading Reports for Next Week

First Notice (FN), Last trading (LT) Days for the Week:
64bca280 4cc0 47c2 bfa6 ea9baf49bafa

This is not a solicitation of any order to buy or sell, but a current market view provided by Cannon Trading Inc. Any statement of facts herein contained are derived from sources believed to be reliable but are not guaranteed as to accuracy, nor they purport to be complete. No responsibility is assumed with respect to any such statement or with respect to any expression of opinion herein contained. Readers are urged to exercise their own judgment in trading

Trading levels for 11.30.2022, Reports & More!

Get Real Time updates and more on our private FB group!

Start trading March grains, March silver, March bonds and other interest rates, February gold. First notice day is Wednesday.

Tomorrow is also the last trading day of the month – busy day with different reports and Fed’s Powell speaking..

A Cannon broker will be able to assist, provide feedback and answer any questions.

Trading Futures, Options on Futures, and retail off-exchange foreign currency transactions involves substantial risk of loss and is not suitable for all investors.  You should carefully consider whether trading is suitable for you in light of your circumstances, knowledge, and financial resources. You may lose all or more of your initial investment. Opinions, market data, and recommendations are subject to change at any time when it comes to Futures Trading.

Futures Trading Levels

for 11-30-2022

#goldfutures #sp500futures #crudeoilfutures # nasdaqfutures #dowfutures #futurestrading #futuresbrokers
SP500 #ES_FNasdaq100  #NQ_FDow Jones  #YM_FMini Russell #RTY_FBitCoin Index #BRTI SP500 Dec. Gold #GC_F Dec. Silver #SI_F Oct. Crude Oil #CL-F Dec. Bonds  #ZB_F Dec. 10 yr  #ZN_F Dec. Corn #ZC_F Dec.  Wheat #ZW_F Nov. Beans #ZS_F Dec. SoyMeal #ZM_F Oct. Nat Gas #NG_F Dec. Coffee #KC_F Dec. Cocoa #CC_F October Sugar #SB_F Dec. Cotton #CT_F Sept.  Euro Currency


Economic Reports, Source: 

Forexfactory.com

f7e3e62f 0168 4955 98fd b32bb83a977f

This is not a solicitation of any order to buy or sell, but a current market view provided by Cannon Trading Inc. Any statement of facts here in contained are derived from sources believed to be reliable, but are not guaranteed as to accuracy, nor they purport to be complete. No responsibility is assumed with respect to any such statement or with respect to any expression of opinion herein contained. Readers are urged to exercise their own judgement in trading.

Gold Looking For Attention + Trading levels for 11.15.2022

Get Real Time updates and more on our private FB group!

PPI final this week!

Gold may again be on the March.

By John Thorpe, Senior Broker

Recently we have had a bit of a breakout in the spot gold contract prices traded through our platforms and the CME/Nymex. The contract is a 100 troy oz deliverable contract GCZ22. There are also , smaller sized contracts, Micro’s MGCZ22 10 troy ounces and Mini’s QOZ22 50 troy ounces Financially settled.  These contracts offer not only a great day trading tool but also a wonderful way to control an interest in a tangible asset class. Much has been, currently is and will continue to be written about Gold as a hedge during times of uncertainty. How prices will move as an effect of whatever the cause will always be open for debate.

From Executive order 6102 signed in 1933, President Franklin Roosevelt forbid the hoarding of gold coin, bullion and certificates to the initiation of the gold standard from the 1944 Bretton Woods agreement, to Nixon’s “temporary” suspension of the dollar’s convertibility into gold in 1972, Global Governmental policy has often interceded in the convertibility of the U.S. Dollar and the value of gold in the past 100 + years. Wherever the price of gold has been or where it is currently headed, there is no doubt that it remains a valuable asset class of it’s own so it does bear to watch the price closely as it appears to be breaking from a long slumber.  In the short run I see Dec 22 and Feb 23 gold prices needing to test lower levels around 1738 1744 respectively, before this market, if a breakout is in the cards, will develop into a true upside breakout and in fact, will test multi year highs. Personally, I believe the fundamentals aren’t quite right for a big move from here, but the technical indicators certainly are screaming “look at me”, for now I will watch and wait.


Daily chart for your review below.

Plan your trade and trade your plan.

#GC; Daily Gold Futures Chart
Daily Gold Futures Chart

Trading Futures, Options on Futures, and retail off-exchange foreign currency transactions involves substantial risk of loss and is not suitable for all investors.  You should carefully consider whether trading is suitable for you in light of your circumstances, knowledge, and financial resources. You may lose all or more of your initial investment. Opinions, market data, and recommendations are subject to change at any time when it comes to Futures Trading.

Futures Trading Levels

for 11-15-2022

#goldfutures #sp500futures #crudeoilfutures # nasdaqfutures #dowfutures #futurestrading #futuresbrokers
SP500 #ES_FNasdaq100  #NQ_FDow Jones  #YM_FMini Russell #RTY_FBitCoin Index #BRTI SP500 Dec. Gold #GC_F Dec. Silver #SI_F Oct. Crude Oil #CL-F Dec. Bonds  #ZB_F Dec. 10 yr  #ZN_F Dec. Corn #ZC_F Dec.  Wheat #ZW_F Nov. Beans #ZS_F Dec. SoyMeal #ZM_F Oct. Nat Gas #NG_F Dec. Coffee #KC_F Dec. Cocoa #CC_F October Sugar #SB_F Dec. Cotton #CT_F Sept.  Euro Currency


Economic Reports, Source: 

Forexfactory.com

8da066cb 26da 494d 9616 73e27d7b8100

This is not a solicitation of any order to buy or sell, but a current market view provided by Cannon Trading Inc. Any statement of facts here in contained are derived from sources believed to be reliable, but are not guaranteed as to accuracy, nor they purport to be complete. No responsibility is assumed with respect to any such statement or with respect to any expression of opinion herein contained. Readers are urged to exercise their own judgement in trading.

How to Trade “Consolidation Patterns” + Futures Trading Levels 6.28.2022

Get Real Time updates and more on our private FB group!

How to Trade “Consolidation Patterns”

By John Thorpe, Senior Broker
There are a number of consolidation patterns: sideways ranges(rectangles), upward or downward sloping patterns or “flags” , triangular or Pennants. Today I have found on the Continuous Daily Comex Gold chart to illustrate, several recent rectangle consolidation patterns. One recent rectangular consolidation with a false breakout followed by a confirmed breakout and one that is currently forming. A Consolidation rectangle pattern has clearly defined ranges defined by highs and lows that can be connected drawing horizontal lines.
Continuous Daily Comex Gold chart
The above chart reflects just this. There are three points of interest outside the two rectangles, on the first one from March to April there is an upside break out but on light volume, Rule #1. Breakouts must occur on a closing basis on heavier than normal volume. You should not trade the breakout move on lighter volume. #2 wait for a retest of the previous resistance or support line. You will notice the high volume day after the breakout was on a failure of the retest. Good for you! a win, you didn’t fall for the breakout.
And #3, On April 29 had you worked a sell GTC limit order at or around the retest level of 1917,1918,1919.00 (which you could have placed as early as April 25th) you would be short the breakout . Soon after, a new consolidation zone is created and we are still currently inside. You can see two bars outside the consolidation but NOT on a closing basis.
In Summary, look for one of these patterns which are some of the most common, Look for a high volume breakout and don’t get in until the market retests the previous support or resistance area, and try to manage your stop loss orders within the old consolidation areas!!
Important: Trading commodity futures and options involves a substantial risk of loss.
The recommendations contained in this letter are of opinion only and do not guarantee any profits.
Past performances are not necessarily indicative of future result

Trading Futures, Options on Futures, and retail off-exchange foreign currency transactions involves substantial risk of loss and is not suitable for all investors.  You should carefully consider whether trading is suitable for you in light of your circumstances, knowledge, and financial resources. You may lose all or more of your initial investment. Opinions, market data, and recommendations are subject to change at any time when it comes to Futures Trading.

Futures Trading Levels

06-28-2022


Futures Support & Resistance Levels 6.28.2022


Improve Your Trading Skills

Get access to proprietary indicators and trading methods, consult with an experienced broker
 1-800-454-9572 Explore trading methods. Register Here


Economic Reports, Source: 

Forexfactory.com


5f2fd5d2 14e9 4ca1 81a1 4acc9526d11d


This is not a solicitation of any order to buy or sell, but a current market view provided by Cannon Trading Inc. Any statement of facts here in contained are derived from sources believed to be reliable, but are not guaranteed as to accuracy, nor they purport to be complete. No responsibility is assumed with respect to any such statement or with respect to any expression of opinion herein contained. Readers are urged to exercise their own judgement in trading.

Inflation & the Markets + Futures Support and Resistance Levels 5.10.2022

Get Real Time updates and more on our private FB group!

Inflation & the Commodity Markets

by John Thorpe, Senior Broker
There are a number of characterizations of inflation in the business press and social media some related to the speed of inflation as in Creeping Inflation or Moderate inflation even hyper inflation and may be used as adequate adjectives, but these don’t describe what the causes of inflation are of which there can be many.
This Wednesday , CPI or the Consumer Price Index will be published at 8:30 am EDT an often quoted measure of Inflation but not the one the FRB uses to guide interest rate decisions, they choose to focus on the PCE or the Personal Consumption Expenditures Price Index. The Market will focus on both. If you recall last month the CPI showed the largest monthly advance in 42 years. The consensus from Econoday.com is for an 8.1 % Rate, with a much smaller incremental increase than the previous tally. Heading into that number Gold prices had been rallying for 3 successive days and experienced a 20 dollar rally continuing the move and added an additional 2 days of inertia before the peak on April 18th and subsequent sell-off , nearly a month later the Gold market seemingly is telling us that the consensus for CPI will be correct as reflected in weaker gold prices. If you watch the gold market watch the reaction to CPI on Wednesday morning. If CPI is Higher than the consensus and gold rally’s and holds those gains into the 1:30 pm EDT zone, then the recent lows in my view are in.
As for the causes of inflation, today we are in what economists call Demand – Pull inflation. This is when the aggregate demand for goods and services in an economy exceeds the aggregate supply. This concept is associated with full employment when adjusting the supply of goods and services is either not possible, or difficult to achieve in a timely manner. Always have a plan to manage the risk in your trades before you employ your strategy, Plan your trade and Trade your plan
 If you have any questions please contact your broker!
Click on chart below for LARGER IMAGE – Gold Daily Chart
Gold Futures Daily Chart

Trading Futures, Options on Futures, and retail off-exchange foreign currency transactions involves substantial risk of loss and is not suitable for all investors.  You should carefully consider whether trading is suitable for you in light of your circumstances, knowledge, and financial resources. You may lose all or more of your initial investment. Opinions, market data, and recommendations are subject to change at any time when it comes to Futures Trading.

Futures Trading Levels

05-10-2022

Futures Support and Resistance Levels 5.10.2022


Improve Your Trading Skills

Get access to proprietary indicators and trading methods, consult with an experienced broker
 1-800-454-9572 Explore trading methods. Register Here


Economic Reports, Source: 

Forexfactory.com

ForexFactory.com 5.10.2022


This is not a solicitation of any order to buy or sell, but a current market view provided by Cannon Trading Inc. Any statement of facts here in contained are derived from sources believed to be reliable, but are not guaranteed as to accuracy, nor they purport to be complete. No responsibility is assumed with respect to any such statement or with respect to any expression of opinion herein contained. Readers are urged to exercise their own judgement in trading.

Gold Watch (Outlook), FOMC & Support and Resistance Levels 5.04.2022

Get Real Time updates and more on our private FB group!

Gold Watch Part 3

By John Thorpe, Senior Broker
Two weeks ago I highlighted the high of the move as a turning point for the yellow metal in the short term when the market achieved a $2003.00 per ounce daily high .
However, on that day the market closed at $1982.00 a troy ounce, a $20.00 plus dollar retracement off the high , I also noted that the 1920.00 area would be a support zone and that those that intended to go long should use a retracement back to that price level as an area to go long, to risk less by employing a risk strategy underneath 1920.0 per ounce.
Kudos for those that did as not only was this important area breached to the downside on April 25th but April 29th, as the market tested this number again and could not hold this level.1920.00 proved to be a very strong area for this market as the intraday trade hit this price ceiling, failed and closed near the lows at 1896.90.
Had we closed near 1900 today we would again, be off to test the 1920.00 area this week. That was not to be. This market is falling back into the “comfort zone” of the range from the last year of 1900.00 to 1740.00. With the Fed announcing an expected 2 basis point hike this week on Wednesday at 2:00 EDT, I have a theory:
I expect this current price discounting in the gold to temporarily rally hard moments after the Fed release only to sell off at the strength in the US Dollar as a result. It will be interesting to see if my theory works or not.
This should create an opportunity ( AND RISK!!) to sell the gold for a short term , hi volume break down into the low 1800’s. with your risk management technique employed above the 1900.00 area. Inflation is here and from an investment standpoint, because equities and bonds are both weak, (not since the early 80’s have we seen this combination) cash (by way of the US Dollar) is king in the short run.
I rarely recommend using more than 30% of your margin on any single idea and recommend a risk management strategy using, either stops, Options, spreads but prefer not to use the “free hand to click to get out” approach.
Use your disciplines and you will survive to trade another day.
The following are my PERSONAL suggestions on trading during FOMC days:
 1.)  Reduce trading size
2.) Be extra picky = no trade is better than a bad trade
 3.)  Choose entry points wisely.   Look at longer time frame support and resistance for entry. Example, trader x looking to go long the mini–SP at 4325.00 with a stop at 4319.00, instead “stretch the price bands” due to volatility and place an entry order to buy at 4319.75 and place a stop $250.00 to $500.00 below in this hypothetical example (consider current volatility along with support and resistance levels).
Expect the higher volatility during, right after and during  the news conference 30 minutes after the announcement. Expect to see some “vacuum” (low volume, big zigzags) right before the number.
·    Consider using automated stops and limits attached to your entry order as the market can move very fast at times.
 Keep in mind statement comes out at 1 Pm Central time, the news conference which dissects the language comes out 30 minutes later so the volatility window stretches out.
Gold Daily Chart for your Review. Click for LARGER IMAGE
Gold Futures Daily Chart

Trading Futures, Options on Futures, and retail off-exchange foreign currency transactions involves substantial risk of loss and is not suitable for all investors.  You should carefully consider whether trading is suitable for you in light of your circumstances, knowledge, and financial resources. You may lose all or more of your initial investment. Opinions, market data, and recommendations are subject to change at any time when it comes to Futures Trading.

Futures Trading Levels

05-04-2022


Futures Support and Resistance Levels 5.04.2022


Improve Your Trading Skills

Get access to proprietary indicators and trading methods, consult with an experienced broker
 1-800-454-9572 Explore trading methods. Register Here


Economic Reports, Source: 

Forexfactory.com

b7897abc 3be4 47ab 8e08 d1ef2dce29ef


This is not a solicitation of any order to buy or sell, but a current market view provided by Cannon Trading Inc. Any statement of facts here in contained are derived from sources believed to be reliable, but are not guaranteed as to accuracy, nor they purport to be complete. No responsibility is assumed with respect to any such statement or with respect to any expression of opinion herein contained. Readers are urged to exercise their own judgement in trading.