VIX Stock Index Trading Signals & Support and Resistance Levels 7.22.2021

Dear Traders,

Like us on FaceBook!
Get Real Time updates and more on our private FB group!

VIX Stock Index Trading Signals

by Gabe Velazquez of www.TransparentTradingSolutions.com. For free trial to the room and more information, contact your broker.
Over the last several months, two of the major stock averages (the S&P 500 and Nasdaq 100) have been on a relentless upward trajectory. This has occurred as the VIX (S&P 500 Volatility Index) has remained elevated relative to its historical levels. In past bull markets, the VIX (which many refer to as the fear gauge) has traded in the low teens and even dropped to single digit readings during strong advances in the stock market. So why is this time different? More importantly, can we use the VIX to increase our odds of timing long and short entries in the S&P 500 and Nasdaq futures? I believe the answer is yes.
First, A quick definition of the VIX: It is an index that measures the premium of at-the-money Calls and Puts on the Cash S&P 500 going out one month in duration. Some market participants utilize options (because of their leverage component) to hedge long only portfolios. For that reason, when the stocks come under pressure, the demand for this protection increases and thus premiums (the cost to buy options) increases. Simply, there is an inverse correlation between the VIX index and stocks. As stocks drop, the VIX will rise and vice-versa.
Now that we have a better understanding of how the VIX works, let’s look at a 4 hour chart going back 2 months. In it, we can see that it has formed a clearly defined range between 15 on the lower band and 21 on the high extremity. If you look at a chart of the S&P 500 futures you will notice that on every corrective (drop) in this index over the last 2 months, the VIX has rallied up to 21. Additionally, note that when the VIX fails to move above this level, the ES (S&P 500 futures) stops falling and usually finds buyers. Conversely, when stocks advance, and the VIX stays above 15, stocks generally pause or struggle to have any meaningful move higher.
VIX article 7 14 21 1
ES article 7 14 21
Of course, this range will not persist indefinitely, as these patterns never do. However, I believe we can glean useful information from this environment. Can we surmise that a break above the recent range in the VIX implies more selling (bearish) implications? Separately, a break below the key 15 level may insinuate that institutional investors feel more comfortable lifting their hedges, thus leaving more room for stocks to rally in the short-term.
We can never rely on one single indicator to buy or sell, but as traders, we always need to seek an edge. Perhaps this can give you a different way to look at the markets. More importantly, by monitoring the VIX relative to what options traders and institutions are doing to hedge their portfolios, my hope is that it can help you make better trading decisions.
Until next time, I hope everyone has a great trading week.
Gabe
This is not a solicitation of any order to buy or sell, but a current market view provided by Cannon Trading Inc. Any statement of facts here in contained are derived from sources believed to be reliable, but are not guaranteed as to accuracy, nor they purport to be complete. No responsibility is assumed with respect to any such statement or with respect to any expression of opinion herein contained. Readers are urged to exercise their own judgement in trading.
Trading Futures, Options on Futures, and retail off-exchange foreign currency transactions involves substantial risk of loss and is not suitable for all investors. You should carefully consider whether trading is suitable for you in light of your circumstances, knowledge, and financial resources. You may lose all or more of your initial investment. Opinions, market data, and recommendations are subject to change at any time when it comes to Futures Trading.

Good Trading

Trading Futures, Options on Futures, and retail off-exchange foreign currency transactions involves substantial risk of loss and is not suitable for all investors.  You should carefully consider whether trading is suitable for you in light of your circumstances, knowledge, and financial resources. You may lose all or more of your initial investment. Opinions, market data, and recommendations are subject to change at any time when it comes to Futures Trading.


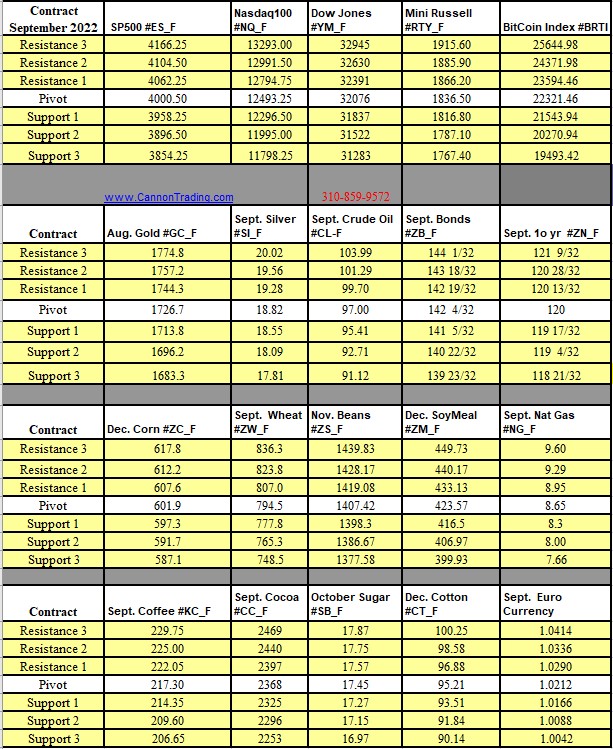
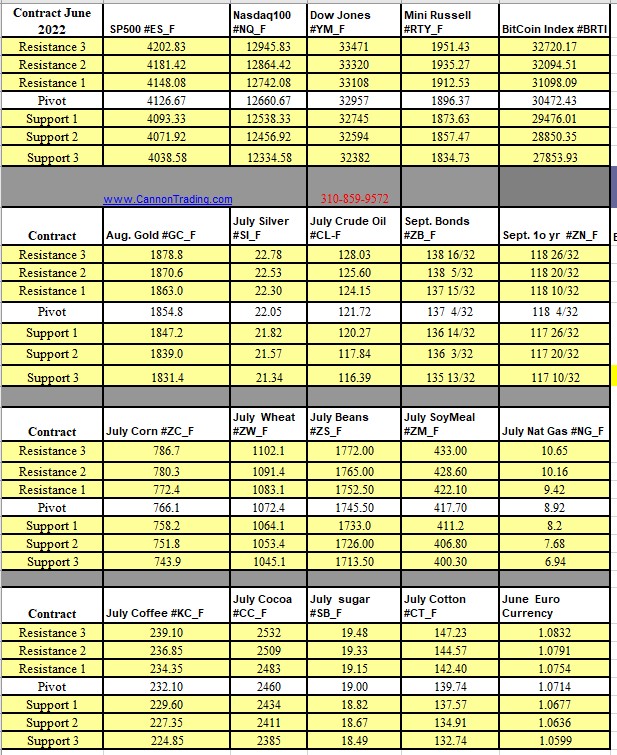
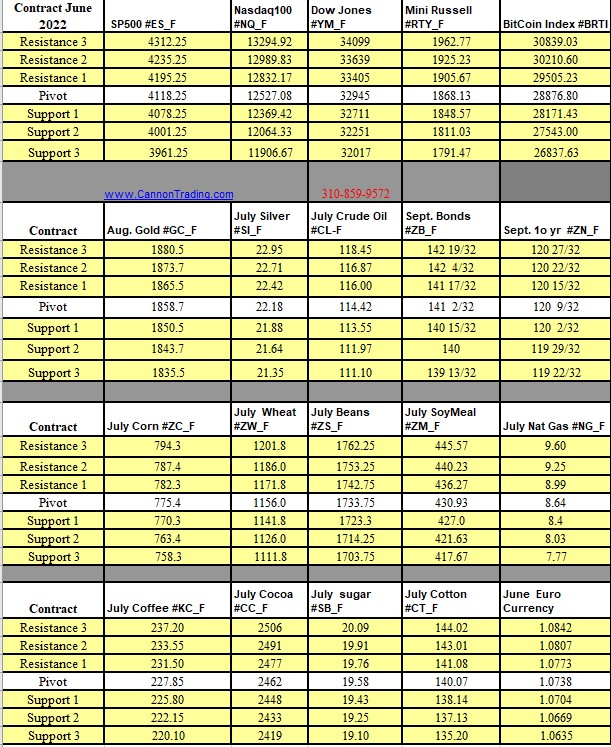
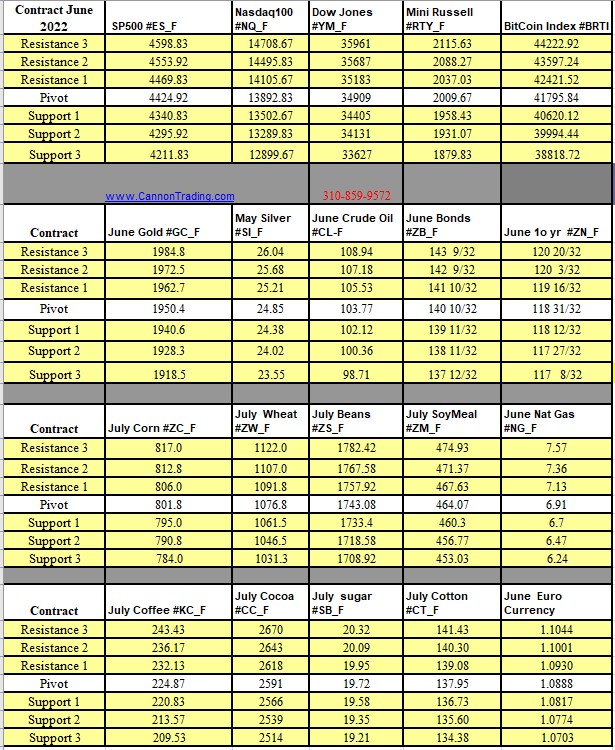
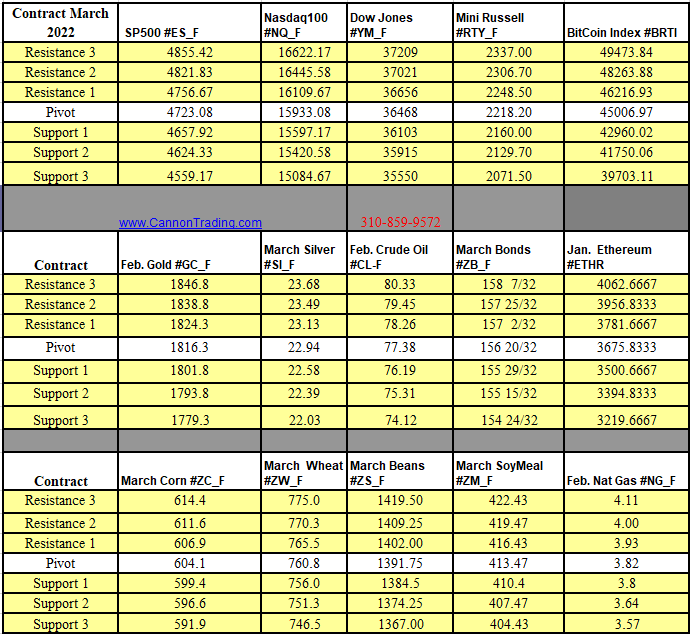
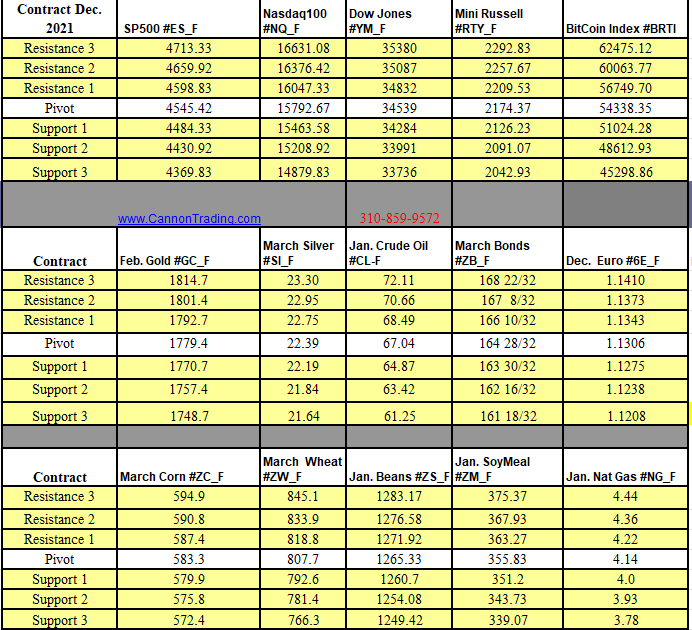
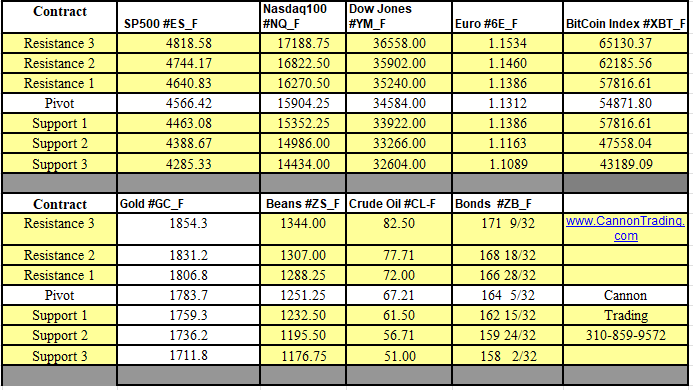
Futures Trading Levels

7-22-2021

5aef0d6e c47e 4dd2 8add d91c1c59e511

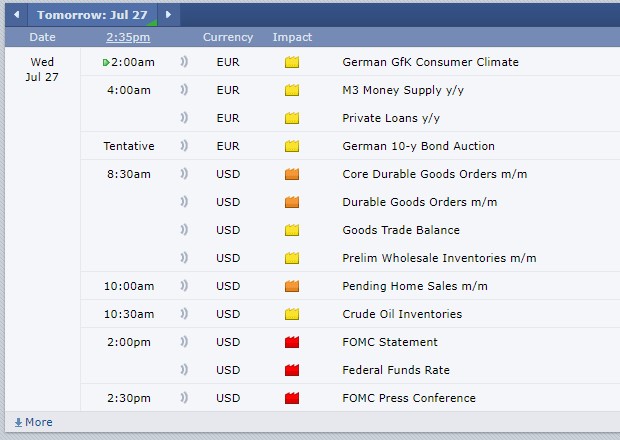
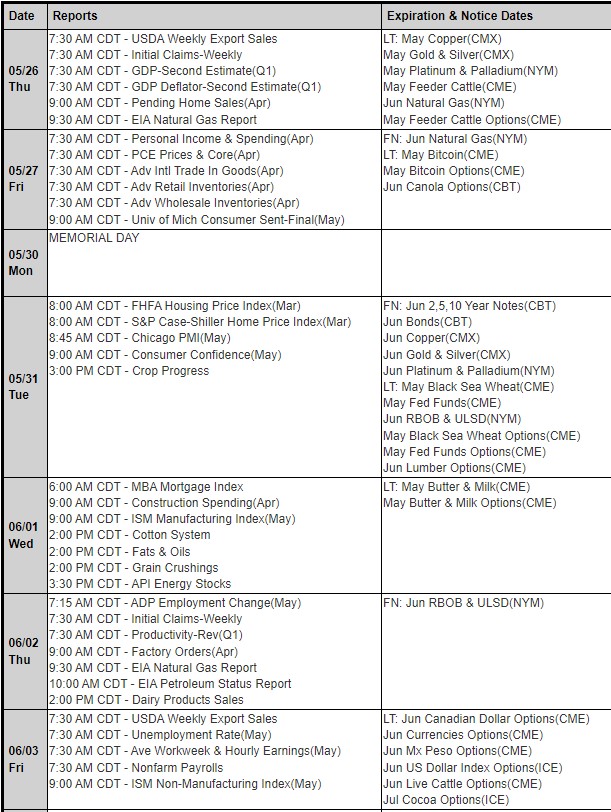
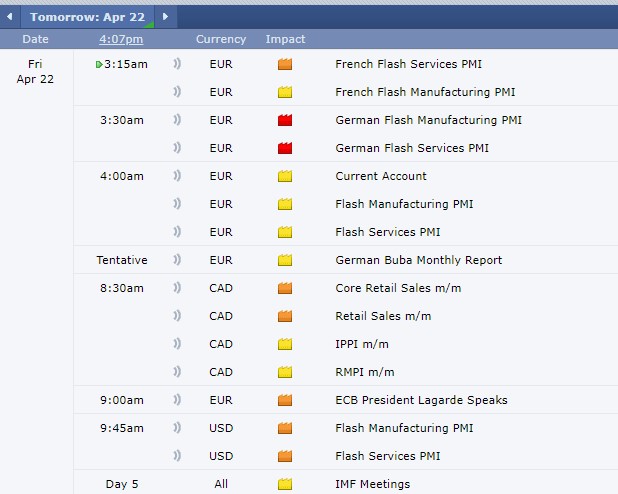
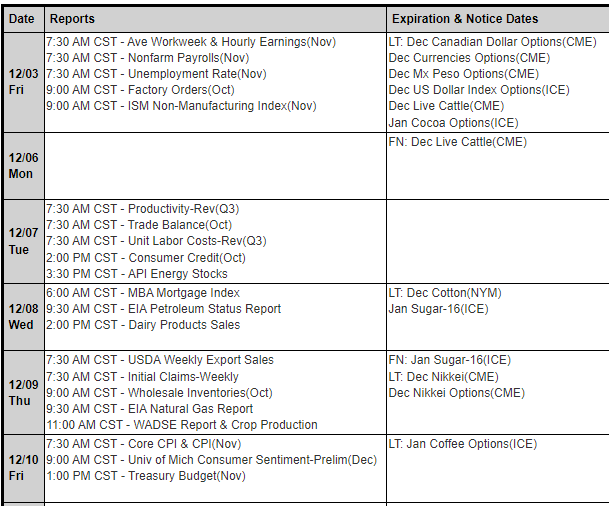
Economic Reports, source: 

 www.BetterTrader.co

58cfbbf1 d174 4eb7 a96c 79fb635a0d37

This is not a solicitation of any order to buy or sell, but a current market view provided by Cannon Trading Inc. Any statement of facts herein contained are derived from sources believed to be reliable but are not guaranteed as to the accuracy, nor they purport to be complete. No responsibility is assumed with respect to any such statement or with respect to any expression of opinion herein contained. Readers are urged to exercise their own judgment in trading.

Mini Russell Chart Review & Support and Resistance Levels 7.21.2021

Dear Traders,

Like us on FaceBook!
Get Real Time updates and more on our private FB group!
What happened from one day to the next??
After a large sell off yesterday, stock index futures bounced sharply today….
I wish I REALLY knew…..However, a mentor of mine once told me that in situations like this, the 3rd day action is critical to watch and see if the market really holds and a temporary bottom is in or if the sell off resumes.
4 hour chart of the RTY for your review below.
c510b54c 21ee 4631 81f1 45f75d1c74c2

Good Trading

Trading Futures, Options on Futures, and retail off-exchange foreign currency transactions involves substantial risk of loss and is not suitable for all investors.  You should carefully consider whether trading is suitable for you in light of your circumstances, knowledge, and financial resources. You may lose all or more of your initial investment. Opinions, market data, and recommendations are subject to change at any time when it comes to Futures Trading.


Futures Trading Levels

7-21-2021

7eef3c3f ed34 4163 98d3 8d3d0be02a82

Economic Reports, source: 

 www.BetterTrader.co

5ccad94f a0fd 44fe 97d6 37b57212a6b9

This is not a solicitation of any order to buy or sell, but a current market view provided by Cannon Trading Inc. Any statement of facts herein contained are derived from sources believed to be reliable but are not guaranteed as to the accuracy, nor they purport to be complete. No responsibility is assumed with respect to any such statement or with respect to any expression of opinion herein contained. Readers are urged to exercise their own judgment in trading.

Weekly Newsletter #1046 Commitment of Traders Report PDF., ES Market Review & Trading Levels 4.10.2021

Cannon Futures Weekly Newsletter Issue # 1046

Dear Traders,

Like us on FaceBook!
Get Real Time updates and market alerts on Twitter!
Get Real Time updates and more on our private FB group!
Trading 102: Commitment of Traders Report – What Lies beneath
Commitment of Traders Report – COT
Commitment of Traders Report offers wealth of data when it comes to commodity and futures trading. You can somewhat say, this is a window into what the “big boys are doing” which is published weekly.
In this 24 page PDF booklet, Gary Kamen of Trends in Futures reviews the commitment of traders report, what it means, how traders can utilize it and much more.
Sign up and instantly download the booklet and learn about:
* History of the COT report
* Why is this report important?
* The new COT report
* How can you use the information in this report?
* And much more….
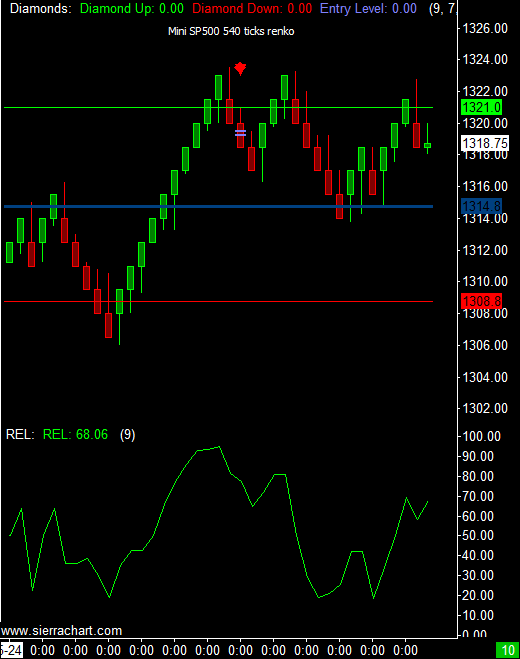
ES WEEKLY chart for your review. Click for larger image. New all time highs fueled by FED QE.
Next targets? Levels of support? will this past week slow price action continue or will the “speedy price action ” of weeks before return?
M S&P’s ( June mini SP 500)
4,101 OBJECTIVE has been met.
Market could have a retracement back
to 4075.00.
Next test area is 4145.00
No two Bull or Bear markets are alike. This pandemic is similar to 1918 (post WW1), which originated in China, unfortunately killing 50 million globally. The pent up demand led to the Roaring 20’s, which is the cycle we’re presently in. With the FED all in with unprecedented stimulus, we could see a 8-9% GDP number!
Q.E. is $120 billion a month, coupled
with the 3 stimulus packages and the new $2.2 trillion infrastructure in the pipeline. Also, the FED is allowing inflation to run hot, above their 2% target, using a weak US$, as its main catalyst. Lastly, the SHORT END may remain untouched for 2 years.
Eventually, the FED will lose control of the LONG END of the curve!
Future CAVEAT, is that we all know how the Roaring 20’s ended on Oct. 29, 1929.
Mini S&P ES Weekly Chart
Good Trading

Trading Futures, Options on Futures, and retail off-exchange foreign currency transactions involves substantial risk of loss and is not suitable for all investors.  You should carefully consider whether trading is suitable for you in light of your circumstances, knowledge, and financial resources. You may lose all or more of your initial investment. Opinions, market data, and recommendations are subject to change at any time when it comes to Futures Trading.


Futures Trading Levels

4-12-2021

f65e52f0 dcbf 4eda 836f 2f682f64548d


Weekly Levels

37d7c356 b311 4c3d bbce 1be38c1d9725

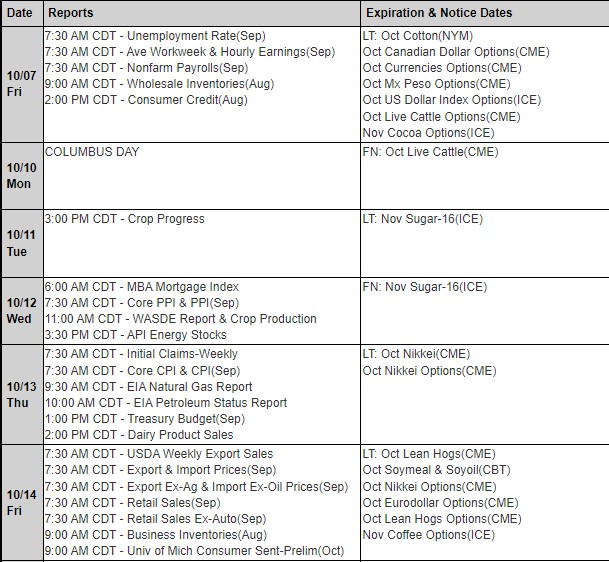
Reports, First Notice (FN), Last trading (LT) Days for the Week:

https://mrci.com

Date Reports/Expiration Notice Dates

MRCI Reports

This is not a solicitation of any order to buy or sell, but a current market view provided by Cannon Trading Inc. Any statement of facts herein contained are derived from sources believed to be reliable but are not guaranteed as to accuracy, nor they purport to be complete. No responsibility is assumed with respect to any such statement or with respect to any expression of opinion herein contained. Readers are urged to exercise their own judgment in trading

Rollover Indices/ Currencies/ Financials, FOMC Tomorrow & Support and Resistance Levels 3.16.2021

_________________________________________________

Voted #1 Blog and #1 Brokerage Services on TraderPlanet for 2016!!  

_________________________________________________

Dear Traders,

Like us on FaceBook!
Get Real Time updates and market alerts on Twitter!
It’s that time of the year where June contract is the front month for all stock indices/ currencies/ financials and other markets!
Rollover!!
Tomorrow we have FOMC.
Normally the volatility is around the actual rate cut/increase….This time it is 99.99% of no change. Language in the statement will be the main feature.
However, FOMC days do have unique behavior and this time my guess is, it will be around the language used after the announcement.
The following are my PERSONAL suggestions on trading during FOMC days:
·    Reduce trading size
·    Be extra picky = no trade is better than a bad trade
·    Choose entry points wisely. Look at longer time frame support and resistance for entry. Take the approach of entering at points where you normally would have placed protective stops. Example, trader x looking to go long the mini SP at 3925.00 with a stop at 3919.00, instead “stretch the price bands” due to volatility and place an entry order to buy at 3919.75 and place a stop a few points below in this hypothetical example ( consider current volatility along with support and resistance levels).
·    Expect the higher volatility during and right after the announcement
·    Expect to see some “vacuum” ( low volume, big zigzags) right before the number.
·    Consider using automated stops and limits attached to your entry order as the market can move very fast at times.
·    Keep in mind statement comes out at 1 Pm Central time, the news conference which dissects the language comes out 30 minutes later so the volatility window stretches out.
·    Know what the market was expecting, learn what came out and observe market reaction for clues
·    Be patient and be disciplined
·    If in doubt, stay out!!

Good Trading

Trading Futures, Options on Futures, and retail off-exchange foreign currency transactions involves substantial risk of loss and is not suitable for all investors.  You should carefully consider whether trading is suitable for you in light of your circumstances, knowledge, and financial resources. You may lose all or more of your initial investment. Opinions, market data, and recommendations are subject to change at any time when it comes to Futures Trading.


Futures Trading Levels

3-17-2021

5ccff016 9e6e 49a4 bb48 004bd5c43fad

Economic Reports, source: 

 www.BetterTrader.co

c3061570 921e 47c0 abbb 418d655c1d86

This is not a solicitation of any order to buy or sell, but a current market view provided by Cannon Trading Inc. Any statement of facts here in contained are derived from sources believed to be reliable, but are not guaranteed as to accuracy, nor they purport to be complete. No responsibility is assumed with respect to any such statement or with respect to any expression of opinion herein contained. Readers are urged to exercise their own judgement in trading.

Volatility Continues, ES Chart Review & Support and Resistance Levels 3.04.2021

_________________________________________________

Voted #1 Blog and #1 Brokerage Services on TraderPlanet for 2016!!  

_________________________________________________

Dear Traders,

Like us on FaceBook!
Get Real Time updates and market alerts on Twitter!
Volatility continues. Rates are the driving force now days.
June is now the front month for rates.
May is front month for silver, copper and most grains.
April crude and natural gas. OPEC meeting tomorrow!
Get Real Time updates and more on our private FB group!
Hourly chart of the ES below for your review along with potential levels of support and resistance.
Mini S&P ES Futures 60 minute chart

Good Trading

Trading Futures, Options on Futures, and retail off-exchange foreign currency transactions involves substantial risk of loss and is not suitable for all investors.  You should carefully consider whether trading is suitable for you in light of your circumstances, knowledge, and financial resources. You may lose all or more of your initial investment. Opinions, market data, and recommendations are subject to change at any time when it comes to Futures Trading.


Futures Trading Levels

3-04-2021

Futures Trading Levels 3.04.2021

Economic Reports, source: 

 www.BetterTrader.co

e4d3afc1 6136 4b7e a6f7 ddb032a49be6


This is not a solicitation of any order to buy or sell, but a current market view provided by Cannon Trading Inc. Any statement of facts here in contained are derived from sources believed to be reliable, but are not guaranteed as to accuracy, nor they purport to be complete. No responsibility is assumed with respect to any such statement or with respect to any expression of opinion herein contained. Readers are urged to exercise their own judgement in trading.

Why Use Tick & Volume Charts, Mini NQ Review and Support & Resistance Levels 2.23.2021

_________________________________________________

Voted #1 Blog and #1 Brokerage Services on TraderPlanet for 2016!!  

_________________________________________________

Dear Traders,

Like us on FaceBook!
Get Real Time updates and market alerts on Twitter!
Why I like to use tick and volume charts for scalping
Today I decided to touch more on an educational feature rather than provide a certain market outlook.
Many of my clients and blog readers know that when it comes to short term trading I am a fan of using volume charts, tick charts, range bar charts and Renko charts rather than the traditional time charts like the 1 minutes, 5 minutes etc.
My rule of thumb is that if you as a trader make decisions based on charts that are less than 15 minutes time frame, it may be worth your time to research, back test and do some homework as to potentially using other type of charts like volume charts , Range charts etc.
Volume charts will draw a new bar once a user defined number of contracts traded. Example mini SP 10,000 volume chart will draw a new bar once 10,000 contracts traded.
Range bar charts will draw new charts once price action has exceeded a user pre define price or ticks range. Example might be an 18 ticks range bar chart on crude oil.
While the volume charts rely ONLY on volume, the range bar charts rely ONLY on price action.
Their main advantage over traditional time charts is twofold in my opinion:
1. If the market is moving fast, reports came out or there is heavy volume in the market, the traditional 5 minute chart will need 5 minutes to complete the next bar before it provides you with a signal…if you day traded futures before you will know what 5 minutes can do….The volume charts or range bar charts in this case will complete the bars MUCH faster because there is strong price action and strong volume and will be able to provide a signal faster than the time charts.
2. On the flip side, there are times when the market is dead…low volume, sideways, choppy action. If you are using the 3 minute chart and a moving avg. cross over, you may get a signal simple because time has passed and the moving averages crossed even though the market is pretty dead….If you are using a volume chart and the market is slow…it will take a while for the bars to complete and hence it may filter out some “noise” in the market.
Below is a 5,000 CVB ( constant volume Bar) of the NQ. If you like a free trial to the “turning points indicators” highlighted in the charts below or to discuss more in depth different charts and strategies, feel free to visit us!
Mini NQ Volume Bar Chart
Mini Nasdaq Futures Volume Bar Chart

Good Trading

Trading Futures, Options on Futures, and retail off-exchange foreign currency transactions involves substantial risk of loss and is not suitable for all investors.  You should carefully consider whether trading is suitable for you in light of your circumstances, knowledge, and financial resources. You may lose all or more of your initial investment. Opinions, market data, and recommendations are subject to change at any time when it comes to Futures Trading.


Futures Trading Levels

2-24-2021

f4b7cc34 1ecb 4b52 b324 fcd3fd525f35

Economic Reports, source: 

 www.BetterTrader.co

90c5d5aa 63c4 42e3 a44f f644d66c5805


This is not a solicitation of any order to buy or sell, but a current market view provided by Cannon Trading Inc. Any statement of facts here in contained are derived from sources believed to be reliable, but are not guaranteed as to accuracy, nor they purport to be complete. No responsibility is assumed with respect to any such statement or with respect to any expression of opinion herein contained. Readers are urged to exercise their own judgement in trading.

Weekly Dow Jones Futures Chart and Support and Resistance Levels 12.30.2020

_________________________________________________

Voted #1 Blog and #1 Brokerage Services on TraderPlanet for 2016!!  

_________________________________________________

Dear Traders,

Like us on FaceBook!
Get Real Time updates and market alerts on Twitter!
Two more trading days left in 2020!!
Thank you for choosing Cannon during this challenging year. We look forward to continuing to provide you with excellent service in 2021 and wish you a healthy, successful year ahead!
New Years Holiday Futures Trading Schedule 2020 CME GLOBEX
Weekly Dow Jones Cash Index with possible upside target as well as support level below. Keep in mind this is a WEEKLY chart.
Dow Jones Futures Emini MICRO Futures

Good Trading

Trading Futures, Options on Futures, and retail off-exchange foreign currency transactions involves substantial risk of loss and is not suitable for all investors.  You should carefully consider whether trading is suitable for you in light of your circumstances, knowledge, and financial resources. You may lose all or more of your initial investment. Opinions, market data, and recommendations are subject to change at any time when it comes to Futures Trading.


Futures Trading Levels

12-30-2020

Futures Support & Resistance Levels 12.30.2020

Economic Reports, source: 

 www.BetterTrader.co

BetterTrader Futures Reports


This is not a solicitation of any order to buy or sell, but a current market view provided by Cannon Trading Inc. Any statement of facts here in contained are derived from sources believed to be reliable, but are not guaranteed as to accuracy, nor they purport to be complete. No responsibility is assumed with respect to any such statement or with respect to any expression of opinion herein contained. Readers are urged to exercise their own judgement in trading.

Rollover Notice for Stock Index Futures & Futures Levels 6.13.2019

____________________________________________________________________

Voted #1 Blog and #1 Brokerage Services on TraderPlanet for 2016!!  

____________________________________________________________________

Dear Traders,

Like us on FaceBook!
Get Real Time updates and market alerts on Twitter!
Rollover Notice for Stock Index Futures
Important notice: For those of you trading any stock index futures contracts, i.e., the E-mini S&P, E-mini NASDAQ, E-mini Dow Jones etc., it is extremely important to remember that we are now rolling over and trading the September 2019 contract.
Starting June 13th, the September 2019 futures contracts will be the front month contracts. It is recommended that all new positions be placed in the September 2019 contract as of June 13th.
Volume in the June 2019 contracts will begin to drop off until its expiration on Friday June 21st.
The month code for September is U19
In between, 30 min chart of the mini NASDAQ for your review below, on the short term, market can decline some more if we stay below the 7500 level.
a1955f8e ad6d 4b27 aba9 a40afcfb7a28
bdf6db09 7692 48a4 8450 9a8d7d5f2d31

Good Trading

Trading Futures, Options on Futures, and retail off-exchange foreign currency transactions involves substantial risk of loss and is not suitable for all investors.  You should carefully consider whether trading is suitable for you in light of your circumstances, knowledge, and financial resources. You may lose all or more of your initial investment. Opinions, market data, and recommendations are subject to change at any time.


Futures Trading Levels

06-13-2019

139cbb5a 75e5 4388 bb35 89ab6ea978fd


Economic Reports, source: 

bettertrader.co

570133a7 b3f4 486a 9cbd f86d4c4ca73f


This is not a solicitation of any order to buy or sell, but a current market view provided by Cannon Trading Inc. Any statement of facts here in contained are derived from sources believed to be reliable, but are not guaranteed as to accuracy, nor they purport to be complete. No responsibility is assumed with respect to any such statement or with respect to any expression of opinion herein contained. Readers are urged to exercise their own judgement in trading.

CME Raises Margins on Stock Indices 2.08.2018

____________________________________________________________________

Voted #1 Blog and #1 Brokerage Services on  TraderPlanet   for 2016!!

____________________________________________________________________

With the recent volatility the CME have raised some of the overnight margins for stock index futures.

Most of our clients enjoy $500 daytrading margins for the contracts below, depending on the platform and in rare cases market conditions. Few of the trading platforms will use % of overnight margins and/or  if you plan on holding positions more than intraday than note below:

ES was $5,555 –> now $6,105

NQ, $5,720 –> $6,380

YM, $4,620 –> $5,280

RTY, $3,245 –> $3,630

NKD, $4,565 –> $5,280

BE CAREFUL!! THESE ARE NOT “REGULAR OR NORMAL TIMES”

Plan your trade, trade your plan and ALWAYS try to asses the risk/ reward ratio you are about to trade.

Continue reading “CME Raises Margins on Stock Indices 2.08.2018”

Futures Gold Breaks Recent Lows 11.18.2015

Connect with Us! Use Our Futures Trading Levels and Economic Reports RSS Feed.

Like us on FacebookFollow us on TwitterView our profile on LinkedInFind us on Google+Cannon Trading Futures Trading Resistance & Support Levels and Economic ReportsFind us on Yelp

1. Market Commentary
2. Futures Support and Resistance Levels – S&P, Nasdaq, Dow Jones, Russell 2000, Dollar Index
3. Commodities Support and Resistance Levels – Gold, Euro, Crude Oil, T-Bonds
4. Commodities Support and Resistance Levels – Corn, Wheat, Beans, Silver
5. Futures Economic Reports for Wednesday November 18, 2015

Hello Traders,

For 2015 I would like to wish all of you discipline and patience in your trading!

As I was about to write today’s blog, it hit me that i would like to know more from you, the reader what kind of topics you like to see in this blog?Take a minute or two and reply back with which of the following you like to see more of:

  • More about trading techniques?
  • Perhaps more charts/ analyzing the markets?
  • 3rd party resources?
  • Trading psychology?
  • Any other topic?
  • You like the blog mix as is….

On a different note, gold just broke recent lows, weekly chart for your review below with some possible levels to watch:

GCE - Gold (Globex), Weekly Continuation
GCE – Gold (Globex), Weekly Continuation

Continue reading “Futures Gold Breaks Recent Lows 11.18.2015”