US/Iran Conflict: Crude Oil, S&P 500 and more PLUS: August Hogs, CannonEdge Snapshot, Pre-Market Briefing, Levels, Reports; Your 6 Important Can’t-Miss Need-To-Knows for Trading Futures on July 14th, 2026

9dc1e02e d5f7 4ff4 abf7 1df60775f196

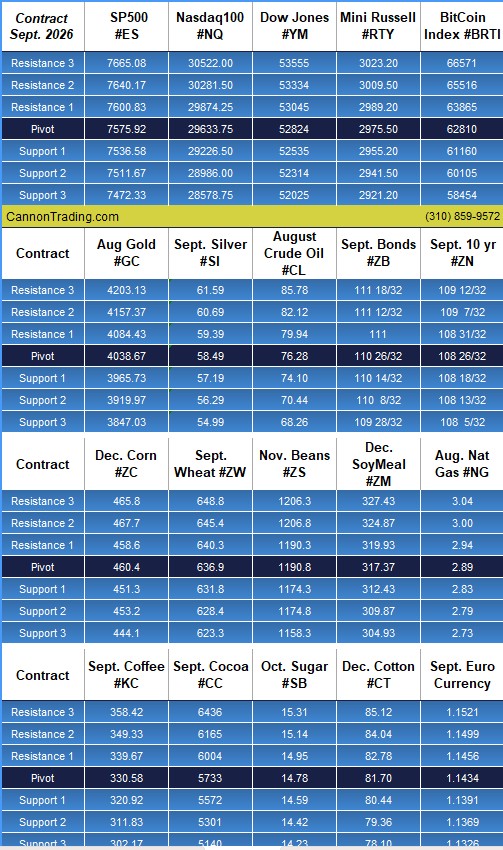
At A Glance Levels

Instrument S2 S1 Pivot R1 R2

Gold (GC)

— Aug (#GC)

3919.97 3965.73 4038.67 4084.43 4157.37

Silver (SI)

— Sept. (#SI)

56.29 57.19 58.49 59.39 60.69

Crude Oil (CL)

— Aug (#CL)

70.44 74.10 76.28 79.94 82.12

 Sept. Bonds (ZB)

— Sept. (#ZB)

110 8/32 110 14/32 110  26/32 111 111  12/32

Crude Oil: The Tape Isn’t Buying the Headlines

By Eli Levy, Senior Analyst & Series 3 Broker

oil


Bottom Line

Top of Book

Markets hit midweek turbulence after another round of attacks in the Strait of Hormuz and word that the U.S./Iran ceasefire is off. Oil and Treasury yields rose, and the VIX nearly touched 19 on Wednesday before drifting back to 15.25 today. But crude never confirmed the panic — August WTI was last seen down $0.49 at $71.59/barrel, and Brent’s brief run above $80 didn’t stick. The distance between the headlines and the price is the week in a sentence.

The Argument

Both Sides of the Tape

The Bull Case

If oil stays contained, the geopolitics stay background noise and the market gets to focus on what actually moves multiples: the economy and Q2 earnings, which start next week. The Street is looking for 23.3% year-over-year growth for the S&P 500 — though it’s worth noting the median company only needs to clear roughly 9%, a far more forgiving bar than the headline number implies.

The tape is behaving like it expects to be rewarded: the S&P 500 is on track for a three-week closing high, and the Equal Weight index bounced firmly off its 20-day SMA, which says the strength isn’t just a handful of megacaps. Financials, healthcare, and industrials are printing new weekly highs. July seasonality has historically been supportive, and a good earnings season would give the fundamental story something to stand on.

Notably, the most constructive argument this week wasn’t about AI at all — it was that the second half offers catch-up trades and overlooked areas precisely because so many expect returns to moderate.

The Bear Case

The longer the conflict runs, the higher the odds oil eventually grinds higher — and higher oil complicates inflation at the exact moment the market wants the Fed sidelined. Both sides say indirect talks continue, but after this week’s exchange, the odds of near-term normalization in the Strait look poor.

Then there’s positioning. Hedge fund gross and net exposure sits near the 97th percentile, retail margin debt, fund leverage, and leveraged ETF assets are all building at once, and quarter-end pension rebalancing points to mechanical selling. None of that is a sell signal on its own, but it’s the kind of structure that turns ordinary pullbacks into sharp ones. And semis still have to prove themselves.

The SOX bounced off its 50-day SMA, but it was choppy, not a clean “V” off support. Notably, funds sold tech at a record pace this week while parts of the Street were buying chips into the reset — a real disagreement, not a technicality.

The Two Arguments Worth Watching…..

READ THE REST and SEE CHARTS

127efd5c bf86 4107 97e6 7fb0c45b7c50

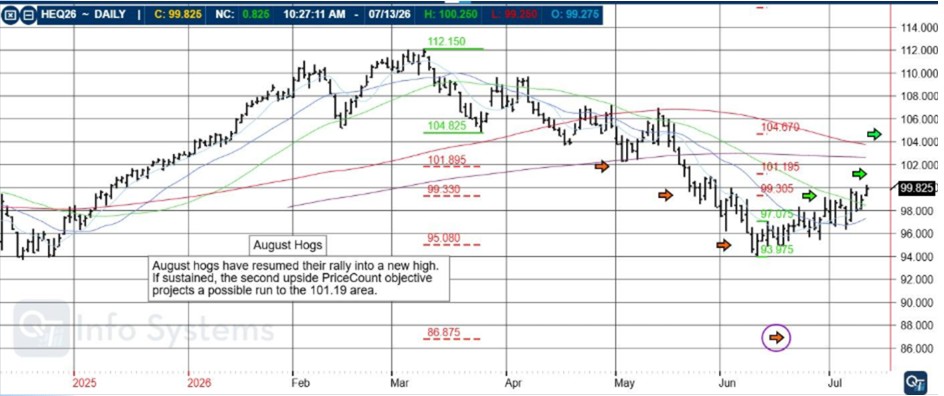
August Hogs

August Hogs have resumed their rally into a new high. If sustained, the second upside PriceCount objective projects a possible run to the 101.19 area.

65478f8c f020 44ec 8100 71977ae33120

The PriceCount study is a tool that can help to project the distance of a move in price. The counts are not intended to be an ‘exact’ science but rather offer a target area for the four objectives which are based off the first leg of a move with each subsequent count having a smaller percentage of being achieved.

It is normal for the chart to react by correcting or consolidating at an objective and then either resuming its move or reversing trend. Best utilized in conjunction with other technical tools, PriceCounts offer one more way to analyze charts and help to manage your positions and risk.

Learn more at www.qtchartoftheday.com

Trading in futures, options, securities, derivatives or OTC products entails significant risks which must be understood prior to trading and may not be appropriate for all investors. Past performance of actual trades or strategies is not necessarily indicative of future results.

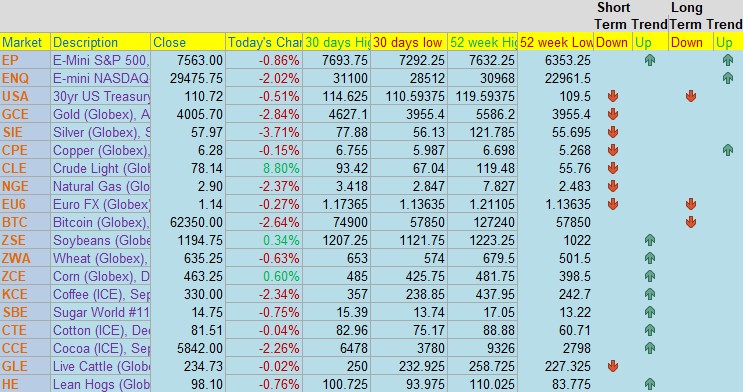
Cannon Edge — Your Daily Futures Snapshot for July 14th

22823c15 da8c 464d a0be 6e92d3293f9e

Cannon Edge is our new daily feature designed to give traders a fast, actionable overview of key futures markets. Each post delivers:


·    Current price and daily % change

·    30‑day and 52‑week highs/lows

·    PROPRIETARY Short‑term and long‑term trend signals

·    Coverage across equity indices, metals, energies, currencies, and ags


Whether you’re scanning for breakout setups, trend reversals, or just staying informed — Cannon Edge puts the data in your hands before the open.

 Built for speed. Backed by insight. Powered by CQG.

Daily Levels for July 14th, 2026

1cb1ac95 bdd5 434d 9551 b45a8d758130

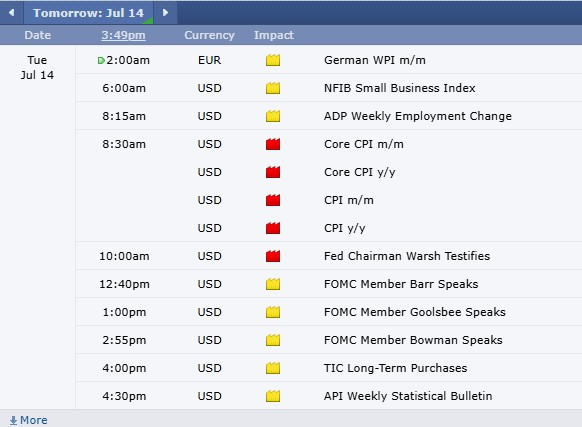
Economic Reports

provided by: ForexFactory.com

All times are Central Time ( Chicago)

fb9badb8 c0f4 4b44 827a b7b6279407ae

Find us on Trustpilot

41a3c910 28d6 4126 946b 6659bb02ae4d

Trading Futures, Options on Futures, and retail off-exchange foreign currency transactions involves substantial risk of loss and is not suitable for all investors. You should carefully consider whether trading is suitable for you in light of your circumstances, knowledge, and financial resources. You may lose all or more of your initial investment. Opinions, market data, and recommendations are subject to change at any time.

Join our Private Facebook group

Subscribe to our YouTube Channel

Listen to our podcast: Subscribe on AppleSpotify, Amazon

or wherever you listen to podcasts!

S
Facebook  Instagram  LinkedIn
S
ef3ab1c9 8d6d 4e60 a3f1 af5d9d4ecbb3
Services
Software
Tools
Community
Contact