Daily Support & Resistance and Economic Data to be Released, October 13th 2010


Daily Support & Résistance Levels Mini-S&P 500 Futures
Dec. 10
Mini-Nasdaq 100 Futures
Dec. 10
Mini-Dow Futures
Dec. 10
Mini Russell 2000 Futures
Dec.10
30-year US Bond Futures
Dec. 10
10-Year US Note
Futures Dec. 10
Support 3 1151.00 2009.00 10843 681.70 13117 12528
Support 2 1156.50 2020.00 10891 686.10 13209 12616
Support 1 1162.75 2032.00 10946 691.00 13300 12626
Resistance 1 1174.75 2058.75 11044 700.30 13314 12703
Resistance 2 1181.50 2063.00 11115 706.60 13403 12707.5
Resistance 3 1188.25 2083.00 11139 719.70 13412 12711
Daily Support & Resistance Levels
Gold Futures
Dec.2010
Silver Futures
Dec. 2010
Copper Futures
Dec. 2010
Crude Oil Futures
Nov. 2010
Euro Curr.
Dec. 2010
Dollar Index
Dec. 2010
Support 3 1339.0 22.85 3.750 80.88 1.3768 .7629
Support 2 1348.0 23.16 3.771 81.69 1.3857 .7705
Support 1 1353.0 23.34 3.795 82.47 1.3912 .7717
Resistance 1 1366.0 23.68 3.841 82.99 1.4001 .7754
Resistance 2 1375.0 23.81 3.860 83.50 1.4026 .7766
Resistance 3 1391.0 24.09 3.880 84.43 1.4113 .7778

Updated: 13-Oct-10 08:32 ET

This Week’s Calendar

Click on a “Release” for Insight

Date ET Release For Actual Briefing.com Consensus Prior Revised From
Oct 13 07:00 MBA Mortgage Applications 10/08 NA NA -0.2%
Oct 13 08:30 Export Prices ex-ag. Sep NA NA 0.5%
Oct 13 08:30 Import Prices ex-oil Sep NA NA 0.3%
Oct 13 14:00 Treasury Budget Sep -$32.0B -$33.5B -$46.6B
Oct 14 8:30 Initial Claims 10/09 450K 450K 445K
Oct 14 8:30 Continuing Claims 10/02 4450K 4450K 4462K
Oct 14 08:30 PPI Sep 0.1% 0.2% 0.4%
Oct 14 08:30 Core PPI Sep 0.1% 0.1% 0.1%
Oct 14 08:30 Trade Balance Aug -$40.0B -$44.5B -$42.8B
Oct 14 11:00 Crude Inventories 10/09 NA NA 3.09M
Oct 15 08:30 CPI Sep 0.1% 0.2% 0.3%
Oct 15 08:30 Core CPI Sep 0.1% 0.1% 0.1%
Oct 15 08:30 Retail Sales Sep 0.2% 0.4% 0.4%
Oct 15 08:30 Retail Sales ex-auto Sep 0.1% 0.4% 0.6%
Oct 15 08:30 NY Fed – Empire Manufacturing Survey Oct 3.0 5.75 4.10
Oct 15 09:55 Mich Sentiment Oct 67.0 68.5 68.2
Oct 15 10:00 Business Inventories Aug 0.4% 0.5% 1.0%

SEE FULL LIST HERE

13. OCT. 2010    Today´s Highlighted Splits

SYMBOL COMPANY EVENT TITLE EPS ESTIMATE EPS ACTUAL PREV. YEAR ACTIVITY DATE/TIME (ET)
HST Host Hotels & Resorts Inc. Q3 2010 Host Hotels & Resorts Inc. Earnings Release $ 0.11 n/a $ 0.11 13-Oct BMO
JPM JPMorgan Chase & Co. Q3 2010 JPMorgan Chase & Co. Earnings Release $ 0.90 n/a $ 0.82 13-Oct 7:00 AM
APOL Apollo Group Q4 2010 Apollo Group Earnings Release $ 1.30 n/a $ 1.06 13-Oct AMC
ACGY Acergy S.A. Q3 2010 Acergy S.A. Earnings Release $ 0.28 n/a $ 0.29 13-Oct
MTOX MEDTOX Scientific, Inc. Q3 2010 MEDTOX Scientific, Inc. Earnings Release $ 0.13 n/a $ 0.09 13-Oct 6:00 AM
TESS TESSCO Q2 2011 TESSCO Earnings Release $ 0.44 n/a $ 0.51 13-Oct AMC

Continue reading “Daily Support & Resistance and Economic Data to be Released, October 13th 2010”
Daily Support & Resistance and Economic Data to be Released, October 12th 2010


Daily Support & Résistance Levels Mini-S&P 500 Futures
Dec. 10
Mini-Nasdaq 100 Futures
Dec. 10
Mini-Dow Futures
Dec. 10
Mini Russell 2000 Futures
Dec.10
30-year US Bond Futures
Dec. 10
10-Year US Note
Futures Dec. 10
Support 3 1146.00 1989.00 10770 675.90 13209 12607
Support 2 1150.50 2006.00 10851 680.00 13300 12625
Support 1 1155.50 2016.50 10897 684.00 13326 12703
Resistance 1 1165.00 2035.00 10984 696.90 13519 12722
Resistance 2 1171.25 2051.00 11010 701.60 13612 12727.5
Resistance 3 1174.75 2063.00 11115 707.40 12627 12810.5
Daily Support & Resistance Levels
Gold Futures
Dec.2010
Silver Futures
Dec. 2010
Copper Futures
Dec. 2010
Crude Oil Futures
Nov. 2010
Euro Curr.
Dec. 2010
Dollar Index
Dec. 2010
Support 3 1308.5 22.35 3.720 80.30 1.3667 .7705
Support 2 1326.0 22.86 3.750 80.88 1.3740 .7748
Support 1 1341.0 22.96 3.780 81.55 1.3767 .7773
Resistance 1 1356.0 23.31 3.800 82.48 1.3831 .7799
Resistance 2 1366.0 23.40 3.822 83.50 1.3864 .7817
Resistance 3 1375.0 23.67 3.867 84.43 1.3924 .7878

Updated: 12-Oct-10 7:59 ET

This Week’s Calendar

Click on a “Release” for Insight

Date ET Release For Actual Briefing.com Consensus Prior Revised From
Oct 12 14:00 Minutes of FOMC Meeting 9/21
Oct 13 07:00 MBA Mortgage Applications 10/08 NA NA -0.2%
Oct 13 08:30 Export Prices ex-ag. Sep NA NA 0.5%
Oct 13 08:30 Import Prices ex-oil Sep NA NA 0.3%
Oct 13 10:30 Crude Inventories 10/09 NA NA 3.09M
Oct 13 14:00 Treasury Budget Sep -$32.0B -$33.5B -$46.6B
Oct 14 08:30 Initial Claims 10/09 450K 450K 445K
Oct 14 08:30 Continuing Claims 10/02 4450K 4450K 4462K
Oct 14 08:30 PPI Sep 0.1% 0.2% 0.4%
Oct 14 08:30 Core PPI Sep 0.1% 0.1% 0.1%
Oct 14 08:30 Trade Balance Aug -$40.0B -$44.5B -$42.8B
Oct 15 08:30 CPI Sep 0.1% 0.2% 0.3%
Oct 15 08:30 Core CPI Sep 0.1% 0.1% 0.1%
Oct 15 08:30 Retail Sales Sep 0.2% 0.4% 0.4%
Oct 15 08:30 Retail Sales ex-auto Sep 0.1% 0.4% 0.6%
Oct 15 08:30 NY Fed – Empire Manufacturing Survey Oct 3.0% 5.75 4.10
Oct 15 09:55 Mich Sentiment Oct 67.0 68.5 68.2
Oct 15 10:00 Business Inventories Aug 0.4% 0.5% 1.0%

12. OCT. 2010 – Today´s Highlighted Splits

SYMBOL COMPANY EVENT TITLE EPS ESTIMATE EPS ACTUAL PREV. YEAR ACTIVITY DATE/TIME (ET)
INTC Intel Corporation Q3 2010 Intel Corporation Earnings Release $ 0.50 n/a $ 0.33 12-Oct
CSX CSX Corporation Q3 2010 CSX Corporation Earnings Release $ 1.04 n/a $ 0.74 12-Oct AMC
FAST Fastenal Q3 2010 Fastenal Earnings Release & September 2010 Sales Release $ 0.50 n/a $ 0.32 12-Oct BMO
VOXX Audiovox Corporation Q2 2011 Audiovox Corporation Earnings Release $ 0.00 n/a $ 0.04 12-Oct AMC
DIET eDiets.com, Inc. Preliminary Q3 2010 eDiets.com, Inc. Earnings Release n/a n/a n/a 12-Oct BMO
AIP.L AIR PARTNER Preliminary 2010 AIR PARTNER Earnings Release n/a n/a n/a 12-Oct BMO

Continue reading “Daily Support & Resistance and Economic Data to be Released, October 12th 2010”

Futures Trading Levels & Economic Reports for July 20th 2010

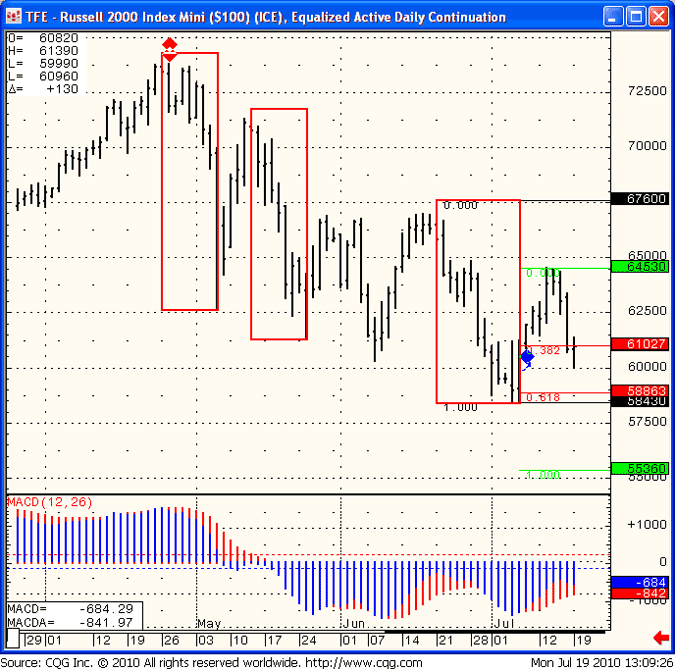
A quick look at mini Russell 2000 daily chart, as I view the mini Russell as being the leader in price action amongst different indices over past few months.

Daily chart below shows how we’ve been making lower highs and lower lows.

If the pattern continues, I see us visiting the 553-556 area over next few days. On the flip side we need to see a break above 650 in order to provide the bulls with more courage.

TFE - Russell 2000 Index Mini (S100) (ICE), Equalized Active Daily Continuation
TFE – Russell 2000 Index Mini (S100) (ICE), Equalized Active Daily Continuation

Continue reading “Futures Trading Levels & Economic Reports for July 20th 2010”

Futures Trading Levels & Economic Reports for July 19th 2010

Quick note about good trading days/periods, bad trading days/periods..

I sometimes hear from clients, that they are not happy because after a period of making money and trading well they are now in a period of ‘scratching’ or losing a ‘little’. If this is the case you are doing well! Why (you may ask)? Because if your bad periods are small losses or scratch, you will be there for the good periods and the next leg up hopefully. However, if your bad trading days/periods include very large losses or drawdowns you may have to go back to the drawing board since the math will not make sense when it’s all said and done.

I have detailed more on the subject in an article I wrote a few years back, called ‘Survivor day-trader’. If you’d like a copy, please send me an email with name, email address, tel number. Please specify if you are a client of cannon or not. I will only email the article to those clients/prospects who provided me with correct information. Thanks for your cooperation!

Continue reading “Futures Trading Levels & Economic Reports for July 19th 2010”

Futures Trading Levels & Economic Reports for July 16th 2010

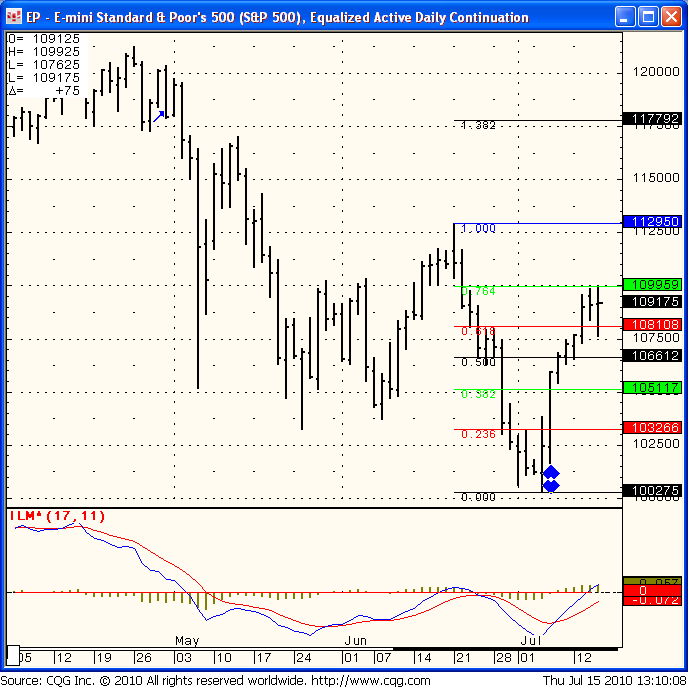
Interesting action today! Not sure what to make of it, there is a case for the bulls and a case for the bears. I am thinking that as a swing trader, one can try to short the market with a stop slightly above the recent highs ( recent high was around 1100 ). Taking the approach that while chances of getting stopped out are higher than normal, the relative risk is smaller than the relative potential reward. On the other hand, bulls may get more confidence going long if market breaks above 1103 or so..

Daily chart for review below.

EP - E Mini Standard & Poor's 500 (S&P), Equalized Active Daily Continuation
EP – E Mini Standard & Poor’s 500 (S&P), Equalized Active Daily Continuation

Continue reading “Futures Trading Levels & Economic Reports for July 16th 2010”

Futures Trading Levels & Economic Reports for July 13th 2010

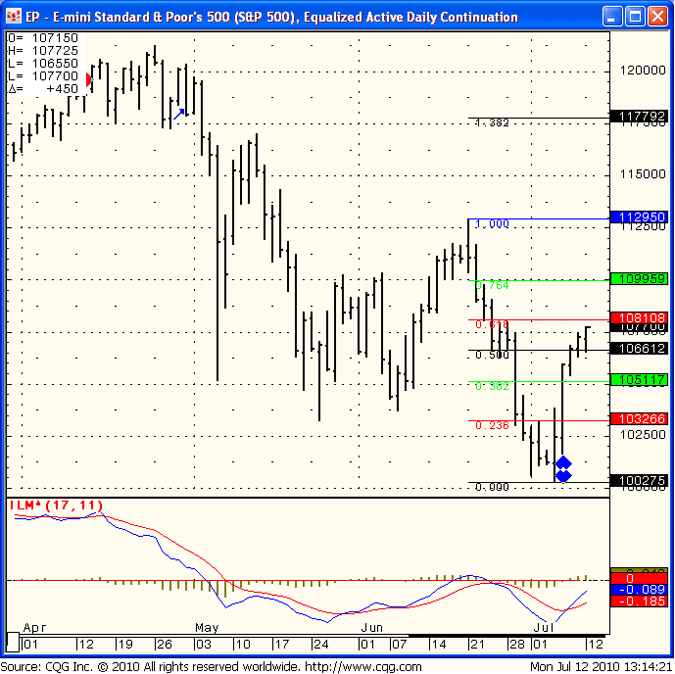
Daily chart below of mini SP 500 shows that we are trading against some potential resistance right around the 1081 level. I think the next few days will carry higher volatility than last two trading sessions and should provide more volatility and ranges for day-traders.

EP - E Mini Standard & Poor's 500 (S&P), Equalized Active Daily Continuation
EP – E Mini Standard & Poor’s 500 (S&P), Equalized Active Daily Continuation

Continue reading “Futures Trading Levels & Economic Reports for July 13th 2010”

Futures Trading Levels & Economic Reports for July 7th 2010

The futures markets in general had some “futures trading to make up” after the long weekend and we some strong moves and bit more volatility in variety of commodity and futures markets.

I mentioned on Friday blog:
“Stock indices are getting a bit oversold and I suspect that sometime next week we should see a good, short covering rally. However, i don’t try to predict when it will happen but rather use price action with support/resistance lines to get a confirmation. Daily chart of the e mini Russell 2000 for your review below. A break above 613 would give me more confidence in taking a trade from the long side, until then the trend is still pointing lower.”

Well.. today we did see a nice rally that peaked at 612.20 on Sept. mini Russell and headed south afterwards.

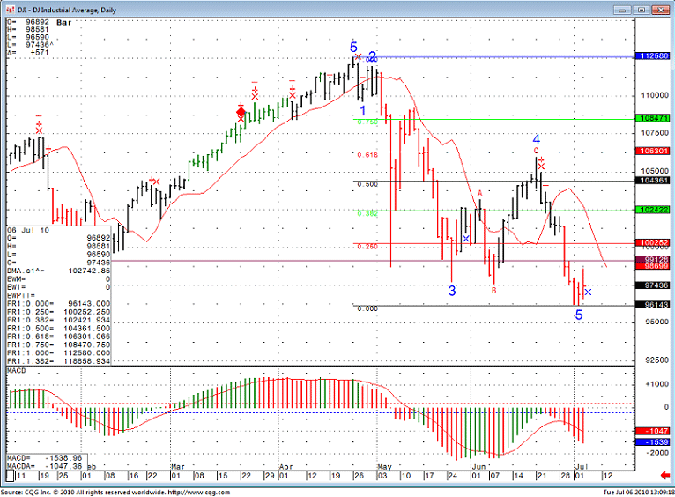
In today’s chart I decided to share the popular and followed Dow Jones index. Same analysis from Friday still holds. While indices may be oversold, I would like to see more follow through on the buy side instead of price failure like we saw in today’s session. 9913 is my level to watch on the Dow Jones cash index.

SP 500 Day Trading for July 6th 2010

Continue reading “Futures Trading Levels & Economic Reports for July 7th 2010”

Futures Trading Levels & Economic Reports for July 6th 2010

Wishing you a great 4th of July weekend! ( Our office is closed Monday )

Stock indices are getting a bit oversold and I suspect that sometime next week we should see a good, short covering rally. However, i don’t try to predict when it will happen but rather use price action with support/resistance lines to get a confirmation.

Daily chart of the e mini Russell 2000 for your review below. A break above 613 would give me more confidence in taking a trade from the long side, until then the trend is still pointing lower.

TFE - Russell 2000 Index Mini (S100) (ICE), Equalized Active Daily Continuation
TFE – Russell 2000 Index Mini (S100) (ICE), Equalized Active Daily Continuation

Continue reading “Futures Trading Levels & Economic Reports for July 6th 2010”