Futures Trading Levels & Economic Reports for July 20th 2010
Posted By:- Ilan Levy-Mayer Vice President, Cannon Trading Futures Blog
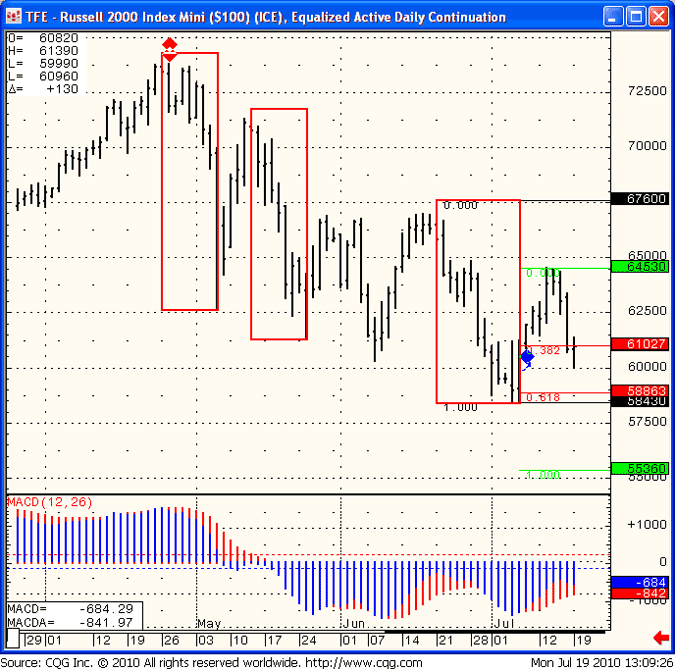
A quick look at mini Russell 2000 daily chart, as I view the mini Russell as being the leader in price action amongst different indices over past few months.
Daily chart below shows how we’ve been making lower highs and lower lows.
If the pattern continues, I see us visiting the 553-556 area over next few days. On the flip side we need to see a break above 650 in order to provide the bulls with more courage.

TFE – Russell 2000 Index Mini (S100) (ICE), Equalized Active Daily Continuation
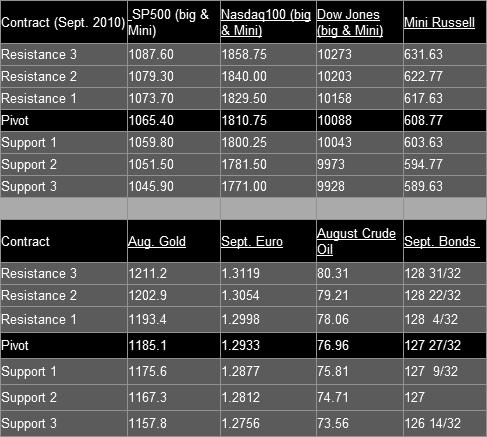
Trading Levels:
This Week’s Calendar from Econoday.Com

Futures Trading Levels for July 19th 2010
All reports are EST time
Tuesday July 20th – http://mam.econoday.com/byweek.asp?cust=mam
- ICSC-Goldman Store Sales – 7:45 AM ET
- Housing Starts – 8:30 AM ET
- Redbook – 8:55 AM ET
- Dan Tarullo Speaks – 10:00 AM ET
- 4-Week Bill Auction – 11:30 AM ET
Disclaimer:
Trading commodity futures and options involves substantial risk of loss. The recommendations contained in this letter is of opinion only and does not guarantee any profits. These are risky markets and only risk capital should be used. Past performances are not necessarily indicative of future results. This is not a solicitation of any order to buy or sell, but a current futures market view provided by Cannon Trading Inc. Any statement of facts herein contained are derived from sources believed to be reliable, but are not guaranteed as to accuracy, nor they purport to be complete. No responsibility is assumed with respect to any such statement or with respect to any expression of opinion herein contained. Readers are urged to exercise their own judgment in trading!


