
|
|
|
|||||||||||||||||||||||||||||||||||||||||||||||||||||||||||||||||
|
|||||||||||||||||||||||||||||||||||||||||||||||||||||||||||||||||
|

|
|
|
|||||||||||||||||||||||||||||||||||||||||||||||||||||||||||||||||
|
|||||||||||||||||||||||||||||||||||||||||||||||||||||||||||||||||
|

|
|
|

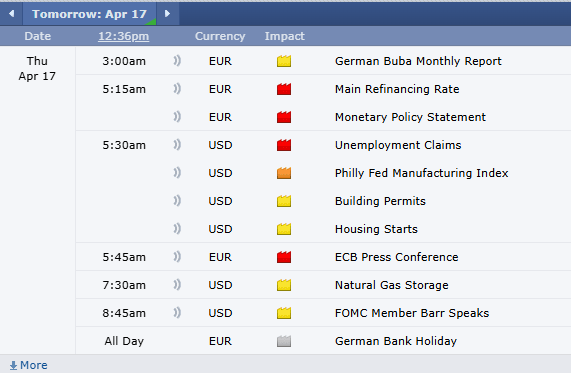
provided by: ForexFactory.com
All times are Eastern Time (New York)
|
||||||||||||||||||||||||||||
|
||||||||||||||||||||||||||||
|
Connect with Us! Use Our Futures Trading Levels and Economic Reports RSS Feed.
![]()
![]()
![]()
![]()
![]()
![]()
1. Market Commentary
2. Futures Support and Resistance Levels – S&P, Nasdaq, Dow Jones, Russell 2000, Dollar Index
3. Commodities Support and Resistance Levels – Gold, Euro, Crude Oil, T-Bonds
4. Commodities Support and Resistance Levels – Corn, Wheat, Beans, Silver
5. Futures Economic Reports for Thursday March 26, 2015
Hello Traders,
For 2015 I would like to wish all of you discipline and patience in your trading!
First sell off in a good few weeks…. Prompted me to share with you a daily chart of mini SP 500, note we closed right on support level.
I am using Heikin-Ashi chart type, which is defined below the chart I am sharing.

Continue reading “Mini S&P Sell Off & Economic Reports 3.26.2015”
Hello Traders,
For 2014 I would like to wish all of you discipline and patience in your trading!
Stock Indices continue to make new highs but on VERY light volume….although I think the trend is up and the chart is more bullish than bearish, it is extremely hard for me to enter fresh longs at these prices because of two main reasons:
1. Very light volume
2. Extremely volatile Geo political arena
Even though I think there is a higher probability of a move higher, the chances for a BIG move is larger to the down side. So for now….I am staying on the sidelines ( swing trading wise).
As I sometimes like to do on Mondays, in order to have a perspective on the fundamentals behind the market, I share the weekly recap from our friends atwww.TradeTheNews.com
TradeTheNews.com Weekly Market Update: Feasting on Doves
– A slightly more hawkish tone was heard from the Fed this week, in the minutes of the July FOMC meeting and in speeches from leading officials. Fed Chair Yellen’s presentation at Jackson Hole was restrained and balanced, but the dovish Williams and moderate Lockhart both conceded that rate hikes would likely begin by mid-2015. The US yield curve flattened notably after all the talk. August Flash PMI manufacturing readings provided a view of the global economy at the midpoint of the third quarter: in the US, the Markit survey hit its highest level since April 2010, with big gains in all sub-indices; in Europe, the French data sank deeper into contraction while Germany flat-lined; in Asia, the China HSBC manufacturing PMI sank to a three-month low, while Japan’s rose to a five-month high. Violence in Iraq, Syria, and Ukraine kept markets jumpy, although it hardly prevented material gains in equities worldwide. For the week, the DJIA gained 2%, the S&P500 rose 1.7% and the Nasdaq added 1.6%.
– The FOMC minutes out on Wednesday indicated that the Fed appears to be shifting to a more balanced view of the economy from a more dovish position. The changes were of tone rather than anything material, although the minutes also showed a growing debate regarding the labor market. The minutes added a controversial new statement: “…a range of labor market indicators suggested that there remained significant underutilization of labor resources.” Both Bullard and Plosser have disagreed with the novel use of “significant” to describe labor resource underutilization. Yellen’s speech at Jackson Hole on Friday was balanced and pragmatic, noting both the positive developments in the jobs market and more negative trends, including slack in the mortgage market.
– The Ukraine situation seemed to be easing early in the week, as Kiev and Russian officials met and seemed to agree to protocols for allowing the Russian humanitarian mission into Ukraine. Meanwhile the Ukraine armed forces made even more gains against the rebels. By Friday, relations between Kiev and Moscow had soured again after the Russian side forced in the convoy without permission, prompting the Ukrainians to call it an invasion. In Iraq, the killing of a US journalist by ISIS hardened the US stance against the group, prompting very hawkish rhetoric out of administration figures, who suggested airstrikes against ISIS might be expanded into Syria.
– Shares of major US homebuilders gained steadily this week thanks to another month of strong gains in the August NAHB report and the July housing starts. The NAHB’s 55 reading was the third month of gains for the index, while July housing starts rose 8%, halting two straight months of declines. Some skeptics pointed out that multi-family units were the lion’s share of the gain, but single-family starts also saw solid improvement.
– Target’s earnings slid as its Canada operations continued to drag on results, and management cuts its FY view for the second time as traffic declined, even as the firm has ramped up promotional activity. TJX saw its earnings grow by single digits and the firm hiked its FY guidance. Teen retailer American Eagle topped very low expectations on a negative comp. L Brands saw modest growth and positive comps. Both Home Depot and Lowes saw very good quarterly results, and Home Depot said the housing market remains a modest tailwind for its business, and it observed an acceleration of big-ticket spending in the quarter.
– Bank of America reached a $16.7 billion agreement with DoJ to settle charges it misled investors into buying troubled MBS, confirming numerous reports from earlier in August. BoA will pay a $9.65 billion in cash and provide $7 billion of consumer relief to struggling homeowners and communities. The deal resolves nearly all of the legacy issues left over from the hastily-arranged crisis-era acquisitions of Countrywide and Merrill Lynch. The accord is expected to reduce Q3 earnings by about $5.3 billion, or about $0.43/share.
– Various long-running M&A dramas saw new developments this week. Valeant extended the expiration of its exchange offer to acquire Allergan to December 31, and there were reports that Allergan had approached Salix Pharmaceuticals or Jazz about a possible merger to fend off Valeant’s advances. CNBC threw cold water on the story, reporting that any potential deal could be months away, perhaps in December. Dollar General rolled out a $9.7 billion cash offer for Family Dollar, topping the $8.95 billion bid made in late July by Dollar Tree. Family Dollar rejected the proposal on the basis of antitrust regulatory considerations, although there were unconfirmed reports that it was open to concessions to resolve the compliance issues.
– EUR/USD hit one-year lows around 1.3220 this week as headwinds strengthened for the European economy. The Ukraine conflict continues to weigh on the single currency, and the opposite trajectories for EU and US monetary policy become even starker. Cable slumped to its lowest level since April thanks to soft July UK CPI inflation data and a significant decline in July PPI inflation numbers. GBP/USD tested below 1.6565 on Friday afternoon. The minutes for the BoE’s August meeting disclosed the first dissent on the committee since July 2011. The vote was 7-2, with Weale and Mccafferty dissenting.
– The surprise slowdown in China manufacturing in the first half of August prompted fresh speculation over a further policy stimulus from Beijing. The August HSBC flash manufacturing PMI turned lower for the first time since March, hitting a 3-month low of 50.3 and widely missing consensus of 51.5. Growth in new orders slowed and disinflationary trends resurfaced with a decrease in both input and output price components. Later on the Friday, China’s MIIT warned the economy is faced with strong downward pressure, while analysts with Barclays noted this PMI slump could result in as many as two interest rate cuts by the PBoC before the end of 2014.
– An underwhelming run of July economic data in Japan continued with a wider than expected trade deficit. Exports rose for the first time in three months, but soft yen boosted the import value of energy, contributing to the 25th consecutive month of negative trade. On Thursday, local press reported that Japan is looking to set aside as much as ¥1.0T in stimulus funds in the 2015 budget supporting small business, presumably to help soften any further blow to the economy if PM Abe decides to proceed with a second increase in consumption tax.
Source: http://www.tradethenews.com/?storyId=1590961
Continue reading “News on Stock Indices, Economic Reports & Levels 8.26.2014”
Connect with Us! Use Our Futures Trading Levels and Economic Reports RSS Feed.
![]()
![]()
![]()
![]()
![]()
![]()
1. Market Commentary
2. Futures Support and Resistance Levels – S&P, Nasdaq, Dow Jones, Russell 2000, Dollar Index
3. Commodities Support and Resistance Levels – Gold, Euro, Crude Oil, T-Bonds
4. Commodities Support and Resistance Levels – Corn, Wheat, Beans, Silver
5. Futures Economic Reports for Friday June 6, 2014
Hello Traders,
For 2014 I would like to wish all of you discipline and patience in your trading!
I was talking about how volatility comes and goes in cycles yesterday and sure enough after ECB decision to lower rates, we saw some good, two sided trading action in stock indices along with much better volume.
More to come tomorrow in my opinion as market awaits monthly unemployment report before the cash opens ( 5:30 AM pacific time/ 7:30 AM Central time)
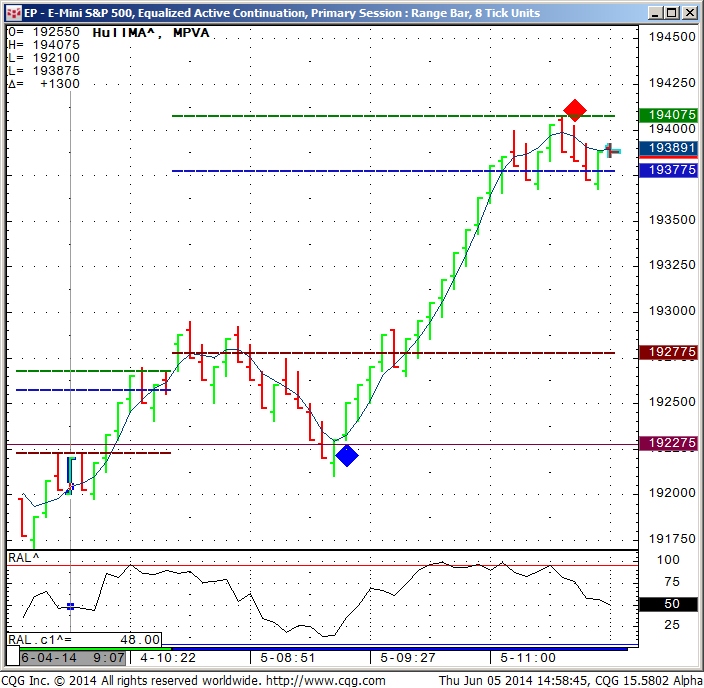
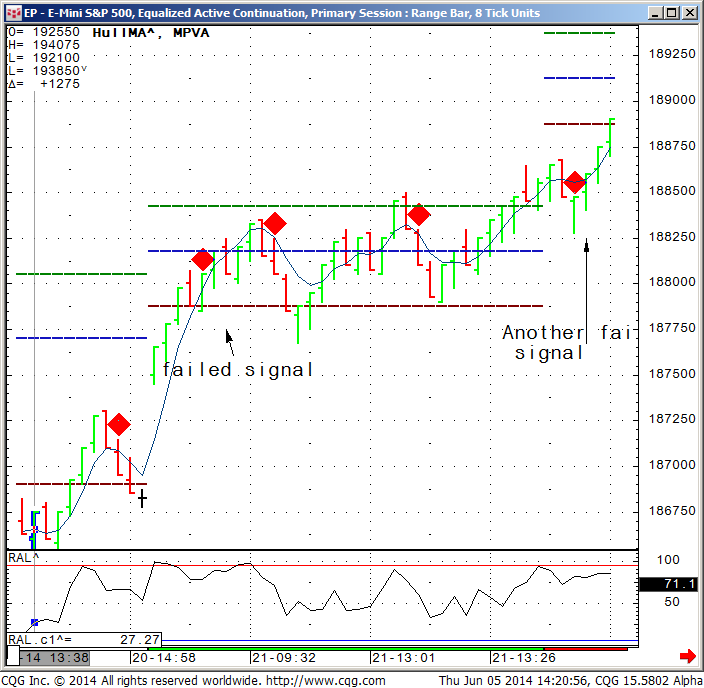
I must share with you my mini SP chart set up as it played out today which shows the only two signals for today -1 buy and 1 sell ( blue diamond buy, red diamond sell). To keep this balanced I am also sharing a screen shot from a few trading days ago where two of the red diamonds generated a “failed” sell signal.
If you like a trial for the ALGO, please read below the charts:
Today’s session:
May 21st 2014 session:
Would you like to have access to my DIAMOND and TOPAZ ALGOs as shown above
and be able to apply for any market and any time frame on your own PC ? You can now have a three weeks free trial where I enable the ALGO along with few studies for your own sierra/ ATcharts and/or CQG .
To start your trial, please visit:
If so, please send me an email with the following information:
1. Are you currently trading futures?
2. Charting software you use?
3. If you use sierra or ATcharts, please let me know the user name so I can enable you
4. Markets you currently trading?
HYPOTHETICAL PERFORMANCE RESULTS HAVE MANY INHERENT LIMITATIONS, SOME OF WHICH ARE DESCRIBED BELOW. NO REPRESENTATION IS BEING MADE THAT ANY ACCOUNT WILL OR IS LIKELY TO ACHIEVE PROFITS OR LOSSES SIMILAR TO THOSE SHOWN. IN FACT, THERE ARE FREQUENTLY SHARP DIFFERENCES BETWEEN HYPOTHETICAL PERFORMANCE RESULTS AND THE ACTUAL RESULTS SUBSEQUENTLY ACHIEVED BY ANY PARTICULAR TRADING PROGRAM.
ONE OF THE LIMITATIONS OF HYPOTHETICAL PERFORMANCE RESULTS IS THAT THEY ARE GENERALLY PREPARED WITH THE BENEFIT OF HINDSIGHT. IN ADDITION, HYPOTHETICAL TRADING DOES NO INVOLVE FINANCIAL RISK, AND NO HYPOTHETICAL TRADING RECORD CAN COMPLETELY ACCOUNT FOR THE IMPACT OF FINANCIAL RISK IN ACTUAL TRADING. FOR EXAMPLE, THE ABILITY TO WITHSTAND LOSSES OR TO ADHERE TO A PARTICULAR TRADING PROGRAM IN SPITE OF TRADING LOSSES ARE MATERIAL POINTS WHICH CAN ALSO ADVERSELY AFFECT ACTUAL TRADING RESULTS. THERE ARE NUMEROUS OTHER FACTORS RELATED TO THE MARKETS IN GENERAL OR TO THE IMPLEMENTATION OF ANY SPECIFIC TRADING PROGRAM WHICH CANNOT BE FULLY ACCOUNTED FOR IN THE PREPARATION OF HYPOTHETICAL PERFORMANCE RESULTS AND ALL OF WHICH CAN ADVERSELY AFFECT ACTUAL TRADING RESULTS
If you like the information we share? We would appreciate your positive reviews on our new yelp!! Continue reading “Mini S&P Charts & Economic Reports 6.06.2014”
Connect with Us! Use Our Futures Trading Levels and Economic Reports RSS Feed.
![]()
![]()
![]()
![]()
![]()
![]()
1. Market Commentary
2. Futures Support and Resistance Levels – S&P, Nasdaq, Dow Jones, Russell 2000, Dollar Index
3. Commodities Support and Resistance Levels – Gold, Euro, Crude Oil, T-Bonds
4. Commodities Support and Resistance Levels – Corn, Wheat, Beans, Silver
5. Futures Economic Reports for Thursday May 15, 2014
Hello Traders,
For 2014 I would like to wish all of you discipline and patience in your trading!
I wrote a quick paragraph about observing the relationship between the mini Russell 2000 and the mini SP 500 yesterday and I got a response from one of our readers that I thought is worth sharing and has some good observations, so here is below with very minor edits:
Hi Ilan,
I received your comments about Russell leading SP’s in tonight’s email, and as someone who has been watching and studying this relationship for over 5 years, I wanted to make a few comments.
Russell 2000 does tend to lead other Indexes on larger time frames like daily and larger intra-day charts like 30 min and higher. However nothing is a simple as it seems of course. And one of the biggest reasons it is not simple is because large traders and institutions know that small traders are trying to get clues from TF to trade ES, and I have seen many times where they will come in and start buying Russell and a few minutes
later start selling much larger size in ES.
Also, quite often these two Indexes will trade without any correlation at all shorter term, not sure if you saw closing minutes of Monday’s trading where TF dropped 7 points in a few minutes and ES did not budge. And then there is a matter of difference in liquidity of course, sometimes I see quite opposite take place – where ES starts moving and TF is sitting there, and it’s not until ES moved two whole points does TF starts to move a little, this happens because TF buyer will have to give up a lot of edge to buy any kind of size, and they need to see a decent move in ES before they will buy TF.
What I described above is a very small example of what happens between these two Indexes, it is important to understand that what seems to be correlation short term, in access of 80% of the time will not produce desired results. With that said….there are instances when TF’s lead is obvious, but it takes quite a bit of time to learn and understand mechanics behind it, I am afraid comparing two intra-day charts will not shed any light on this relationship, there is too much more going behind “the scenes”
Sincerely,
Simon B.
If you like the information we share? We would appreciate your positive reviews on our new yelp!! Continue reading “Futures Relationships between the Mini S&P and Mini Russell 2000 5.15.2014”
Connect with Us! Use Our Futures Trading Levels and Economic Reports RSS Feed.
![]()
![]()
![]()
![]()
![]()
![]()
1. Market Commentary
2. Futures Support and Resistance Levels – S&P, Nasdaq, Dow Jones, Russell 2000, Dollar Index
3. Commodities Support and Resistance Levels – Gold, Euro, Crude Oil, T-Bonds
4. Commodities Support and Resistance Levels – Corn, Wheat, Beans, Silver
5. Futures Economic Reports for Friday May 9, 2014
Hello Traders,
For 2014 I would like to wish all of you discipline and patience in your trading!
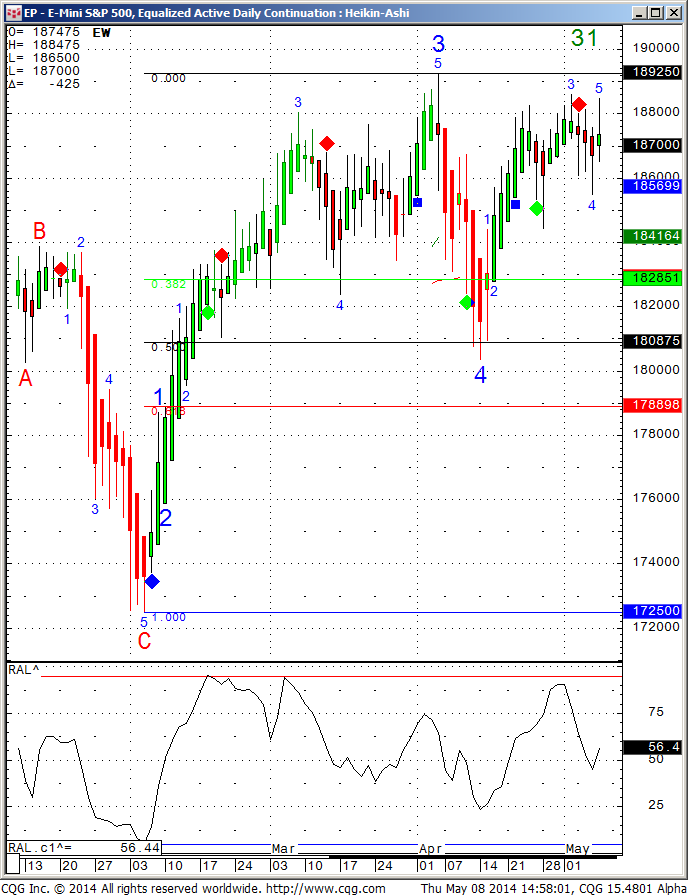
Seems like both the NASDAQ and the Russell had a healthy correction over the past 8 weeks while both the Dow and the SP500 are still flirting with the all time highs. The big question is who going to catch up with who…NASDAQ and Russell starts edging higher or SP and Dow start going lower?
Daily charts of the mini Russell 2000 as well as the mini SP 500 for your review below:

If you like the information we share? We would appreciate your positive reviews on our new yelp!! Continue reading “Mini Russell & Mini S&P Heikin Ashi Charts & Economic Reports 5.09.2014”
Rollover Notice for Stock Index Futures
Important notice: For those of you trading any stock index futures contracts, i.e., the E-mini S&P, E-mini NASDAQ, E-mini Dow Jones, the “Big” pit-traded S&P 500, etc., it is extremely important to remember that tomorrow, Thursday, December 13th, is rollover day.
Starting December13th, the March 2013 futures contracts will be the front month contracts. It is recommended that all new positions be placed in the March 2013 contract as of December 13th. Volume in the December 12 contracts will begin to drop off until its expiration on Friday December 21st.
The month code for March is H3.
Traders with electronic trading software should make sure that defaults reflect the proper contract as of Thursday morning.
| Please close any open December Currency positions by the close on Friday the 14th.Should you have any further question please contact your broker. |
Jump to a section in this post:
1. Market Commentary
2. Support and Resistance Levels – S&P, Nasdaq, Dow Jones, Russell 2000, Dollar Index
3. Support and Resistance Levels – Gold, Euro, Crude Oil, T-Bonds
4. Support and Resistance Levels – Corn, Wheat, Beans, Silver
5. Economic Reports for Tuesday May 23, 2012
Hello Traders,
Good ranges on many markets I follow intra day, which most day-traders look for.
As I said many times before , volatility and wide ranges can be a double edge sword….
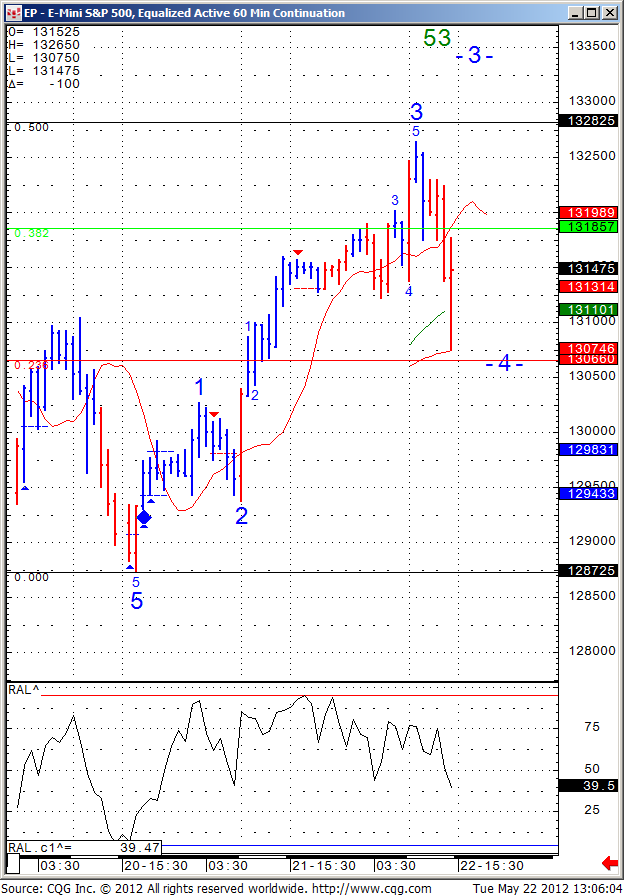
Below you will see an hourly chart of the mini SP 500 along with some potential Elliott Wave targets for either pull backs or continued bounce.
Trade with patience, trade with discipline and good trading to all.
Hourly chart of Mini S&P 500 below for your review:
 Continue reading “Hourly Chart Mini S&P 500 for May 23, 2012”
Jump to a section in this post:
1. Market Commentary
2. Support and Resistance Levels – S&P, Nasdaq, Dow Jones, Russell 2000
3. Support and Resistance Levels – Gold, Euro, Crude Oil, T-Bonds
4. Economic Reports for Friday November 11, 2011
Another trading day brings me to a different topic.
Most of our clients trade stock index futures, like mini SP 500, Mini Russell, Mini Dow Jones futures as well as the DAX and eurostoxx over at Europe ( which appeal to some traders because of the different times these markets are active) etc.
Even within this market group, different markets will behave differently because of difference in the underlying product as well as volume and more. Example the mini Russell 2000 versus the mini SP500.
The mini Russell is a little more “erratic”, bigger, spikier, quicker moves. Mainly because it has less volume than the mini SP 50 but also because the cash index includes the 500 SP stocks plus additional 1500 stocks….
With the growth of electronic trading, volume in Grains, interest rates, currencies, metals, energies and other segments have grown enough that many of these markets are “suitable” for day-trading.
The following is a small list of markets you may want to follow, trade in demo and consider for your day-trading. Another point to keep in mind that some of these markets have lower exchange fees, hence your total transaction costs can be lower!
Indices as discussed above
Currencies ( Euro, Yen, British Pound, Canadian Dollar, Australian dollar)
Interest rates ( US bonds/ 30 years, Ten Years, Five years and even the ULTRA bond contract is picking up volume)
Energies ( mostly Crude oil and Natural gas)
Metals ( gold and silver)
Grains ( beans, corn and wheat)
So the main point I am trying to make today is that there are other markets you may want to look at for day-trading. Some markets fit some traders better because maybe they “respect the trend better”, maybe less volatile or simply because they just are a better match for the trader’s personality on the other side. Some markets are more suitable for “trend following” intraday techniques, while other maybe better for counter trend trading style.
Below you will see two different 15 minutes charts, one of the mini SP 500, the other of the Ten year notes. Continue reading “Fifteen Minute Mini SP and Ten Year Notes Charts | Looking at Markets for Day-Trading | Support and Resistance Levels”