VIX, 12-Day War, Sept. Coffee; Your 3 Important Need-To-Knows for Trading Futures on June 25th, 2025

9dc1e02e d5f7 4ff4 abf7 1df60775f196

Take a Look at the VIX

By John Thorpe, Senior Broker

vix

12-Day War; Volatility and THE VIX

The Fragile state of the 12-day war will create more angst in our markets if the ceasefire does not hold. President Trumps impact reaches beyond the tariff wars as more negotiations will be revealed as western leaders meet in the Netherlands the next few days. And as Europe’s NATO leaders gather in The Hague to agree on a historic defense spending target of 5 percent, the answer may come as a surprise.

Rather than doing a market recap today; below is a brief I put together regarding The Volatility Index or simply “The Vix Index”. This instrument is a futures contract traded at the Chicago Board Options Exchange which is the pre-eminent American Stock Option Exchange.

Call your Cannon Broker if you think you would benefit from live or even delayed VIX data on your trading platform.

The VIX Index is a calculation designed to produce a measure of constant, 30-day expected volatility of the U.S. stock market, derived from real-time, mid-quote prices of S&P 500® Index (SPX℠) call and put options. On a global basis, it is one of the most recognized measures of volatility — widely reported by financial media and closely followed by a variety of market participants as a daily market indicator.

Market volatility is here to stay for the foreseeable future with its ebbs and flows.

Choose your opportunities wisely. Today’s market swings were largely back to normal (pre tariff talk normal)

Tomorrow:

Econ Data:  Building Permits, EIA Crude oil stocks, New Home Sales

FED Chair Powell Congressional Testimony (Senate) 9:00 am

Earnings: Micron, General Mills

Tariff news: Anything goes!

S
46cac129 8d48 459b 9076 869d09168ad7
The VIX Index is a calculation designed to produce a measure of constant, 30-day expected volatility of the U.S. stock market, derived from real-time, mid-quote prices of S&P 500® Index (SPX℠) call and put options. On a global basis, it is one of the most recognized measures of volatility — widely reported by financial media and closely followed by a variety of market participants as a daily market indicator.

The inverse can easily be represented by looking at the Daily S&P chart

2a93af05 e0ed 44d4 958c 326ab741094c
eb23d89b a6ee 494c a74a 38b5f4e886e7

Sept. Coffee

September coffee satisfied its second downside PriceCount objective and is consolidating its trade. At this point, IF the chart can resume its slide with new sustained lows, the third count would project a possible slide to the 282 area.

069af7e0 8dc6 4882 8e08 57293fd5af32

The PriceCount study is a tool that can help to project the distance of a move in price. The counts are not intended to be an ‘exact’ science but rather offer a target area for the four objectives which are based off the first leg of a move with each subsequent count having a smaller percentage of being achieved.

It is normal for the chart to react by correcting or consolidating at an objective and then either resuming its move or reversing trend. Best utilized in conjunction with other technical tools, PriceCounts offer one more way to analyze charts and help to manage your positions and risk. Learn more at www.qtchartoftheday.com

Trading in futures, options, securities, derivatives or OTC products entails significant risks which must be understood prior to trading and may not be appropriate for all investors. Past performance of actual trades or strategies is not necessarily indicative of future results.

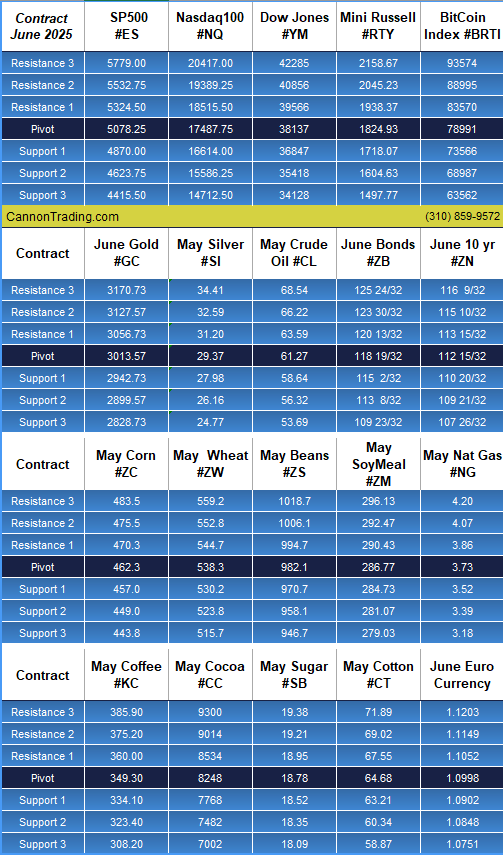
Daily Levels for June 25th, 2025

9c13e36f 1a98 4555 b2ff 802b4c3332d1

Want to feature our updated trading levels on your website? Simply paste a small code, and they’ll update automatically every day! 

Click here for quick and easy instructions.

Economic Reports

provided by: ForexFactory.com

All times are Eastern Time ( New York)

c5d6903e 9e20 43fa b846 7ed07c29d469

Find us on Trustpilot

stars

Trading Futures, Options on Futures, and retail off-exchange foreign currency transactions involves substantial risk of loss and is not suitable for all investors. 

You should carefully consider whether trading is suitable for you in light of your circumstances, knowledge, and financial resources. You may lose all or more of your initial investment.

Opinions, market data, and recommendations are subject to change at any time.

Join our Private Facebook group

Subscribe to our YouTube Channel

Listen to our podcast: Subscribe on AppleSpotify, Amazon

or wherever you listen to podcasts!

S
Facebook  Instagram  LinkedIn
S
ef3ab1c9 8d6d 4e60 a3f1 af5d9d4ecbb3
Services
Software
Tools
Community
Contact

High-Volatility Markets! 5 Smart Moves for Confident Trading, May Soybean

9dc1e02e d5f7 4ff4 abf7 1df60775f196

Extreme Volatility!

Volatility!

volatile

The last few weeks and especially the last few trading sessions we saw tremendous volatility across many markets.

What we witnessed last night and during today’s session reminded me of the markets when COVID first broke out and we saw limit moves across the board.

Temporarily: Due to volatility, most of our platforms now require 100% margins; even for day trading!

Here are some ideas to explore during times of volatility like these:

1.      You don’t have a crystal ball. To think you can buy an ES contract in this volatility and use a 2 point stop in hopes of making 20 points profit is a very low probability event…you would need to buy it at the PEREFECT time for this to happen. Point is, with higher volatility you need to use WIDER stops to give yourself a chance. That may mean using SMALLER trade size.

2.      If you are able to, share your read with another trader, it may provide you with a better perspective just by sharing.

3.      If you think there is room for a big move or what we call a “runner” – be prepared to for the pullbacks. Use multiple time frames to gain a better perspective and hang in there for the big move, if this is what you think can happen.

4.      If you have enough risk capital, try to use multiple contracts, example buying 2 rather than 1. Taking profit on the first part of the position will help you relax and look at what the market is really telling you rather than what you would like it to say. It helps reduce both the fear and the greed.

5.    “Plan your trade, trade your plan”

Again, these are just some short pointers, written quickly after today’s session in hopes of helping you when you face a similar situation of extreme volatility.

S

May Soybeans

soybean 3

May soybeans satisfied a third downside PriceCount objective on the Friday flush. It is normal for the chart to react in the form of a near term consolidation or corrective trade, at leaset. IF we can resume the break the contract low stands out as a significant support level to contend with while the low percentage fourth count remains open to the $9.16 area.

47cf68bc 26b3 49a2 9db7 b09b272901c4

The PriceCount study is a tool that can help to project the distance of a move in price. The counts are not intended to be an ‘exact’ science but rather offer a target area for the four objectives which are based off the first leg of a move with each subsequent count having a smaller percentage of being achieved.
It is normal for the chart to react by correcting or consolidating at an objective and then either resuming its move or reversing trend. Best utilized in conjunction with other technical tools, PriceCounts offer one more way to analyze charts and help to manage your positions and risk. Learn more at www.qtchartoftheday.com
Trading in futures, options, securities, derivatives or OTC products entails significant risks which must be understood prior to trading and may not be appropriate for all investors. Past performance of actual trades or strategies is not necessarily indicative of future results.

Daily Levels for April 8th, 2025

96c2d18d 8144 4f5a a8db 3598b6f9ed82

Want to feature our updated trading levels on your website? Simply paste a small code, and they’ll update automatically every day!

 Click here for quick and easy instructions.

822b33c5 2339 45ed bc84 e9c8f8c7358e

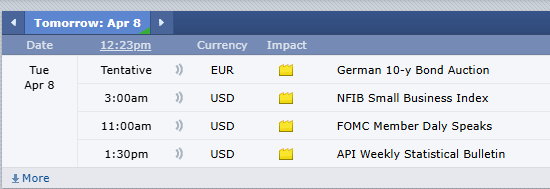
Economic Reports

provided by: ForexFactory.com

All times are Eastern Time (New York)
32b3ca0b 813a 4eaa 9617 92020f09c017

Find us on Trustpilot

stars

Trading Futures, Options on Futures, and retail off-exchange foreign currency transactions involves substantial risk of loss and is not suitable for all investors. You should carefully consider whether trading is suitable for you in light of your circumstances, knowledge, and financial resources. You may lose all or more of your initial investment. Opinions, market data, and recommendations are subject to change at any time.

Call Now

Join our Private Facebook group

Subscribe to our YouTube Channel

Listen to our podcast: Subscribe on AppleSpotify, Amazon

or wherever you listen to podcasts!

S
Facebook  Instagram  LinkedIn
S
ef3ab1c9 8d6d 4e60 a3f1 af5d9d4ecbb3
Services
Software
Tools
Community
Contact

Taking Clues from the VIX & Support and Resistance Levels 1.19.2022

Get Real Time updates and more on our private FB group!

Correlational Observations of Indices Market Behavior.

VIX Volatility futures Index.

By John Thorpe, Senior Broker
VIX futures expiration is a monthly occurrence. The expiration is somewhat varied, the remaining 2021 schedule is included below, typically, middle of the month on Wednesday mornings. Take a look at your daily chart for any of the indices and you see the sell offs during the week of or the week prior to VIX
 expiration days.
My belief is there would be a smaller probability of a correlational relationship during a Bear stock market, However, Since we are in the 12th year of a bull market, I believe the underling price action is created by portfolio managers rolling their hedges and adjusting their risk for the coming month. They often use the week prior to Short the VIX at higher prices (lower equity index prices) for the first week of the new VIX contract month as they are buying back their old contract shorts pushing the VIX prices higher, thereby pushing negative sentiment into the marketplace. If there are more extreme price movements in their favor, they will elect to have the hedges expire to cash as the contracts are financially settled.
Coincidentally, to the recent market sell off January VIX expires Wednesday morning 19th at 8:00 a.m. CDT
19 January 2022
16 February 2022
15 March 2022 (Tuesday, due to Good Friday on 15 April 2022)
20 April 2022
18 May 2022
15 June 2022
20 July 2022
17 August 2022
21 September 2022
19 October 2022
16 November 2022
21 December 2022

Trading Futures, Options on Futures, and retail off-exchange foreign currency transactions involves substantial risk of loss and is not suitable for all investors.  You should carefully consider whether trading is suitable for you in light of your circumstances, knowledge, and financial resources. You may lose all or more of your initial investment. Opinions, market data, and recommendations are subject to change at any time when it comes to Futures Trading.


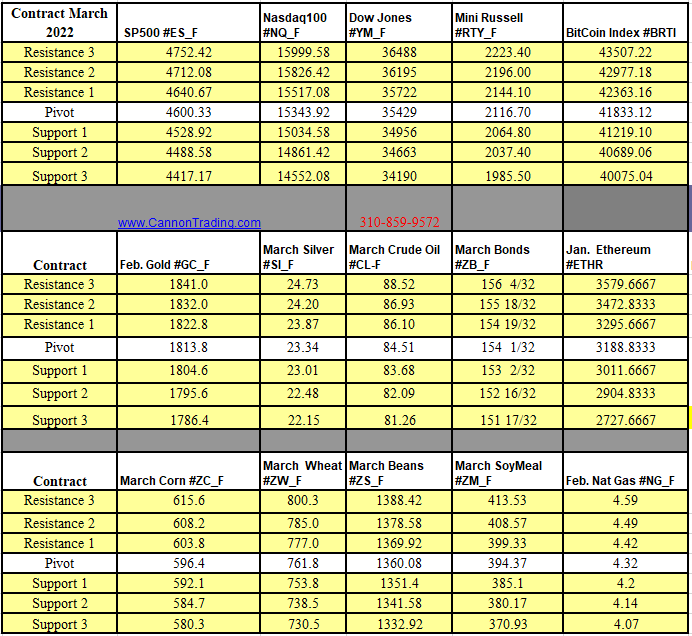
Futures Trading Levels

01-19-2022

Support and Resistance Levels 1.18.2022


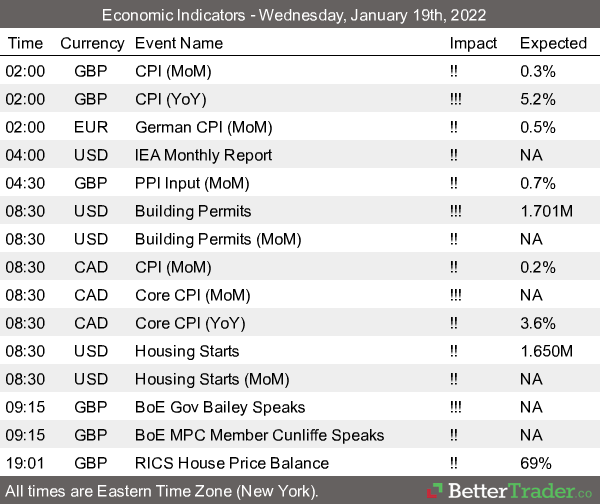
Economic Reports, Source: 

https://bettertrader.co/ 

BetterTrader Economic Indicators 1.18.2022


This is not a solicitation of any order to buy or sell, but a current market view provided by Cannon Trading Inc. Any statement of facts here in contained are derived from sources believed to be reliable, but are not guaranteed as to accuracy, nor they purport to be complete. No responsibility is assumed with respect to any such statement or with respect to any expression of opinion herein contained. Readers are urged to exercise their own judgement in trading.

NASDAQ Futures Down 3% + Futures Trading Levels for 01.06.2022

Pass the Knowledge – Feel Free to Forward to a Friend!
Get Real Time updates and more on our private FB group!
Hello Traders,
Happy and prosperous New Year from the Cannon Trading Team!
We appreciate the chance to serve your futures trading needs and are here to assist.
FOMC Minutes report triggered one of the larger sell offs we have seen in recent months. NQ and RTY were both down over 3% when the trading day was over.
Hope it helps.
*While I have no idea were the market is going from day to day, minute to minute, week to week etc. I do know that in the past, some of the sharpest and largest rallies were short covering after a large sell off. More often than not market sell offs and volatility like we are seeing do not end up as V type of action but more like U or W when it is all said and done.
*Expect the unexpected…
* Have an idea of what you are looking to do, keep in mind possible risk and have a game plan. Now more than ever, plan your trade and trade your plan!
* Think money management, hedging risk while you are still trying to figure out how to profit.
* Know what is going on, reports, current margins, current limits and more.
*Consider short term options instead of futures and/or MICROS
*Trade smaller. The bands are much larger. Watch the VIX.
* DO NOT assume anything…if you are not sure, contact us and we will try our best to assist with the combined, vast experience we have here as a team.
* Wash hands, take this seriously and do your best to stay healthy….
My colleague, John Thorpe, Ex floor broker, contributed the following on the VIX and the VVIX:
“We recommend all stock indices intraday traders to keep an eye on the VIX for directional clues and study, many of you have access through other means to view this critical trading barometer, VIX now trades 5 days per week ,23 hours per day. if you need to add the VIX data to your trading platforms , it’s 3 bucks per month, penny wise and pound foolish if you don’t. Contact your broker on how to add the Volatility Index traded through the CBOE to your trading platform.”

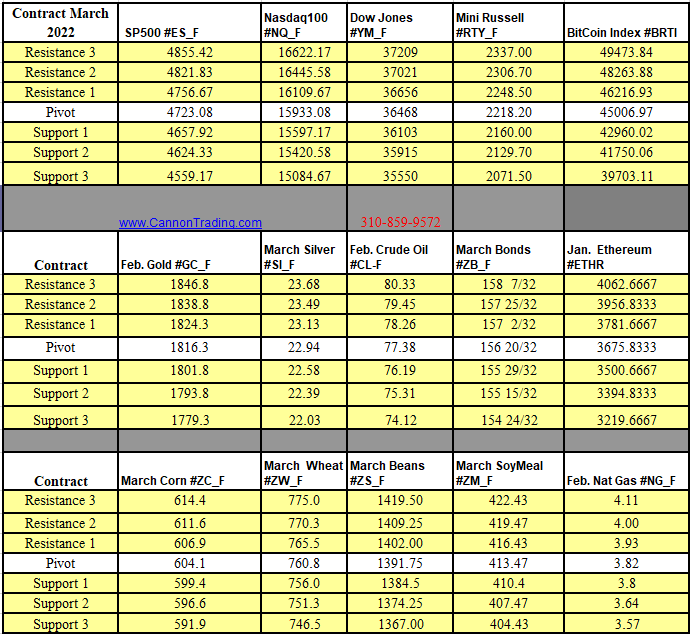
Futures Trading Levels

01-06-2022

Support & Resistance Levels For 01.06.2022


Economic Reports, Source: 

https://bettertrader.co/ 

BetterTrader Reports 01.06.2022


Trading Futures, Options on Futures, and retail off-exchange foreign currency transactions involves substantial risk of loss and is not suitable for all investors.  You should carefully consider whether trading is suitable for you in light of your circumstances, knowledge, and financial resources. You may lose all or more of your initial investment. Opinions, market data, and recommendations are subject to change at any time when it comes to Futures Trading.

This is not a solicitation of any order to buy or sell, but a current market view provided by Cannon Trading Inc. Any statement of facts here in contained are derived from sources believed to be reliable, but are not guaranteed as to accuracy, nor they purport to be complete. No responsibility is assumed with respect to any such statement or with respect to any expression of opinion herein contained. Readers are urged to exercise their own judgement in trading.

Weekly Newsletter 1077: Adjust your Trading with Volatility & Futures Levels for the Week Ahead

Cannon Futures Weekly Letter Issue # 1077

Dear Traders,

Like us on FaceBook!
Get Real Time updates and market alerts on Twitter!


Trading 201: Adjust your Trading with Volatility

Unemployment report along with Omicron along with an already “very spicy markets” encouraged me to share some of the following pointers.
Hope it helps.
*While I have no idea were the market is going from day to day, minute to minute, week to week etc. I do know that in the past, some of the sharpest and largest rallies were short covering after a large sell off. More often than not market sell offs and volatility like we are seeing do not end up as V type of action but more like U or W when it is all said and done.
*Expect the unexpected…
* Have an idea of what you are looking to do, keep in mind possible risk and have a game plan. Now more than ever, plan your trade and than trade your plan!
* Think money management, hedging risk while you are still trying to figure out how to profit.
* Know what is going on, reports, current margins, current limits and more.
  • Consider short term options instead of futures and/or MICROS
*Trade smaller. The bands are much larger. Watch the VIX.
* DO NOT assume anything…if you are not sure, contact us and we will try our best to assist with the combined, vast experience we have here as a team.
* Wash hands, take this seriously and do your best to stay healthy….
My colleague, John Thorpe, Ex floor broker, contributed the following on the VIX and the VVIX:
We recommend all stock indices intraday traders to keep an eye on the VIX for directional clues and study, many of you have access through other means to view this critical trading barometer, VIX now trades 5 days per week ,23 hours per day. if you need to add the VIX data to your trading platforms , it’s 3 bucks per month, penny wise and pound foolish if you don’t. Contact your broker on how to add the Volatility Index traded through the CBOE to your trading platform
6541ee95 dd57 4414 bd0f 3a1de7e5be19

Good Trading

Trading Futures, Options on Futures, and retail off-exchange foreign currency transactions involves substantial risk of loss and is not suitable for all investors.  You should carefully consider whether trading is suitable for you in light of your circumstances, knowledge, and financial resources. You may lose all or more of your initial investment. Opinions, market data, and recommendations are subject to change at any time when it comes to Futures Trading.


Futures Trading Levels

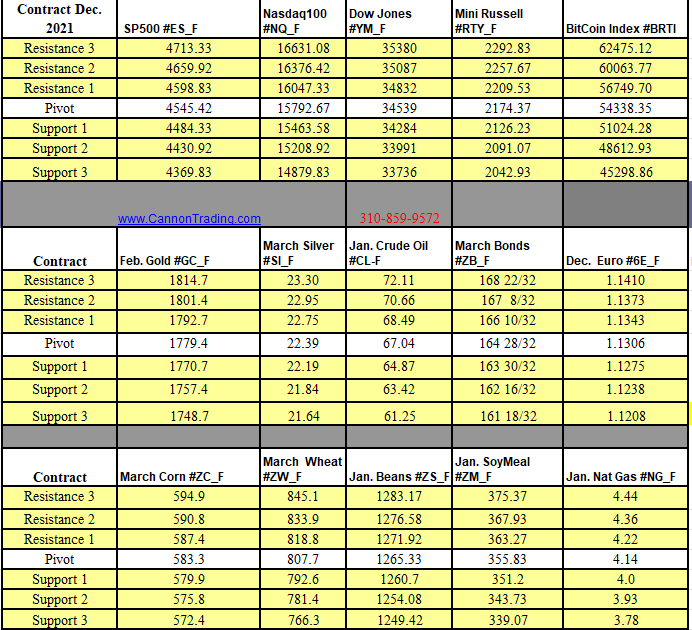
12.05.2021

Futures Trading Support & Resistance Levels 12.05.2021


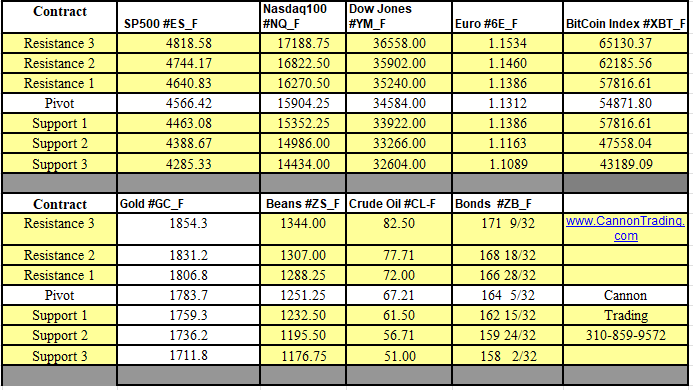
Weekly Levels

Futures Trading Support & Resistance Weekly Levels


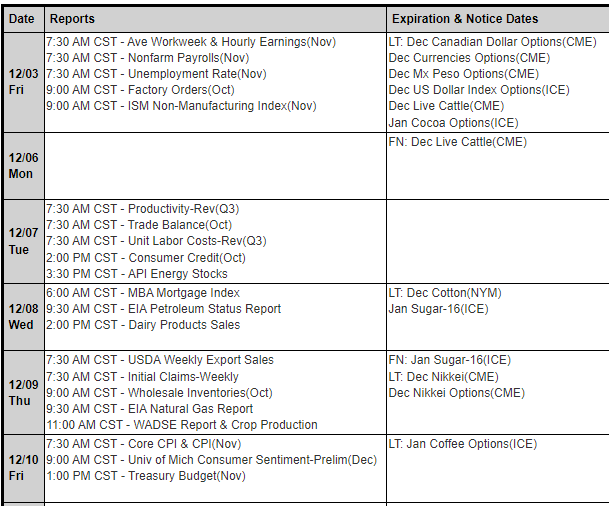
Reports, First Notice (FN), Last trading (LT) Days for the Week:

https://mrci.com

Date Reports/Expiration Notice Dates

MRCI Reports

This is not a solicitation of any order to buy or sell, but a current market view provided by Cannon Trading Inc. Any statement of facts here in contained are derived from sources believed to be reliable, but are not guaranteed as to accuracy, nor they purport to be complete. No responsibility is assumed with respect to any such statement or with respect to any expression of opinion herein contained. Readers are urged to exercise their own judgement in trading

VIX Volatility futures Index & Support and Resistance Levels 10.20.2021

Dear Traders,

Get Real Time updates and more on our private FB group!
🙂

Correlational Observations of Indices Market Behavior.

VIX Volatility futures Index.
By John Thorpe, Senior Broker
VIX futures expiration is a monthly occurrence. The expiration is somewhat varied, the remaining 2021 schedule is included below, typically, middle of the month on Wednesday mornings. Take a look at your daily chart for any of the indices and you see the sell offs during the week of or the week prior to VIX
 expiration days.
My belief is there would be a smaller probability of a correlational relationship during a Bear stock market, However, Since we are in the 12th year of a bull market, I believe the underling price action is created by portfolio managers rolling their hedges and adjusting their risk for the coming month. They often use the week prior to Short the VIX at higher prices (lower equity index prices) for the first week of the new VIX contract month as they are buying back their old contract shorts pushing the VIX prices higher, thereby pushing negative sentiment into the marketplace. If there are more extreme price movements in their favor, they will elect to have the hedges expire to cash as the contracts are financially settled.
Coincidentally, September VIX expired Wednesday morning September 15th at 8:00 a.m. CDT and the October VIX expires in 10 days.
dc8ffd4a 8bf1 4dfe b324 cebe8c4575c4
You can trade both the VIX and Equity index futures with multiple leverage options, Reach out to your Cannon Trading representative for more details.
Here is a VIX contract description from the CBOE “
The CBOE Volatility Index – more commonly referred to as the “VIX Index” – is an up-to-the-minute market estimate of expected volatility that is calculated by using real-time prices of options on the S&P 500® Index listed on CBOE Exchange, Inc. (“CBOE Options”) (Symbol: SPX). Only SPX options with Friday expirations are used to calculate the VIX Index. The VIX Index is calculated between 2:15 a.m. CT and 8:15 a.m. CT and between 8:30 a.m. CT and 3:15 p.m. CT. Only SPX options with more than 23 days and less than 37 days to the Friday SPX expiration are used to calculate the VIX Index. These SPX options are then weighted to yield a constant, 30-day measure of the expected volatility of the S&P 500 Index”
The above is the opinion of John Thorpe, Cannon’s broker since 2002. Do your homework, take a look at charts, see if you can find any correlations and understand that this is provided as trading insight/ opinion and readers are urged to use their own due diligence.
Trading Futures, Options on Futures, and retail off-exchange foreign currency transactions involves substantial risk of loss and is not suitable for all investors. You should carefully consider whether trading is suitable for you in light of your circumstances, knowledge, and financial resources. You may lose all or more of your initial investment. Opinions, market data, and recommendations are subject to change at any time when it comes to Futures Trading.

Good Trading

Trading Futures, Options on Futures, and retail off-exchange foreign currency transactions involves substantial risk of loss and is not suitable for all investors.  You should carefully consider whether trading is suitable for you in light of your circumstances, knowledge, and financial resources. You may lose all or more of your initial investment. Opinions, market data, and recommendations are subject to change at any time when it comes to Futures Trading.


Futures Trading Levels

10-20-2020

42af01bc 60a1 4cd8 a47f 675de37818b6


Economic Reports, source: 

https://bettertrader.co/ 

833cba6a 2b06 466d 8c46 790c6d7c2c76


This is not a solicitation of any order to buy or sell, but a current market view provided by Cannon Trading Inc. Any statement of facts here in contained are derived from sources believed to be reliable, but are not guaranteed as to accuracy, nor they purport to be complete. No responsibility is assumed with respect to any such statement or with respect to any expression of opinion herein contained. Readers are urged to exercise their own judgement in trading.

VIX Volatility futures Index & Support and Resistance Levels 10.12.2021

Dear Traders,

Get Real Time updates and more on our private FB group!
🙂

Correlational Observations of Indices Market Behavior.

VIX Volatility futures Index.

By John Thorpe, Senior Broker
VIX futures expiration is a monthly occurrence. The expiration is somewhat varied, the remaining 2021 schedule is included below, typically, middle of the month on Wednesday mornings. Take a look at your daily chart for any of the indices and you see the sell offs during the week of or the week prior to VIX
 expiration days.
My belief is there would be a smaller probability of a correlational relationship during a Bear stock market, However, Since we are in the 12th year of a bull market, I believe the underling price action is created by portfolio managers rolling their hedges and adjusting their risk for the coming month. They often use the week prior to Short the VIX at higher prices (lower equity index prices) for the first week of the new VIX contract month as they are buying back their old contract shorts pushing the VIX prices higher, thereby pushing negative sentiment into the marketplace. If there are more extreme price movements in their favor, they will elect to have the hedges expire to cash as the contracts are financially settled.
Coincidentally, September VIX expired Wednesday morning September 15th at 8:00 a.m. CDT and the October VIX expires in 10 days.
dc8ffd4a 8bf1 4dfe b324 cebe8c4575c4
You can trade both the VIX and Equity index futures with multiple leverage options, Reach out to your Cannon Trading representative for more details.
Here is a VIX contract description from the CBOE “
The CBOE Volatility Index – more commonly referred to as the “VIX Index” – is an up-to-the-minute market estimate of expected volatility that is calculated by using real-time prices of options on the S&P 500® Index listed on CBOE Exchange, Inc. (“CBOE Options”) (Symbol: SPX). Only SPX options with Friday expirations are used to calculate the VIX Index. The VIX Index is calculated between 2:15 a.m. CT and 8:15 a.m. CT and between 8:30 a.m. CT and 3:15 p.m. CT. Only SPX options with more than 23 days and less than 37 days to the Friday SPX expiration are used to calculate the VIX Index. These SPX options are then weighted to yield a constant, 30-day measure of the expected volatility of the S&P 500 Index”
The above is the opinion of John Thorpe, Cannon’s broker since 2002. Do your homework, take a look at charts, see if you can find any correlations and understand that this is provided as trading insight/ opinion and readers are urged to use their own due diligence.
Trading Futures, Options on Futures, and retail off-exchange foreign currency transactions involves substantial risk of loss and is not suitable for all investors. You should carefully consider whether trading is suitable for you in light of your circumstances, knowledge, and financial resources. You may lose all or more of your initial investment. Opinions, market data, and recommendations are subject to change at any time when it comes to Futures Trading.

Good Trading

Trading Futures, Options on Futures, and retail off-exchange foreign currency transactions involves substantial risk of loss and is not suitable for all investors.  You should carefully consider whether trading is suitable for you in light of your circumstances, knowledge, and financial resources. You may lose all or more of your initial investment. Opinions, market data, and recommendations are subject to change at any time when it comes to Futures Trading.


Futures Trading Levels

10-12-2020

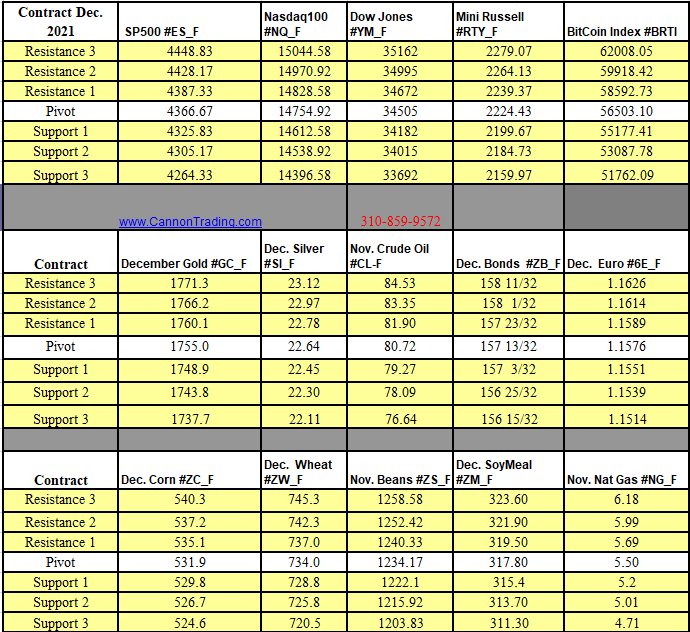
Futures Trading Levels 10.12.2021


Economic Reports, source: 

https://bettertrader.co/ 

0affd92b f2a2 4a17 baed 938d01e8afe7


This is not a solicitation of any order to buy or sell, but a current market view provided by Cannon Trading Inc. Any statement of facts here in contained are derived from sources believed to be reliable, but are not guaranteed as to accuracy, nor they purport to be complete. No responsibility is assumed with respect to any such statement or with respect to any expression of opinion herein contained. Readers are urged to exercise their own judgement in trading.