Weekly Newsletter: WTI Crude Futures Trading Challenge + Trading Levels 3.20.2023

Cannon Futures Weekly Newsletter Issue # 1138


Join our private Facebook group for additional insight into trading and the futures markets!

In this issue:

  • Important Notices – WTI Crude Futures Trading Challenge
  • Trading Resource of the Week – Live Breaking News Audio Service
  • Hot Market of the Week – April Gold
  • Broker’s Trading System of the Week
  • Trading Levels for Next Week
  • Trading Reports for Next Week


  • Important Notices – WTI Futures Trading Challenge

WTI Futures Trading Challenge
March 26-31, 2023
The global benchmark for crude oil is fabulous at 40
Take part in our special Trading Challenge to honor the 40th anniversary of WTI Crude Oil futures. Practice trading in a simulated environment with the most liquid crude oil futures benchmark in the world. Use our established, time-tested market with around-the-clock liquidity and global participation as you get to know our suite of WTI contracts in a risk-free environment that mimics live markets.
Learn why WTI has amassed worldwide interest
Have a gas as you explore WTI futures and simulate trading with the world’s most liquid oil contract. Receive daily education lessons from CME Group’s Owain Johnson, Managing Director of Research and Product Development. Gain valuable experience in a simulated environment while competing for a top spot.
Prizes for eligible participants
The top three finishers for this challenge will earn cash prizes. The top 40 finishers will also receive a complimentary copy of the recent book written by Owain Johnson, titled 40 Classic Crude Oil Trades.
This competition is open to residents in the United States (US), Canada (CA) excluding Quebec, *Brazil (BR), United Kingdom (UK), Germany (DE), Netherlands (NL), Switzerland (CH), Republic of Korea (KR), Taiwan (TW), and Japan (JP).
*Residents of Brazil must have a bank account in the United States to be eligible to receive a prize.


  • Trading Resource of the Week

  • Futures Market Squawk Box Features
  • Up to the second trading information
  • Informative streaming audio for accurate price and volume data
  • Firsthand knowledge that was once only available to floor traders
  • Expertise regarding buyers and sellers and how the market reacts
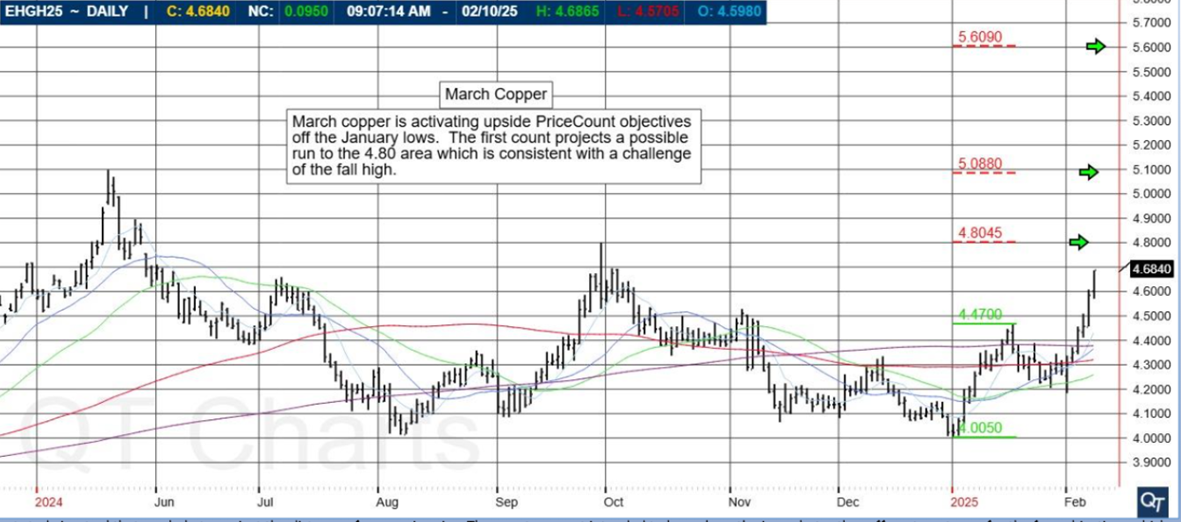
Hot market of the week is provided by QT Market Center, A swiss army knife charting package that’s not just for Hedgers, Cooperatives and Farmers alike but also for Spread traders, Swing traders and shorter time frame application for intraday traders with a unique proprietary indicator that can be applied to your specific trading needs.
PriceCounts – Not about where we’ve been , but where we might be going next!
April Gold: April gold corrected after completing the first upside PriceCount objective in January now the chart is threatening to resume its rally where a sustained high would project a run to the second count in the 2052 area
April Gold, #GC
The PriceCount study is a tool that can help to project the distance of a move in price. The counts are not intended to be an ‘exact’ science but rather offer a target area for the four objectives which are based off the first leg of a move with each subsequent count having a smaller percentage of being achieved. It is normal for the chart to react by correcting or consolidating at an objective and then either resuming its move or reversing trend. Best utilized in conjunction with other technical tools, PriceCounts offer one more way to analyze charts and help to manage your positions and risk. Learn more at www.qtchartoftheday.com
Trading in futures, options, securities, derivatives or OTC products entails significant risks which must be understood prior to trading and may not be appropriate for all investors. Past performance of actual trades or strategies is not necessarily indicative of future results.
3b644da2 2bee 4d39 8d98 5208a20bec39
With algorithmic trading systems becoming more prevalent in portfolio diversification, the following system has been selected as the broker’s choice for this month.
PRODUCT
SYSTEM TYPE
Swing
Recommended Cannon Trading Starting Capital
$25,000
COST
USD 70 / monthly
c7dfcf51 533e 4cc5 b207 1c78a691c89f
The performance shown above is hypothetical in that the chart represents returns in a model account. The model account rises or falls by the average single contract profit and loss achieved by clients trading actual money pursuant to the listed system’s trading signals on the appropriate dates (client fills), or if no actual client profit or loss available – by the hypothetical single contract profit and loss of trades generated by the system’s trading signals on that day in real time (real‐time) less slippage, or if no real time profit or loss available – by the hypothetical single contract profit and loss of trades generated by running the system logic backwards on back adjusted data. Please read full disclaimer HERE.
Sign Up for a Free Personalized Consultation with a Broker from Cannon Trading Company
Questions about the markets? trading? platforms? technology? trading systems? Get answers with a complimentary, confidential consultation with a Cannon Trading Company series 3 broker.
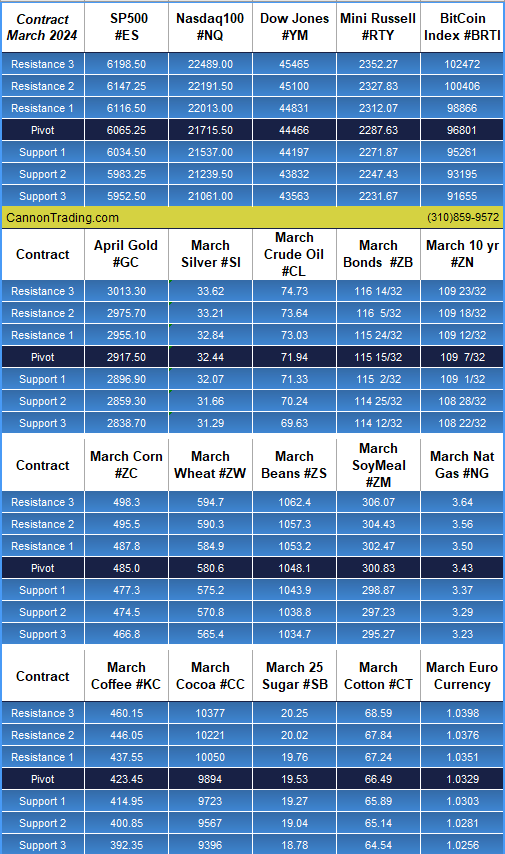
  • Trading Levels for Next Week

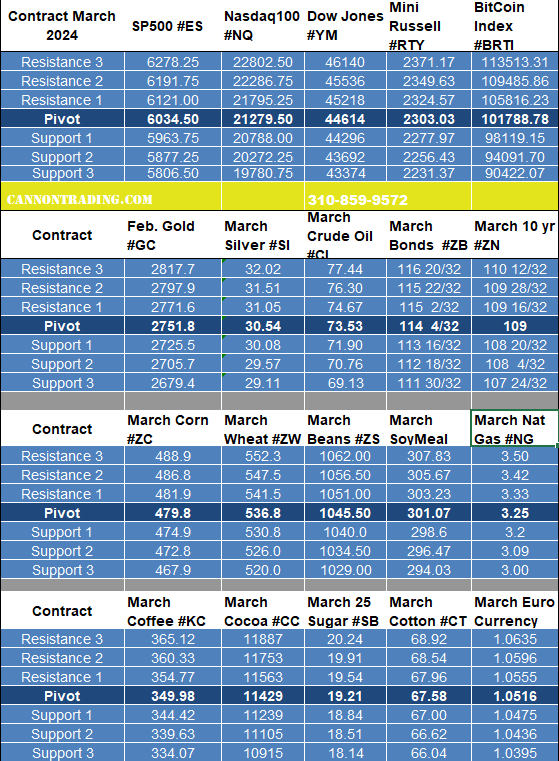
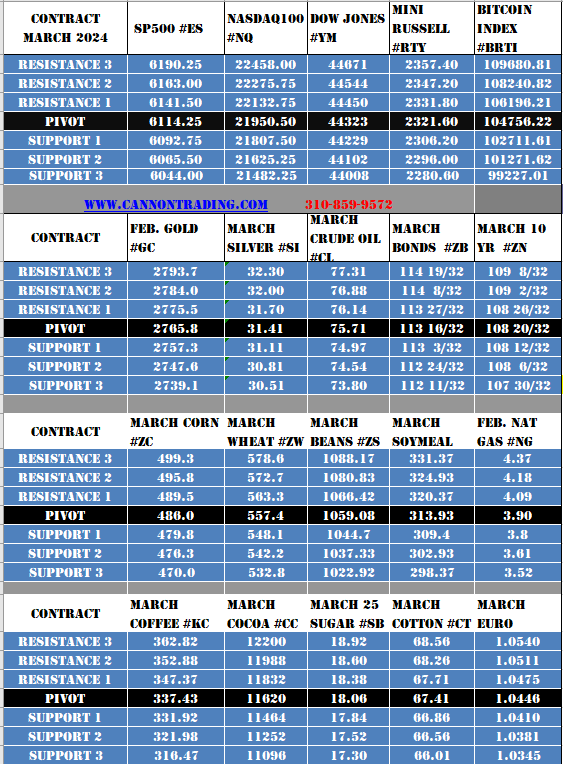
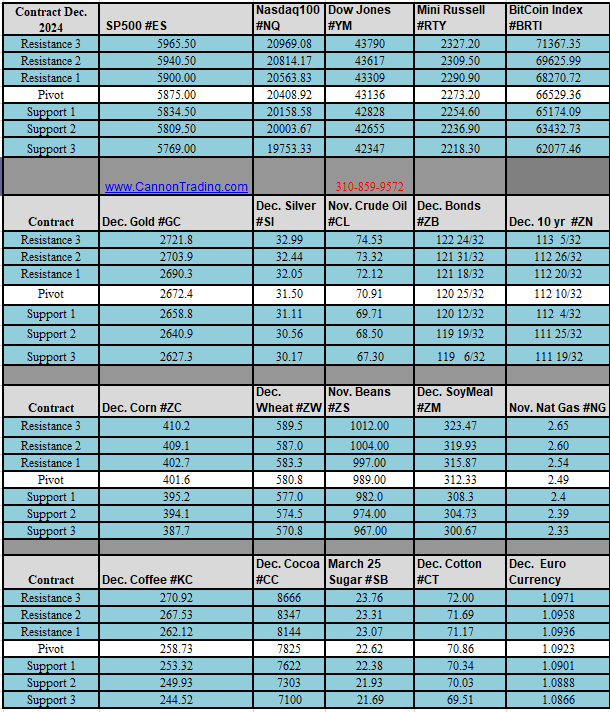
Daily Levels for March 20th, 2022
#ES, #NQ, #YM, #RTY, #XBT, #GC, #SI, #CL, #ZB, #6E, #ZC, #ZW, #ZS, #ZM, #NG

Weekly Levels

867b5377 4c3b 4788 979a 1cb8eda428f6


  • Trading Reports for Next Week

First Notice (FN), Last trading (LT) Days for the Week:
567ffcb2 2618 4274 ac96 47e938b6ce4c

This is not a solicitation of any order to buy or sell, but a current market view provided by Cannon Trading Inc. Any statement of facts herein contained are derived from sources believed to be reliable but are not guaranteed as to accuracy, nor they purport to be complete. No responsibility is assumed with respect to any such statement or with respect to any expression of opinion herein contained. Readers are urged to exercise their own judgment in trading

Volatility is HIGH + 03.16.2023 Trading Levels

Get Real Time updates and more on our private FB group!


Trade June indices as well as June currencies!

What Traders need to Know to Finish the Trading Week:

By Mark O’Brien, Senior broker


Crude oil futures prices plunged more than $5.50 a barrel intraday today – touching a low of $65.65 (basis April) – to their lowest in more than a year as news that Credit Suisse’s biggest shareholder, Saudi National Bank, said it would not make further investments in the firm, sending the Swiss lender’s stock plunging ±27% and adding to the already extreme turmoil in the banking sector from the collapse of Silicon Valley Bank and Signature Bank last week here in the U.S.

In turn, gold futures prices climbed over 1% intraday with the April contract topping $1,942.50 per ounce intraday, it’s highest price since early February. Conversely, Copper futures lost ±11 cents / pound – over 4% intraday – with the May futures contract touching $3.84 / lb. matching prices from early January and extending a near month-long ±40-cent / $10,000 decline.

Not surprisingly, with the banking sector hitting rough seas this last week, treasuries have once again assumed their safe-haven status with the 30-yr. T-bond futures contract soaring ±10 full basis points ±$10,000 over the last nine trading days to March 3 and sending the benchmark 10-year Treasury note yield tumbling to near 3.5%

Significant volatility looks to be the order of the day for the near term across the major financial futures sectors – stock indexes, interest rates, currencies – as well as metals and energies. Up next, the FOMC meeting this coming Tuesday/Wednesday.

Be Careful out there, Plan your trade and trade your plan!

A Cannon broker will be able to assist, provide feedback and answer any questions.

Trading Futures, Options on Futures, and retail off-exchange foreign currency transactions involves substantial risk of loss and is not suitable for all investors.  You should carefully consider whether trading is suitable for you in light of your circumstances, knowledge, and financial resources. You may lose all or more of your initial investment. Opinions, market data, and recommendations are subject to change at any time when it comes to Futures Trading.

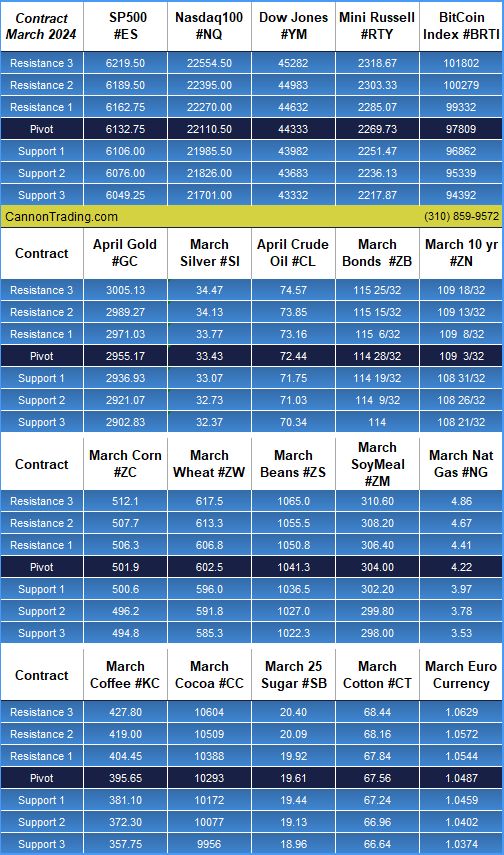
Futures Trading Levels

03-16-2023

#ES, #NQ, #YM, #RTY, #XBT, #GC, #SI, #CL, #ZB, #6E, #ZC, #ZW, #ZS, #ZM, #NG

3b644da2 2bee 4d39 8d98 5208a20bec39


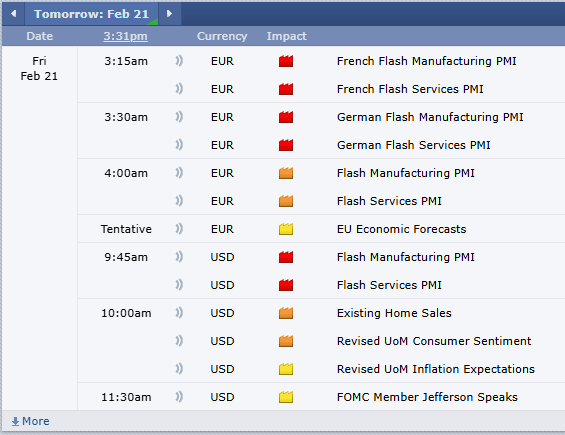
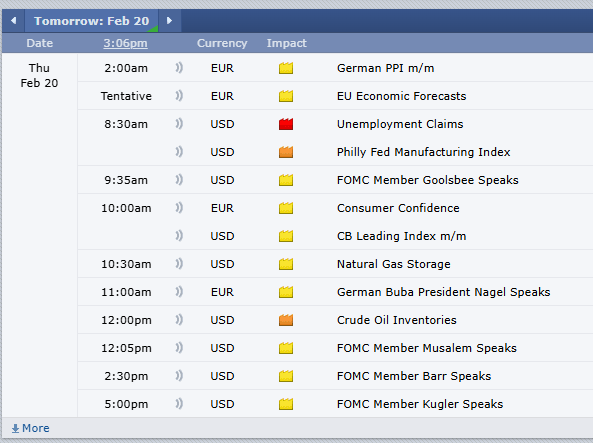
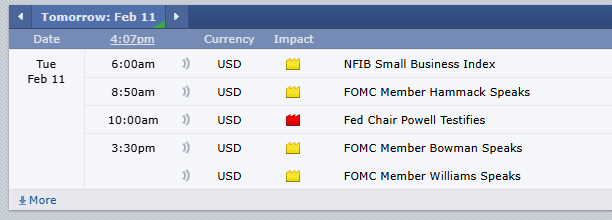
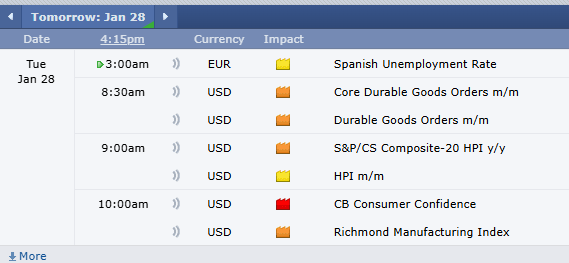
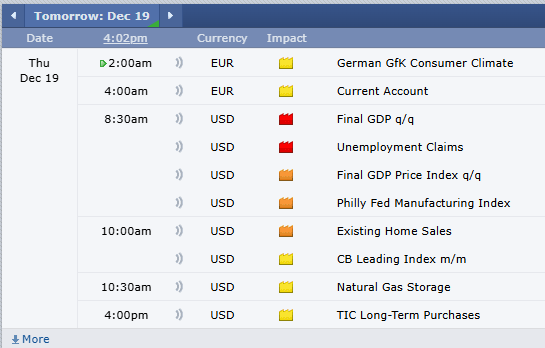
Economic Reports, Source: 

Forexfactory.com

dfb235f4 3edb 4209 a751 5e5c23c8e85a


This is not a solicitation of any order to buy or sell, but a current market view provided by Cannon Trading Inc. Any statement of facts here in contained are derived from sources believed to be reliable, but are not guaranteed as to accuracy, nor they purport to be complete. No responsibility is assumed with respect to any such statement or with respect to any expression of opinion herein contained. Readers are urged to exercise their own judgement in trading.

What’s left the Last 2 Trading days of the Week & Futures Levels 1.26.2023

Get Real Time updates and more on our private FB group!

The Week Ahead

By Mark O’Brien, Senior Broker


Grains / Soy complex: For Soybeans and corn interests, many eyes are on South America, where because their crop year runs counter to here in the U.S., large producers like Argentina and Brazil are approaching harvest. Brazil is set for a bumper soybean crop. Argentina is experiencing drought conditions which are more adversely affecting their corn crop than their soybeans. Traders believe the soybean crop can recover more significantly from the heat and drought as compared with the corn crop.

Gold & Silver: precious metals analysts often look to ETF holdings for guidance on gold and silver futures prices, eyeing inflows and outflows for developing patterns. To wit, both gold and silver ETF holdings are sitting above their levels at the start of the year

Energy: Crude oil traded to a 4-day low this A.M. The likely catalyst could be Chinese energy demand, which seems to be linked to COVID infection rates in that country, whish show little signs of peaking yet.  Support at $80.00 per barrel (March contract) looks vulnerable unless we see some confirmation of improving conditions inside China.

Plan your trade and trade your Plan 


Trading Futures, Options on Futures, and retail off-exchange foreign currency transactions involves substantial risk of loss and is not suitable for all investors.  You should carefully consider whether trading is suitable for you in light of your circumstances, knowledge, and financial resources. You may lose all or more of your initial investment. Opinions, market data, and recommendations are subject to change at any time when it comes to Futures Trading.

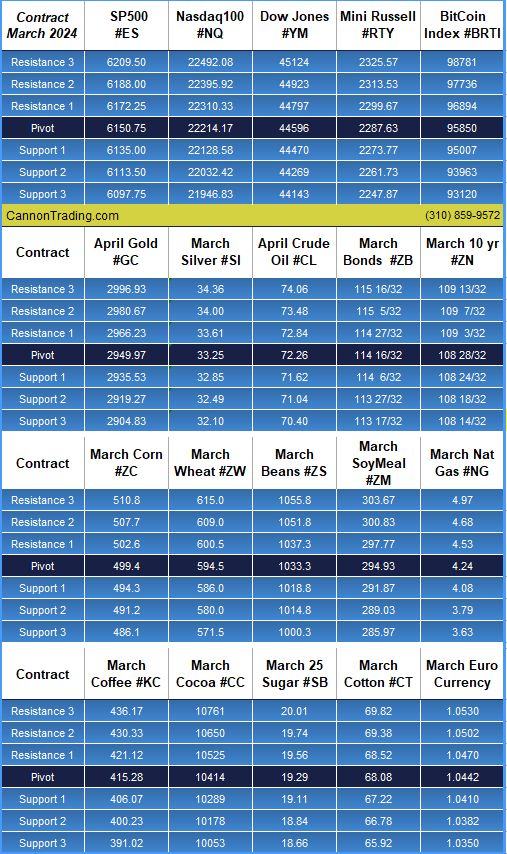
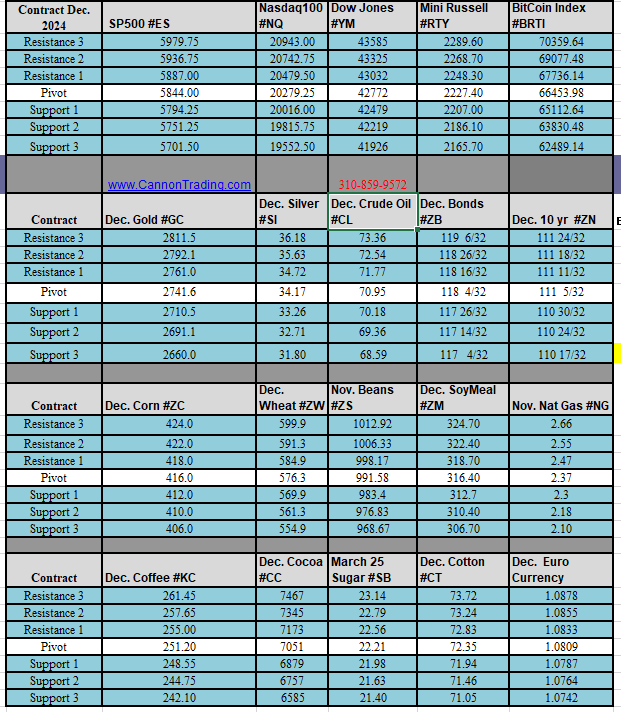
Futures Trading Levels

for 01-26-2023

#ES, #NQ, #YM, #RTY, #XBT, #GC, #SI, #CL, #ZB, #6E, #ZC, #ZW, #ZS, #ZM, #NG


4289d06c 59a6 4954 8056 f6dee9036f64

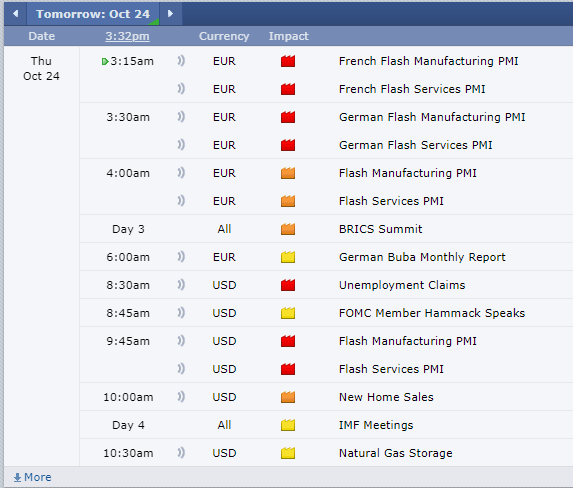
Economic Reports, Source: 

Forexfactory.com


6a48ee24 df2b 4406 8cbb 1262fe3e5d04

This is not a solicitation of any order to buy or sell, but a current market view provided by Cannon Trading Inc. Any statement of facts here in contained are derived from sources believed to be reliable, but are not guaranteed as to accuracy, nor they purport to be complete. No responsibility is assumed with respect to any such statement or with respect to any expression of opinion herein contained. Readers are urged to exercise their own judgement in trading.

Weekly Newsletter – Hogs Spread Idea, Holiday Schedule + Levels for 12.19.2022

Cannon Futures Weekly Newsletter Issue # 1126


Join our private Facebook group for additional insight into trading and the futures markets!

In this issue:
  • Important Notices – Holiday Trading Schedules
  • Trading Resource of the Week -Moore Research Center Inc.
  • Hot Market of the Week – ?
  • Broker’s Trading System of the Week
  • Trading Levels for Next Week
  • Important Notices – Christmas and New year’s Trading Schedules

  • Trading Resource of the Week

Here’s a futures spread idea from our friends at Moore Research ( FREE TRIAL ESPECIALLY for Cannon’s clients and blog readers!). This is a calendar spread in lean hogs. Moore Research specializes in seasonal research designed to anticipate future price movement rather than constantly react to an endless stream of news. Like the annual cycle of weather from warm to cold and back to warm, annual cycles in supply and demand can produce seasonal price movement. This calendar spread in lean hogs is an idea in that concept. Retail pork consumption peaks around July/August, at the tail end of the low point in slaughter. With cold storage inventories reduced by end of August and slaughter still low, the market bids October futures higher over April, when stocks near their peak. Contact your Cannon Broker for additional assistance.
f2727f85 38ee 46c5 a90a dec031fb07b9
Performance Snapshot
Below is a performance snapshot of the seasonal trend for each of the last 15 years. You can find average gain/loss, best/worst equity (based on one futures spread contract), and more.
bbc6e569 5043 415f a90e 918827dc92a8
A Cannon broker will be able to assist, provide feedback and answer any questions about spreads, seasonal tendencies, options and MUCH MORE!
Futures trading involves a substantial risk of loss and may not be suitable for all investors. Trading advice is based on information taken from trade and statistical services and other sources Cannon Trading believes are reliable. We do not guarantee that such information is accurate or complete, and it should not be relied upon as such. Trading advice reflects our good faith judgment at a specific time and is subject to change without notice. There is no guarantee that the advice we give will result in profitable trades. All trading decisions will be made by the account holder. Past performance is not necessarily indicative of future results.
SEASONAL TENDENCIES ARE A COMPOSITE OF SOME OF THE MORE CONSISTENT COMMODITY FUTURES SEASONALS THAT HAVE OCCURRED OVER THE PAST 15 YEARS. THERE ARE USUALLY UNDERLYING FUNDAMENTAL CIRCUMSTANCES THAT OCCUR ANNUALLY THAT TEND TO CAUSE THE FUTURES MARKETS TO REACT IN A SIMILAR DIRECTIONAL MANNER DURING A CERTAIN CALENDAR PERIOD OF THE YEAR. EVEN IF A SEASONAL TENDENCY OCCURS IN THE FUTURE, IT MAY NOT RESULT IN A PROFITABLE TRANSACTION AS FEES, AND THE TIMING OF THE ENTRY AND LIQUIDATION MAY IMPACT ON THE RESULTS. NO REPRESENTATION IS BEING MADE THAT ANY ACCOUNT HAS IN THE PAST OR WILL IN THE FUTURE ACHIEVE PROFITS UTILIZING THESE STRATEGIES. NO REPRESENTATION IS BEING MADE THAT PRICE PATTERNS WILL RECUR IN THE FUTURE. HYPOTHETICAL PERFORMANCE RESULTS HAVE MANY INHERENT LIMITATIONS, SOME OF WHICH ARE DESCRIBED BELOW. NO REPRESENTATION IS BEING MADE THAT ANY ACCOUNT WILL OR IS LIKELY TO ACHIEVE PROFITS OR LOSSES SIMILAR TO THOSE SHOWN. IN FACT, THERE ARE FREQUENTLY SHARP DIFFERENCES BETWEEN HYPOTHETICAL PERFORMANCE RESULTS AND THE ACTUAL RESULTS SUBSEQUENTLY ACHIEVED BY ANY PARTICULAR TRADING PROGRAM. ONE OF THE LIMITATIONS OF HYPOTHETICAL PERFORMANCE RESULTS IS THAT THEY ARE GENERALLY PREPARED WITH THE BENEFIT OF HINDSIGHT. IN ADDITION, HYPOTHETICAL TRADING DOES NOT INVOLVE FINANCIAL RISK, AND NO HYPOTHETICAL TRADING RECORD CAN COMPLETELY ACCOUNT FOR THE IMPACT OF FINANCIAL RISK IN ACTUAL TRADING. FOR EXAMPLE, THE ABILITY TO WITHSTAND LOSSES OR ADHERE TO A PARTICULAR TRADING PROGRAM IN SPITE OF TRADING LOSSES ARE MATERIAL POINTS WHICH CAN ALSO ADVERSELY AFFECT ACTUAL TRADING RESULTS. THERE ARE NUMEROUS OTHER FACTORS RELATED TO THE MARKETS IN GENERAL OR TO THE IMPLEMENTATION OF ANY SPECIFIC TRADING PROGRAM WHICH CANNOT BE FULLY ACCOUNTED FOR IN THE PREPARATION OF HYPOTHETICAL PERFORMANCE RESULTS AND ALL OF WHICH CAN ADVERSELY AFFECT ACTUAL TRADING RESULTS. RESULTS NOT ADJUSTED FOR COMMISSION AND SLIPPAGE.
368db221 6c82 4b49 9336 1ad2496cfaa4
    • Hot market of the week is provided by QT Market Center, A swiss army knife charting package that’s not just for Hedgers, Cooperatives and Farmers alike but also for Spread traders, Swing traders and shorter time frame application for intraday traders with a unique proprietary indicator that can be applied to your specific trading needs.
      PriceCounts – Not about where we’ve been , but where we might be going next!

3415e605 4c19 4018 84f5 3fe5f71d8c13

The PriceCount study is a tool that can help to project the distance of a move in price. The counts are not intended to be an ‘exact’ science but rather offer a target area for the four objectives which are based off the first leg of a move with each subsequent count having a smaller percentage of being achieved. It is normal for the chart to react by correcting or consolidating at an objective and then either resuming its move or reversing trend. Best utilized in conjunction with other technical tools, PriceCounts offer one more way to analyze charts and help to manage your positions and risk. Learn more at www.qtchartoftheday.com
Trading in futures, options, securities, derivatives or OTC products entails significant risks which must be understood prior to trading and may not be appropriate for all investors. Past performance of actual trades or strategies is not necessarily indicative of future results.
3b644da2 2bee 4d39 8d98 5208a20bec39


With algorithmic trading systems becoming more prevalent in portfolio diversification, the following system has been selected as the broker’s choice for this month.
PRODUCT
SYSTEM TYPE
Swing
Recommended Cannon Trading Starting Capital
$30,000
COST
USD 65 / monthly
c5bf5f67 0495 48ba aa99 d51d46083d3f
The performance shown above is hypothetical in that the chart represents returns in a model account. The model account rises or falls by the average single contract profit and loss achieved by clients trading actual money pursuant to the listed system’s trading signals on the appropriate dates (client fills), or if no actual client profit or loss available – by the hypothetical single contract profit and loss of trades generated by the system’s trading signals on that day in real time (real‐time) less slippage, or if no real time profit or loss available – by the hypothetical single contract profit and loss of trades generated by running the system logic backwards on back adjusted data. Please read full disclaimer HERE.
Sign Up for a Free Personalized Consultation with a Broker from Cannon Trading Company
Questions about the markets? trading? platforms? technology? trading systems? Get answers with a complimentary, confidential consultation with a Cannon Trading Company series 3 broker.
  • Trading Levels for Next Week

Daily Levels for December 19th

24e4e4c1 fb0b 4a00 926e 2d4ec53319da

Weekly Levels

a522e5f3 9a99 4c75 b97e c53638b3cde7


  • Trading Reports for Next Week

First Notice (FN), Last trading (LT) Days for the Week:
8783ac7b 9edc 4f28 af83 42f971fcd304

This is not a solicitation of any order to buy or sell, but a current market view provided by Cannon Trading Inc. Any statement of facts herein contained are derived from sources believed to be reliable but are not guaranteed as to accuracy, nor they purport to be complete. No responsibility is assumed with respect to any such statement or with respect to any expression of opinion herein contained. Readers are urged to exercise their own judgment in trading

Weekly Newsletter – Trading Resources and more! 12.05.2022

Cannon Futures Weekly Newsletter Issue # 1124


Join our private Facebook group for additional insight into trading and the futures markets!

In this issue:
  • Trading Resource of the Week
  • Hot Market of the Week
  • Broker’s Trading System of the Week
  • Trading Levels for Next Week
  • Trading Reports for Next Week


  • Trading Resource of the Week

If you traded recently while Powell was speaking, perhaps during a CPI report or even more so as NFP (non farm payrolls) numbers come out – YOU KNOW HOW IMPORTANT THESE NEWS ITEMS ARE!!
TRADETHENEWS.COM IS A SERVICE WHICH PROVIDES BREAKING NEWS VIA AUDIO AND TEXT. INSIGHT INTO HOW THE MARKET IS REACTING AND MANY OTHER VALUABLE TOOLS!
The First
To provide audio news squawks in 1998.
Entering our second decade of market
moving analysis.
Depth of Coverage
Professional analysts broadcasting 24 hrs
for American, European and
Asian markets.
Speed
Analyst teams are recognized
globally as the fastest source
for market intelligence.
Diverse Platform Offerings
Audio, text headlines, calendars and ability to ask questions to analysts live through platform.
Unbiased Insight
Completely independent – Unlike other services,
Trade The News is not backed by any trading firm.
Confidence
Extensive 10+ year proprietary databases
that allow analysts to back check news instantly to prevent errors.

  • Hot Market of the Week – Feb Gold

Hot market of the week is provided by QT Market Center, A swiss army knife charting package that’s not just for Hedgers, Cooperatives and Farmers alike but also for Spread traders, Swing traders and shorter time frame application for intraday traders with a unique proprietary indicator that can be applied to your specific trading needs.
PriceCounts – Not about where we’ve been , but where we might be going next!
78d37c69 f156 4e62 acf9 db8b2b473e96

The PriceCount study is a tool that can help to project the distance of a move in price. The counts are not intended to be an ‘exact’ science but rather offer a target area for the four objectives which are based off the first leg of a move with each subsequent count having a smaller percentage of being achieved. It is normal for the chart to react by correcting or consolidating at an objective and then either resuming its move or reversing trend. Best utilized in conjunction with other technical tools, PriceCounts offer one more way to analyze charts and help to manage your positions and risk. Learn more at www.qtchartoftheday.com
Trading in futures, options, securities, derivatives or OTC products entails significant risks which must be understood prior to trading and may not be appropriate for all investors. Past performance of actual trades or strategies is not necessarily indicative of future results.
  • Broker’s Trading System of the Week

With algorithmic trading systems becoming more prevalent in portfolio diversification, the following system has been selected as the broker’s choice for this month.
PRODUCT
SYSTEM TYPE
Intraday
Recommended Cannon Trading Starting Capital
$10,000
COST
USD 175 / monthly
05bcd7da b165 4f0c ae8e 5f1c1f75d472
The performance shown above is hypothetical in that the chart represents returns in a model account. The model account rises or falls by the average single contract profit and loss achieved by clients trading actual money pursuant to the listed system’s trading signals on the appropriate dates (client fills), or if no actual client profit or loss available – by the hypothetical single contract profit and loss of trades generated by the system’s trading signals on that day in real time (real‐time) less slippage, or if no real time profit or loss available – by the hypothetical single contract profit and loss of trades generated by running the system logic backwards on back adjusted data. Please read full disclaimer HERE.
Sign Up for a Free Personalized Consultation with a Broker from Cannon Trading Company
Questions about the markets? trading? platforms? technology? trading systems? Get answers with a complimentary, confidential consultation with a Cannon Trading Company series 3 broker.


  • Trading Levels for Next Week

Daily Levels for December 5th

3d7c78a3 8bdb 4152 8e75 6417ac878ed6

Weekly Levels

9dc14f72 86ec 4707 9701 762252119f67


  • Trading Reports for Next Week

First Notice (FN), Last trading (LT) Days for the Week:
64bca280 4cc0 47c2 bfa6 ea9baf49bafa

This is not a solicitation of any order to buy or sell, but a current market view provided by Cannon Trading Inc. Any statement of facts herein contained are derived from sources believed to be reliable but are not guaranteed as to accuracy, nor they purport to be complete. No responsibility is assumed with respect to any such statement or with respect to any expression of opinion herein contained. Readers are urged to exercise their own judgment in trading

Trading levels for 11.30.2022, Reports & More!

Get Real Time updates and more on our private FB group!

Start trading March grains, March silver, March bonds and other interest rates, February gold. First notice day is Wednesday.

Tomorrow is also the last trading day of the month – busy day with different reports and Fed’s Powell speaking..

A Cannon broker will be able to assist, provide feedback and answer any questions.

Trading Futures, Options on Futures, and retail off-exchange foreign currency transactions involves substantial risk of loss and is not suitable for all investors.  You should carefully consider whether trading is suitable for you in light of your circumstances, knowledge, and financial resources. You may lose all or more of your initial investment. Opinions, market data, and recommendations are subject to change at any time when it comes to Futures Trading.

Futures Trading Levels

for 11-30-2022

#goldfutures #sp500futures #crudeoilfutures # nasdaqfutures #dowfutures #futurestrading #futuresbrokers
SP500 #ES_FNasdaq100  #NQ_FDow Jones  #YM_FMini Russell #RTY_FBitCoin Index #BRTI SP500 Dec. Gold #GC_F Dec. Silver #SI_F Oct. Crude Oil #CL-F Dec. Bonds  #ZB_F Dec. 10 yr  #ZN_F Dec. Corn #ZC_F Dec.  Wheat #ZW_F Nov. Beans #ZS_F Dec. SoyMeal #ZM_F Oct. Nat Gas #NG_F Dec. Coffee #KC_F Dec. Cocoa #CC_F October Sugar #SB_F Dec. Cotton #CT_F Sept.  Euro Currency


Economic Reports, Source: 

Forexfactory.com

f7e3e62f 0168 4955 98fd b32bb83a977f

This is not a solicitation of any order to buy or sell, but a current market view provided by Cannon Trading Inc. Any statement of facts here in contained are derived from sources believed to be reliable, but are not guaranteed as to accuracy, nor they purport to be complete. No responsibility is assumed with respect to any such statement or with respect to any expression of opinion herein contained. Readers are urged to exercise their own judgement in trading.

Gold Looking For Attention + Trading levels for 11.15.2022

Get Real Time updates and more on our private FB group!

PPI final this week!

Gold may again be on the March.

By John Thorpe, Senior Broker

Recently we have had a bit of a breakout in the spot gold contract prices traded through our platforms and the CME/Nymex. The contract is a 100 troy oz deliverable contract GCZ22. There are also , smaller sized contracts, Micro’s MGCZ22 10 troy ounces and Mini’s QOZ22 50 troy ounces Financially settled.  These contracts offer not only a great day trading tool but also a wonderful way to control an interest in a tangible asset class. Much has been, currently is and will continue to be written about Gold as a hedge during times of uncertainty. How prices will move as an effect of whatever the cause will always be open for debate.

From Executive order 6102 signed in 1933, President Franklin Roosevelt forbid the hoarding of gold coin, bullion and certificates to the initiation of the gold standard from the 1944 Bretton Woods agreement, to Nixon’s “temporary” suspension of the dollar’s convertibility into gold in 1972, Global Governmental policy has often interceded in the convertibility of the U.S. Dollar and the value of gold in the past 100 + years. Wherever the price of gold has been or where it is currently headed, there is no doubt that it remains a valuable asset class of it’s own so it does bear to watch the price closely as it appears to be breaking from a long slumber.  In the short run I see Dec 22 and Feb 23 gold prices needing to test lower levels around 1738 1744 respectively, before this market, if a breakout is in the cards, will develop into a true upside breakout and in fact, will test multi year highs. Personally, I believe the fundamentals aren’t quite right for a big move from here, but the technical indicators certainly are screaming “look at me”, for now I will watch and wait.


Daily chart for your review below.

Plan your trade and trade your plan.

#GC; Daily Gold Futures Chart
Daily Gold Futures Chart

Trading Futures, Options on Futures, and retail off-exchange foreign currency transactions involves substantial risk of loss and is not suitable for all investors.  You should carefully consider whether trading is suitable for you in light of your circumstances, knowledge, and financial resources. You may lose all or more of your initial investment. Opinions, market data, and recommendations are subject to change at any time when it comes to Futures Trading.

Futures Trading Levels

for 11-15-2022

#goldfutures #sp500futures #crudeoilfutures # nasdaqfutures #dowfutures #futurestrading #futuresbrokers
SP500 #ES_FNasdaq100  #NQ_FDow Jones  #YM_FMini Russell #RTY_FBitCoin Index #BRTI SP500 Dec. Gold #GC_F Dec. Silver #SI_F Oct. Crude Oil #CL-F Dec. Bonds  #ZB_F Dec. 10 yr  #ZN_F Dec. Corn #ZC_F Dec.  Wheat #ZW_F Nov. Beans #ZS_F Dec. SoyMeal #ZM_F Oct. Nat Gas #NG_F Dec. Coffee #KC_F Dec. Cocoa #CC_F October Sugar #SB_F Dec. Cotton #CT_F Sept.  Euro Currency


Economic Reports, Source: 

Forexfactory.com

8da066cb 26da 494d 9616 73e27d7b8100

This is not a solicitation of any order to buy or sell, but a current market view provided by Cannon Trading Inc. Any statement of facts here in contained are derived from sources believed to be reliable, but are not guaranteed as to accuracy, nor they purport to be complete. No responsibility is assumed with respect to any such statement or with respect to any expression of opinion herein contained. Readers are urged to exercise their own judgement in trading.

How to Trade “Consolidation Patterns” + Futures Trading Levels 6.28.2022

Get Real Time updates and more on our private FB group!

How to Trade “Consolidation Patterns”

By John Thorpe, Senior Broker
There are a number of consolidation patterns: sideways ranges(rectangles), upward or downward sloping patterns or “flags” , triangular or Pennants. Today I have found on the Continuous Daily Comex Gold chart to illustrate, several recent rectangle consolidation patterns. One recent rectangular consolidation with a false breakout followed by a confirmed breakout and one that is currently forming. A Consolidation rectangle pattern has clearly defined ranges defined by highs and lows that can be connected drawing horizontal lines.
Continuous Daily Comex Gold chart
The above chart reflects just this. There are three points of interest outside the two rectangles, on the first one from March to April there is an upside break out but on light volume, Rule #1. Breakouts must occur on a closing basis on heavier than normal volume. You should not trade the breakout move on lighter volume. #2 wait for a retest of the previous resistance or support line. You will notice the high volume day after the breakout was on a failure of the retest. Good for you! a win, you didn’t fall for the breakout.
And #3, On April 29 had you worked a sell GTC limit order at or around the retest level of 1917,1918,1919.00 (which you could have placed as early as April 25th) you would be short the breakout . Soon after, a new consolidation zone is created and we are still currently inside. You can see two bars outside the consolidation but NOT on a closing basis.
In Summary, look for one of these patterns which are some of the most common, Look for a high volume breakout and don’t get in until the market retests the previous support or resistance area, and try to manage your stop loss orders within the old consolidation areas!!
Important: Trading commodity futures and options involves a substantial risk of loss.
The recommendations contained in this letter are of opinion only and do not guarantee any profits.
Past performances are not necessarily indicative of future result

Trading Futures, Options on Futures, and retail off-exchange foreign currency transactions involves substantial risk of loss and is not suitable for all investors.  You should carefully consider whether trading is suitable for you in light of your circumstances, knowledge, and financial resources. You may lose all or more of your initial investment. Opinions, market data, and recommendations are subject to change at any time when it comes to Futures Trading.

Futures Trading Levels

06-28-2022


Futures Support & Resistance Levels 6.28.2022


Improve Your Trading Skills

Get access to proprietary indicators and trading methods, consult with an experienced broker
 1-800-454-9572 Explore trading methods. Register Here


Economic Reports, Source: 

Forexfactory.com


5f2fd5d2 14e9 4ca1 81a1 4acc9526d11d


This is not a solicitation of any order to buy or sell, but a current market view provided by Cannon Trading Inc. Any statement of facts here in contained are derived from sources believed to be reliable, but are not guaranteed as to accuracy, nor they purport to be complete. No responsibility is assumed with respect to any such statement or with respect to any expression of opinion herein contained. Readers are urged to exercise their own judgement in trading.

New Home Sales Tomorrow + Futures Trading Levels 6.24.2022

Get Real Time updates and more on our private FB group!

What You Need to Know Before Trading June 24th:

Energy: Crude oil prices, natural gas, heating oil and unleaded ( RBOB) all finished lower today after the weekly reports and entered a short term downtrend pattern according to to our indicators.
Crypto: Last Trading Day for June Bitcoin futures is this Friday, June 24th. These are financially settled (no physical delivery), but if you’re holding longer-term positions in the June contract, you need to roll your position over/forward to the new front month contract – July.
Financials/Stocks: New Home Sales tomorrow. Stocks been choppy with high intraday volatility.
Grains: Strong sell off ahead of July OPTIONS expiration tomorrow.
First Notice Day for grains is next Thursday, June 30. Avoid delivery and roll your positions! Front month for most grains is now September. U
Softs: Time to trade September Coffee, Cocoa, OJ. October Sugar and the most liquid month for cotton seems to be December!
Metals: Multiple “sell signals” across gold, silver, copper, platinum and palladium turned the sector into short term bearish. Be careful as these markets tend to be “moody”. Daily chart of Copper(in my opinion was the leader in the directional change in the complex ) below for your review.
Copper Futures Daily Chart

Trading Futures, Options on Futures, and retail off-exchange foreign currency transactions involves substantial risk of loss and is not suitable for all investors.  You should carefully consider whether trading is suitable for you in light of your circumstances, knowledge, and financial resources. You may lose all or more of your initial investment. Opinions, market data, and recommendations are subject to change at any time when it comes to Futures Trading.

Futures Trading Levels

06-24-2022

Futures Support Resistance Levels 6.24.2022


Improve Your Trading Skills

Get access to proprietary indicators and trading methods, consult with an experienced broker
 1-800-454-9572 Explore trading methods. Register Here


Economic Reports, Source: 

Forexfactory.com

587a06ea 8dfe 478f 92fe ad57ba49391d


This is not a solicitation of any order to buy or sell, but a current market view provided by Cannon Trading Inc. Any statement of facts here in contained are derived from sources believed to be reliable, but are not guaranteed as to accuracy, nor they purport to be complete. No responsibility is assumed with respect to any such statement or with respect to any expression of opinion herein contained. Readers are urged to exercise their own judgement in trading.

Gold Futures Outlook Part 2 & Support and Resistance Levels 4.19.2022

Get Real Time updates and more on our private FB group!

GOLD WATCH Part 2

By John Thorpe, Senior Broker
Last Wednesday on this Blog I highlighted the Gold market as a potential candidate to rally and has continued to.
From a technical perspective Gold Futures does look ready to test recent highs. there was clearly excitement today during the Hong Kong session and then again, follow through buying during the London session with todays high peaking at 9 a.m. NY time @2003.00 per troy ounce before retreating back during the London session to close up on the day but near the lower end of the days trading range.
IN MY OPINION, Today’s Globex session appears to tell the tale of a short term reversal as “Gravestone Doji ” inks the chart today signifying the potential to move this market back into the 1940.00 area the next few days, still staying above critical support of 1920.00 .
A correction could put us in a better position to hold longs closer to support potentially risking less of our capital.. Keep an eye on this market as it is truly ready for a large move one way or the other.
*Trading commodity futures and options involves substantial risk of loss.
The recommendations contained in this blog are of opinion only and do not guarantee any profits.
These are risky markets and only risk capital should be used. Past performance is not indicative of future results*
Gold Futures Daily Chart
804b69e5 235b 42bb 97f6 f17c789901fe
Contact us for a demo and/ or more information here!

Trading Futures, Options on Futures, and retail off-exchange foreign currency transactions involves substantial risk of loss and is not suitable for all investors.  You should carefully consider whether trading is suitable for you in light of your circumstances, knowledge, and financial resources. You may lose all or more of your initial investment. Opinions, market data, and recommendations are subject to change at any time when it comes to Futures Trading.

Futures Trading Levels

04-19-2022

Support and Resistance Levels 4.18.2022


Improve Your Trading Skills

Get access to proprietary indicators and trading methods, consult with an experienced broker
 1-800-454-9572 Explore trading methods. Register Here


Economic Reports, Source: 

Forexfactory.com

ForexFactory.com


This is not a solicitation of any order to buy or sell, but a current market view provided by Cannon Trading Inc. Any statement of facts here in contained are derived from sources believed to be reliable, but are not guaranteed as to accuracy, nor they purport to be complete. No responsibility is assumed with respect to any such statement or with respect to any expression of opinion herein contained. Readers are urged to exercise their own judgement in trading.