Futures: Rotation, Not Retreat PLUS: PHLX/KOSPI/SOX, 3:2:1 Crack Spread, Levels, Reports; Your 7 Important Can’t-Miss Need-To-Knows for Trading Futures on July 7th, 2026

9dc1e02e d5f7 4ff4 abf7 1df60775f196

Futures: Rotation, Not Retreat

By Eli Levy, Senior Analyst & Series 3 Broker

futures

The New Quarter Begins

The new quarter arrived with a jolt. After a first half where the AI and semiconductor trade did much of the heavy lifting, this week saw that same corner of the market hit with selling pressure and real volatility — and notably, it happened even as oil prices eased and yields drifted lower. The pressure wasn’t about the macro backdrop turning hostile; it was about money in motion, rotating out of the most crowded trades and looking for a home elsewhere.

PHLX/KOSPI/SOX

The numbers tell the story. The PHLX Semiconductor Index (SOX) fell roughly 12% over just two sessions, pressured in part by a sharp overnight drop in Korea’s KOSPI, which shed 7.89% in one session. On one side of the coin, this looks like a long-overdue mean reversion: the SOX rallied nearly 100% in the first six months of the year, a parabolic run that arguably needed to cool.

Mircron

Micron’s reaction last week was a tell — the stock traded poorly on massive volume despite reporting, and the optical names tied to the AI build-out have been rolling over alongside it. On the other side of the coin, sharp pullbacks inside a longer-term uptrend have repeatedly turned out to be buying opportunities, and there’s a case that this one proves no different.

Healthcare/Insurance

What’s keeping the mood constructive is where the money is going. Rather than fleeing the market entirely, it’s rotating beneath the surface. Healthcare is breaking out of a five-year trading range, insurance is emerging from an 18-month base, and REITs — flat for the better part of five or six years — are being watched as a possible next leg. As long as capital rotating out of momentum keeps finding a home, the pullback reads as healthy churn rather than a broad unwind. The economic data and growth forecasts remain strong, the broadening looks like it’s still underway, and July seasonality has historically favored the bulls.

US – Iran Relations

Overseas and in Washington, the picture is mixed but not alarming. The U.S.–Iran ceasefire is not going smoothly, and the status of the Strait of Hormuz remains unclear, yet oil has held below $70 a barrel and markets remain hopeful of a resolution. At the ECB forum, Fed Chair Kevin Warsh stayed tight-lipped on forward guidance while reiterating his commitment to getting inflation back to the 2% target. With next week light on both the economic and earnings calendars, near-term direction can likely be steered by technicals, Middle East headlines, oil, and yields rather than by fresh data.

READ THE REST and SEE CHARTS

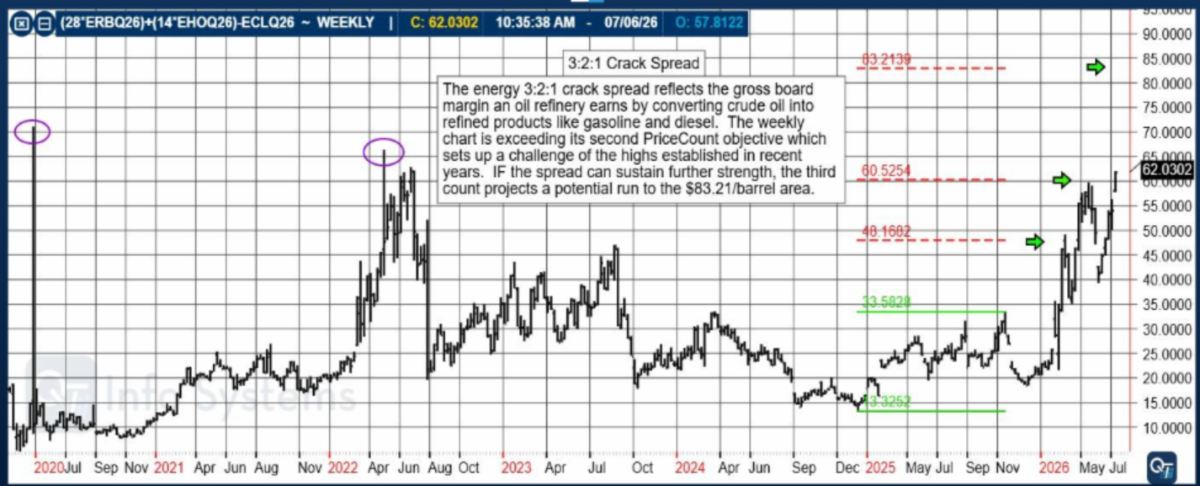
3:2:1 Crack Spread

The 3-2-1 Crack Spread approximates the value of crude oil inputs and product outputs – in effect an indicator of refinery profitability. The 3-2-1 Crack spread approximates a theoretical refinery crude yield that produces two barrels of gasoline and one barrel of diesel for every three barrels of crude input. In other words, the simplified refinery yield implied by this calculation is two-thirds gasoline, one-third diesel. It is calculated in $/bbl.

Here is the simple mathematical formula:

https://www.cmegroup.com/tools-information/calc_crack.html

3 contracts of WTI Crude, 2 Contracts RBOB, 1 Contract HO (diesel)

783b3cb3 0ca5 4161 94e9 4136377a0723

The PriceCount study is a tool that can help to project the distance of a move in price. The counts are not intended to be an ‘exact’ science but rather offer a target area for the four objectives which are based off the first leg of a move with each subsequent count having a smaller percentage of being achieved.

It is normal for the chart to react by correcting or consolidating at an objective and then either resuming its move or reversing trend. Best utilized in conjunction with other technical tools, PriceCounts offer one more way to analyze charts and help to manage your positions and risk.

Learn more at www.qtchartoftheday.com

Trading in futures, options, securities, derivatives or OTC products entails significant risks which must be understood prior to trading and may not be appropriate for all investors. Past performance of actual trades or strategies is not necessarily indicative of future results.

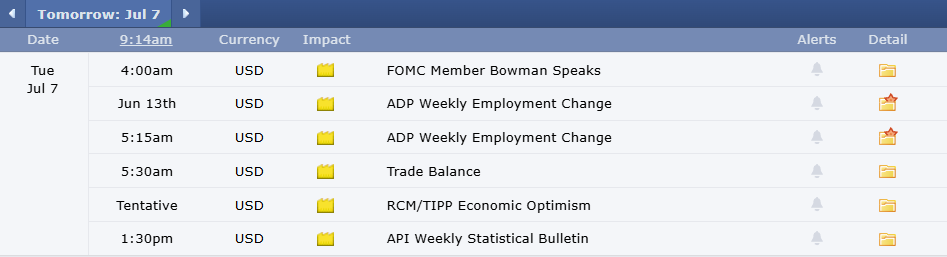
Economic Reports

provided by: ForexFactory.com

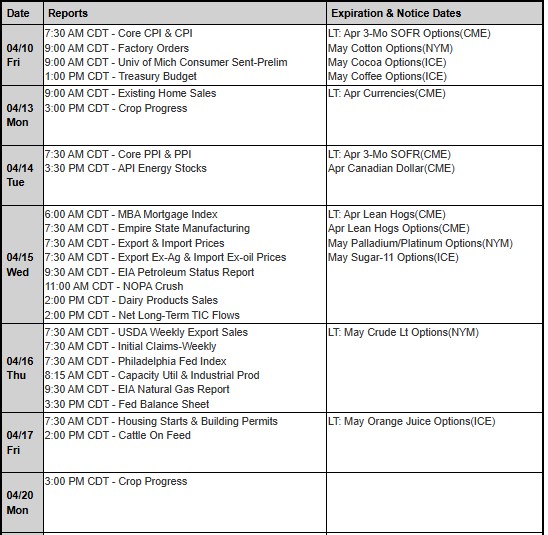
All times are Central Time ( Chicago)

3ea0e274 2eb0 4d86 89c4 ea13904d6731

Find us on Trustpilot

41a3c910 28d6 4126 946b 6659bb02ae4d

Trading Futures, Options on Futures, and retail off-exchange foreign currency transactions involves substantial risk of loss and is not suitable for all investors. You should carefully consider whether trading is suitable for you in light of your circumstances, knowledge, and financial resources. You may lose all or more of your initial investment. Opinions, market data, and recommendations are subject to change at any time.

Join our Private Facebook group

Subscribe to our YouTube Channel

Listen to our podcast: Subscribe on AppleSpotify, Amazon

or wherever you listen to podcasts!

S
Facebook  Instagram  LinkedIn
S
ef3ab1c9 8d6d 4e60 a3f1 af5d9d4ecbb3
Services
Software
Tools
Community
Contact

Iran, Crude Oil, NFP PLUS: 4th of July Trading Hours, Futures 102, Options 303 – Short Straddle, September Midwest Wheat Spread, CannonEdge Snapshot, Levels, Reports; What YOU Need to Know Before Trading Futures the Week of June 29th, 2026

7cfe5b36 db9f 4933 824a 7f264613e7fe

Cannon Futures Weekly Letter

In Today’s Issue #1296

  • The Week Ahead – Earnings, NFP, Iran + Crude Oil

  • 4th of July Trading Hours

  • Futures 102 – The Daily Briefing – What the Pros Know Before Trading

  • Options 303: Short Straddle

  • Chicago Wheat/ KC Wheat Spread Chart & Outlook

  • Cannon Edge – Your Futures trading Map for the week ahead!

  • Trading Levels for Next Week
  • Trading Reports for Next Week

At A Glance Levels

Instrument S2 S1 Pivot R1 R2

Gold (GC)

— Aug (#GC)

3951.73 4018.77 4065.13 4132.17 4178.53

Silver (SI)

— July. (#SI)

54.60 56.94 58.47 60.81 62.34

Crude Oil (CL)

— Aug (#CL)

66.64 68.02 69.94 71.32 73.24

 Sept. Bonds (ZB)

— Sept. (#ZB)

113 10/32 113 22/32 114 114 12/32 114 22/32

What Futures Traders Should Watch This Week

By John Thorpe, Senior Broker

oil

The Week Ahead

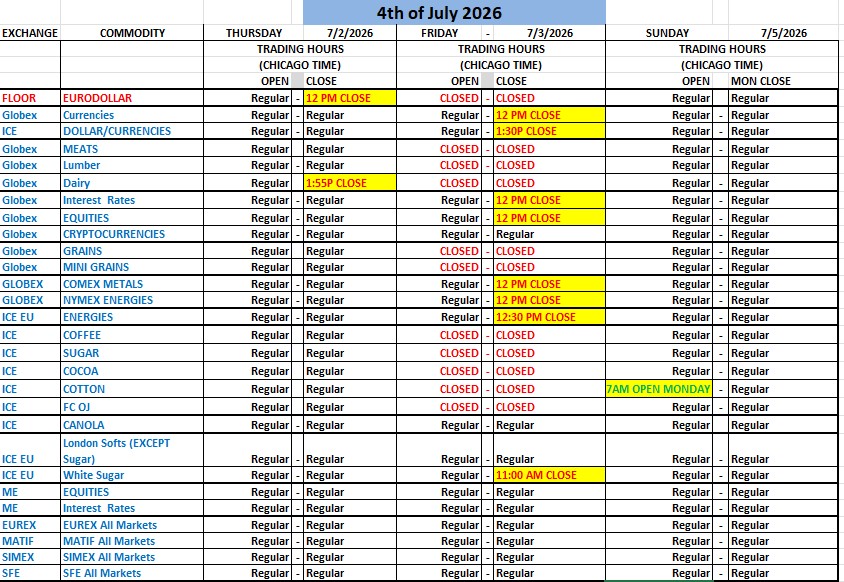
The key futures market news for next week’s shorten trading week focuses on US Non-Farm Payrolls (NFP) report released ahead of the holiday (Thursday a.m.). Note: Non-farm payrolls are expected to rise by 90,000, with the unemployment rate projected at 4.5%., Fed Chair Kevin Warsh speaks Wednesday. Friday early closings in observance of Independence Day please check the attached calendar for your favorite market operating times.

Is the smoke clearing in the Mid-East and the markets have a renewed sense of confidence?

The energy and metals are swirling in the uncertainty of a lack of resolution in the attempted unwinding of the Iranian nuclear program.

Don’t let your guard down just yet, the fog continues, tune into the Sunday evening markets to witness reactions to the weekend news streams, manufactured or true.

Plan your trade and trade your plan!

Earnings Next Week:

·        Mon. AeroVironment

·        Tue. Nike, Constellation Brands

·        Wed. General Mills

·        Thu. Unifirst, National Beverage

·        Fri.   Quiet

FED SPEECHES: (all times CDT)

·        Mon. Quiet

·        Tues. Quiet

·        Wed. 8:00 am Fed Chair Kevin Warsh

·        Thu.  Quiet

·        Fri.   Quiet

Econ Data:

·        Mon. Dallas Fed,,   

·        Tue.  Redbook,  Case/Shiller, Chicago PMI, JOLTS, Consumer confidence, Quarterly Grain Stocks

·              API Crude Stock Change

·        Wed. ADP, EIA Crude stock Change, S&P PMI, ISM numbers,

·        Thu. NFP, Initial Jobless claims, Factory orders  EIA Nat Gas Stocks, Baker Hughes Oil Rig Count

·        Fri. 4th of July Markets on this 3rd of July no U.S. Data releases.

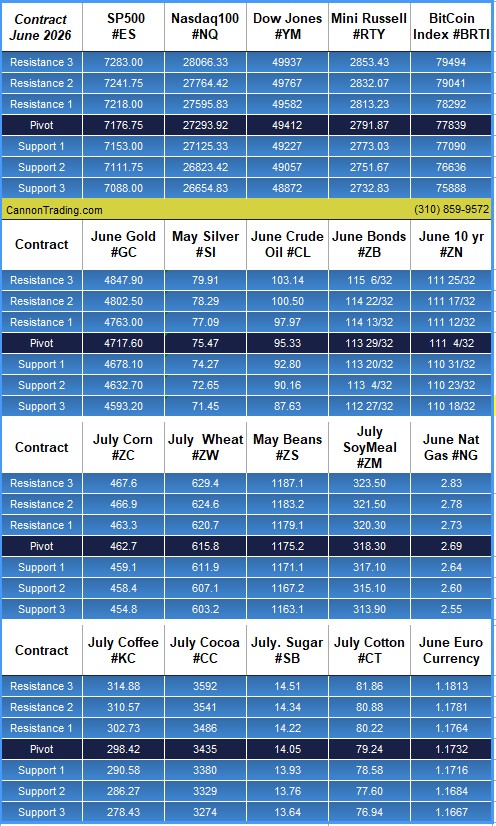
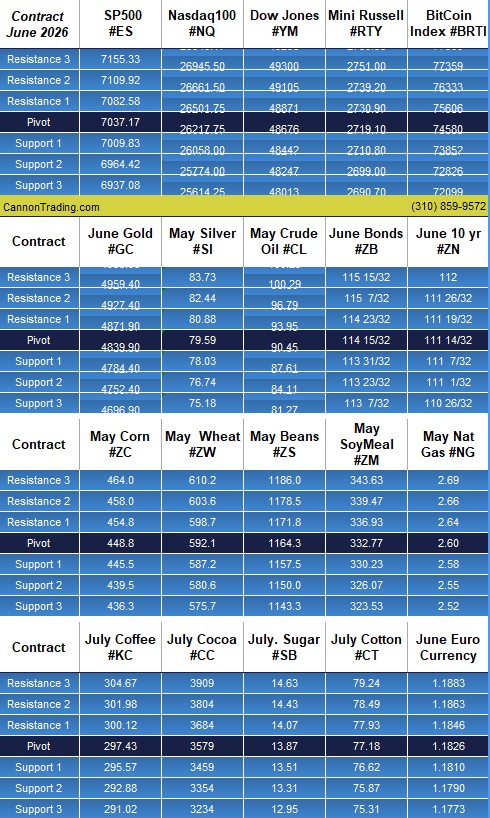
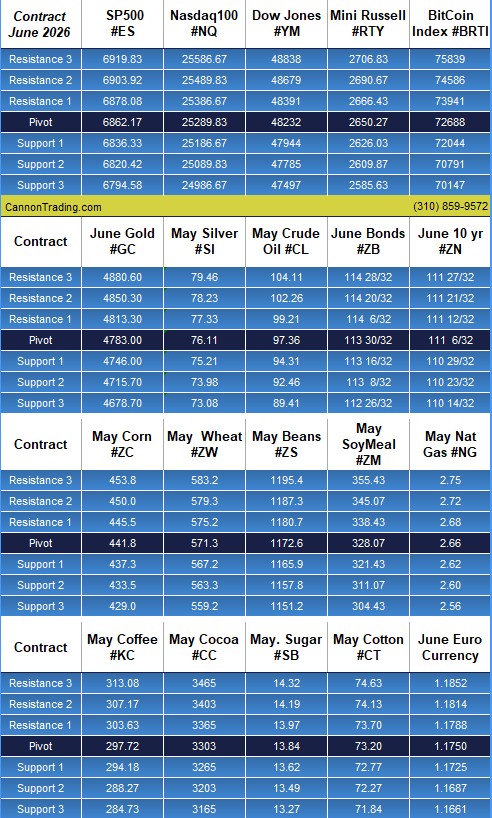
Get a daily market edge—support & resistance levels plus key market-moving insights.

4th of July Modified trading Schedule

As we approach Independence Day, we’re reminded of the remarkable history and spirit that define the United States.

This year is especially meaningful as the nation celebrates its 250th anniversary—marking two and a half centuries of resilience, innovation, and freedom since the signing of the Declaration of Independence.

It’s a moment to reflect on that legacy while enjoying time with family, friends, and community. In observance of the holiday, please see our updated hours below.

MODIFIED HOURS

ddd2f39b 234e 4cb6 afe2 151919d7db54
In previous Newsletters, we provided you with definitions and examples of Long Option Straddles, and short option straddles. Today I want to show you the Short Option straddle with an always in the market futures position, this is a technique we use in a relatively new trading program we are offering called “AIM” Always In the Market.

The option strategy compliments futures contracts in Micro Crude oil, Micro E-mini Nasdaq, Micro E-mini S&P 500 and the U.S. 30 yr bond contract using a swing trading protocol for the futures and a short option straddle placed weekly.

Please contact your broker Please contact your broker, if you are a current client or call us to learn more about this opportunity.

Options Workshop 303:

By John Thorpe, Senior Broker

A short option straddle combined with an open futures position is basically a way to collect option premium while modifying the risk profile of your futures trade. The exact effect depends on whether your futures position is long or short.

A short straddle means you:

  • Sell a call option
  • Sell a put option
  • Same futures contract (underlying), same strike price, same expiration

You receive premium upfront, but you take on the obligation:

  • If futures rise a lot → the short call loses
  • If futures fall a lot → the short put loses
  • You benefit if futures stay near the strike

Example: You are already long futures

Suppose:

  • Long 1 crude oil futures at $75
  • Sell a $75 call for $2
  • Sell a $75 put for $2

You collect $4 premium.

Your position is now:

Long futures + short straddle

If crude goes to $75 at expiration:

  • Futures: $0 gain/loss
  • Call expires worthless: +$2
  • Put expires worthless: +$2

Total: +$4

This is the ideal outcome: the market stays flat.

If crude goes to $85:

  • Futures: +$10
  • Short call: -$10
  • Short put: $0
  • Premium: +$4

Net:

+$4

The short call caps some of your upside, because your long futures gain offsets the call loss.

If crude goes to $65:

  • Futures: -$10
  • Short put: -$10
  • Short call: $0
  • Premium: +$4

Net:

-$16

This is the danger: the short put adds downside exposure on top of your losing futures position.

So:

Long futures + short straddle = you are basically betting the market will stay stable, but you have extra downside risk.

If you are short futures

Now reverse it:

  • Short futures
  • Sell call
  • Sell put

Example:

Short crude at $75, collect $4 premium.

At expiration:

Market at $75

  • Futures: 0
  • Options: +$4
  • = +$4

Market at $65

  • Futures: +$10
  • Short put: -$10
  • = +$4

Market at $85

  • Futures: -$10
  • Short call: -$10
  • = -$16

So:

Short futures + short straddle = downside is somewhat protected by the short futures, but a big rally hurts badly.

Why would someone do this?

Common reasons:

  1. Income generation

  • Collect option premium
  • Works if volatility collapses and futures stay range-bound
  1. Turn a directional futures position into a range trade

  • Long futures alone = bullish
  • Long futures + short straddle = “bullish but expecting little movement”
  1. Hedge existing futures exposure

  • But it is not a traditional hedge because you are adding short option risk

The key risk

A short straddle has unlimited risk:

  • Short call → unlimited loss if futures explode higher
  • Short put → large loss if futures crash

The futures position can offset one side, but it usually makes the other side worse.

A useful way to think about it:

  • Long futures + short straddle = short volatility + long price bias
  • Short futures + short straddle = short volatility + short price bias

The trade is mostly a bet that futures will not move much before expiration.

Where “reverse the futures” comes in

A trader may manage this by saying:

“If the market moves strongly against me, I will reverse the futures position.”

Example:

Start:

  • Long futures
  • Short straddle

Market drops through 4,900.

You decide the move is real, so you:

  • Sell your long futures
  • Go short futures

Now you have:

  • Short futures
  • Short put
  • Short call

Your delta has flipped.

If the market keeps falling:

Short futures gains may offset the short put losses.

Example:

Market continues from 4,900 → 4,700.

Short futures:

+200

Short put:

-300

Net:

-100

Instead of the original -300 futures loss + -300 put loss.

Why traders do this

This strategy is sometimes called:

  • short straddle with futures adjustment
  • delta hedging
  • gamma scalping (if actively managed)
  • short volatility trading

The idea:

  • Sell expensive implied volatility
  • Collect premium decay (theta)
  • Adjust futures exposure as the market moves

You are betting:

“The market will not make a large move faster than I can adjust.”

The major risk

Short straddles have negative gamma:

  • Small moves are manageable
  • Big moves accelerate losses

The futures reversal helps, but timing matters. If the market gaps overnight, moves violently, or liquidity disappears, the adjustment may come too late.

A useful way to think about the position:

Market behavior

Result

Stays flat

Best outcome

Slowly trends

Manageable with futures adjustments

Violent move

Dangerous

Gap move

Highest risk

So, the futures position is not a “hedge” in the traditional sense — it is a dynamic directional adjustment tool that changes the straddle’s exposure as the market moves.

Cannon has a product that trades this strategy called AIM “Always in the Market” call us to learn more.


Futures 102: The Daily Briefing by Cannon

Every morning, the world’s biggest banks and macro strategists publish where markets are headed. The rest of the world waits for the headline.

That intelligence stays locked inside trading desks, institutional terminals, and private client portals — accessible only to the few who pay for the privilege, and even they only get what they pay for.

This briefing changes that (100% FREE on Cannon’s website!!). Every morning we scour the open web and aggregate everything that matters — pulling from publicly available sources so you never have to — and distill it into one clear, readable edition you can get through before your first coffee is finished.

No terminals. No subscriptions. No private portals. Just everything the market is saying, gathered in one place, every morning before the bell.

Read the Latest Briefing HERE and make sure to Bookmark this page!

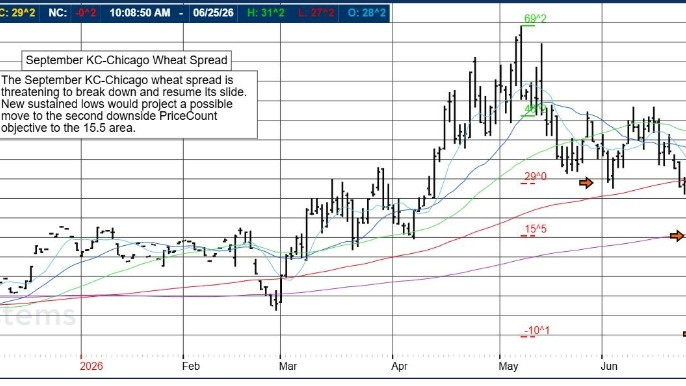
September KC – Chicago Wheat Spread


The September KC – Chicago Wheat Spread is threatening to break down and resume its slide. New sustained lows would project a possible move to the second downside PriceCount objective to the 15.5 area.

Some professional futures traders prefer trading spreads—both intraday and swing—because spreads can reduce outright market risk while still offering opportunities for consistent returns. By trading the price relationship between two related contracts rather than a single direction, traders can benefit from relative value inefficiencies, seasonal patterns, and supply-demand imbalances. Intraday spread trading often provides smoother price action and tighter risk control, while swing trading spreads can capitalize on longer-term structural trends with lower volatility compared to outright positions. Additionally, spreads typically require lower margin and can be less sensitive to macro shocks, making them an appealing strategy for disciplined risk management and more stable performance.


That being said – spread trading is risky just like futures trading and past performance is not indicative of future results.


In today’s chart review, you will see an idea/ outlook of a swing trade between the Chicago Wheat and Kansas City wheat.


Some INTRA day traders will day trade gold vs silver, MNQ versus MES, ten years vs the 30 years and more….


Curious?


Learn more here or even better schedule a one on one consultation with a licensed series 3 broker HERE


undefined

The PriceCount study is a tool that can help to project the distance of a move in price. The counts are not intended to be an ‘exact’ science but rather offer a target area for the four objectives which are based off the first leg of a move with each subsequent count having a smaller percentage of being achieved.

It is normal for the chart to react by correcting or consolidating at an objective and then either resuming its move or reversing trend. Best utilized in conjunction with other technical tools, PriceCounts offer one more way to analyze charts and help to manage your positions and risk.

Learn more at www.qtchartoftheday.com

Trading in futures, options, securities, derivatives or OTC products entails significant risks which must be understood prior to trading and may not be appropriate for all investors. Past performance of actual trades or strategies is not necessarily indicative of future results.

FREE TRIAL TO QT MARKET Center – Access to analysis, tools, news & Much more!

Highly recommended for HEDGERS!

1ab82322 3fe6 467c 8a06 58a08d52f845

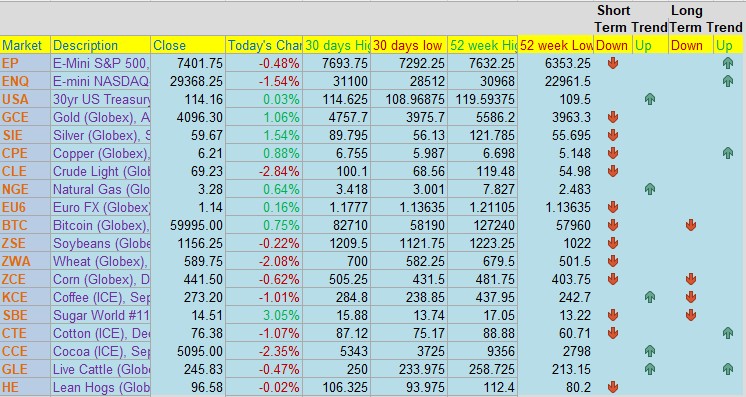
Cannon Edge — Your Daily Futures Insight for the Next Trading Day! Cannon Edge for June 29th 2026

8fb9046d d655 423c b200 54798d401cc2

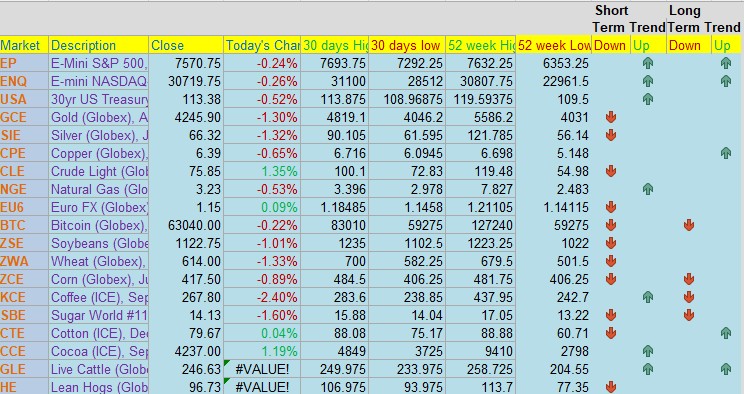
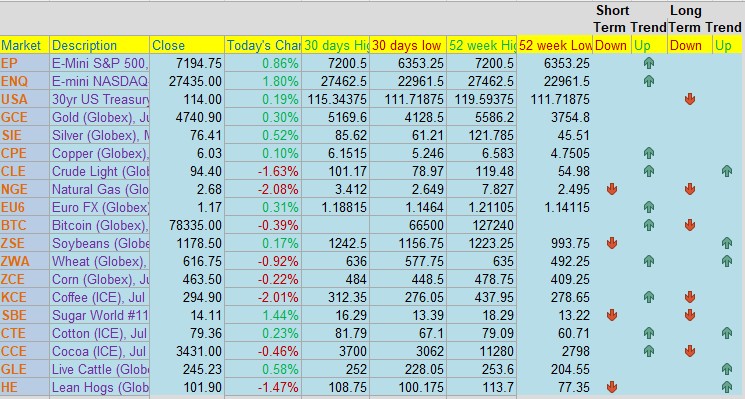
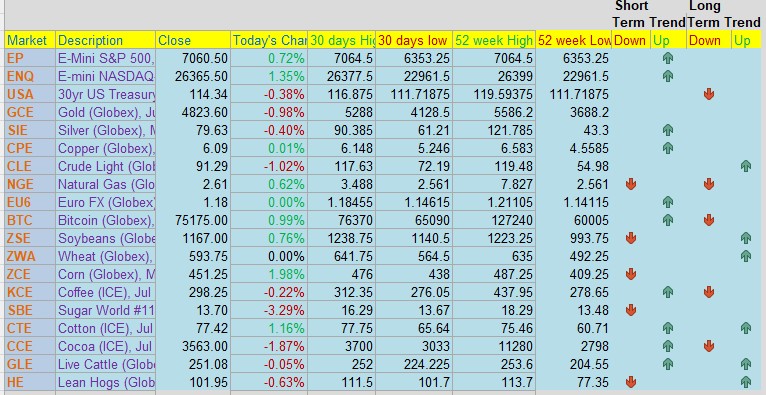
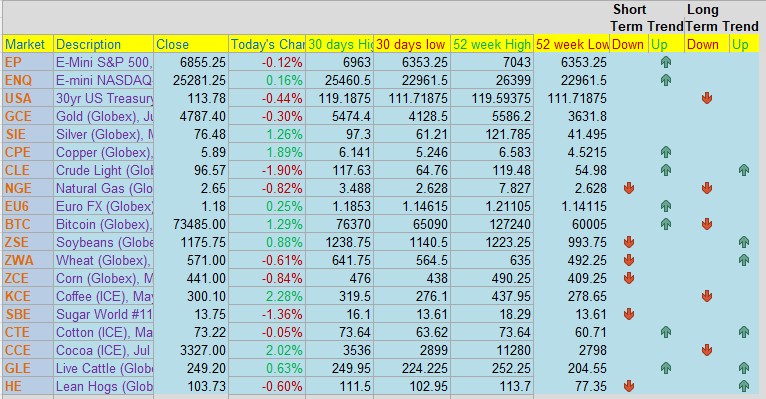
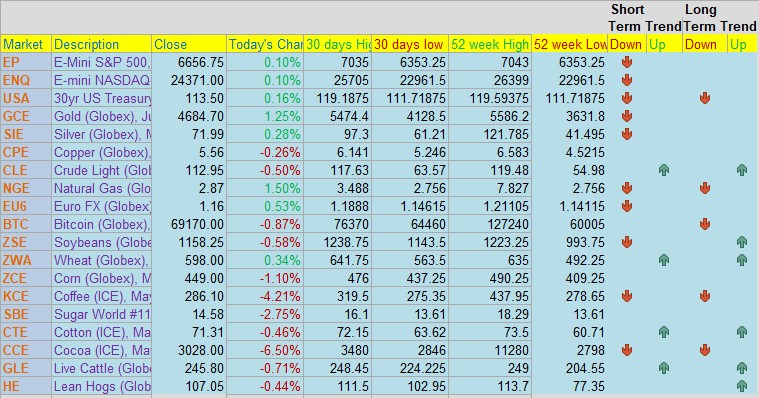
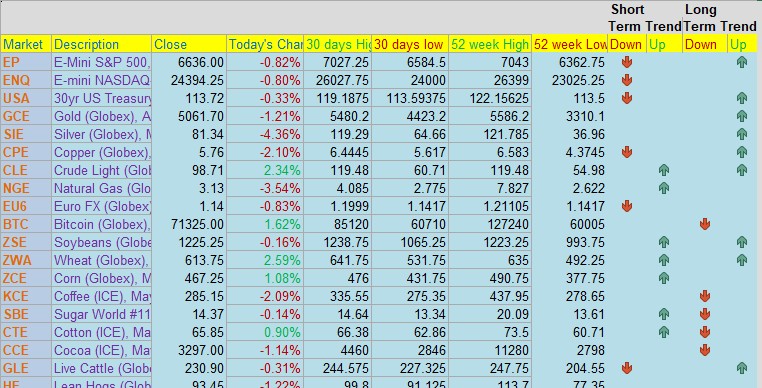
Cannon Edge is our new daily feature designed to give traders a fast, actionable overview of key futures markets. Each post delivers:

  • Current price and daily % change
  • 30‑day and 52‑week highs/lows
  • PROPRIETARY Short‑term and long‑term trend signals
  • Coverage across equity indices, metals, energies, currencies, and ags

Whether you’re scanning for breakout setups, trend reversals, or just staying informed — Cannon Edge puts the data in your hands before the open.

Built for speed. Backed by insight. Powered by CQG.

Would you like to get weekly updates on real-time, results of Automated trading systems ?

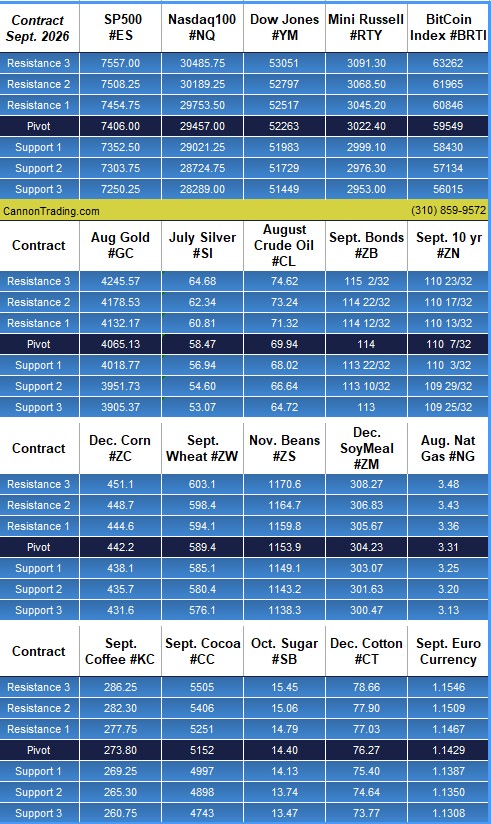
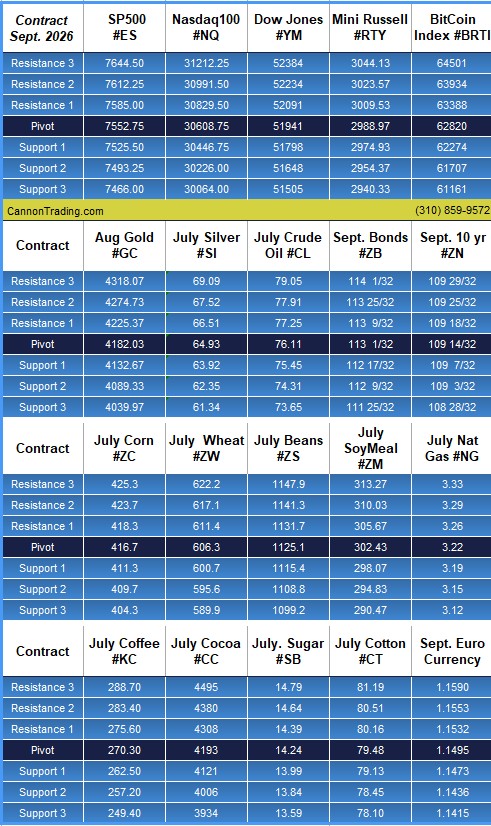
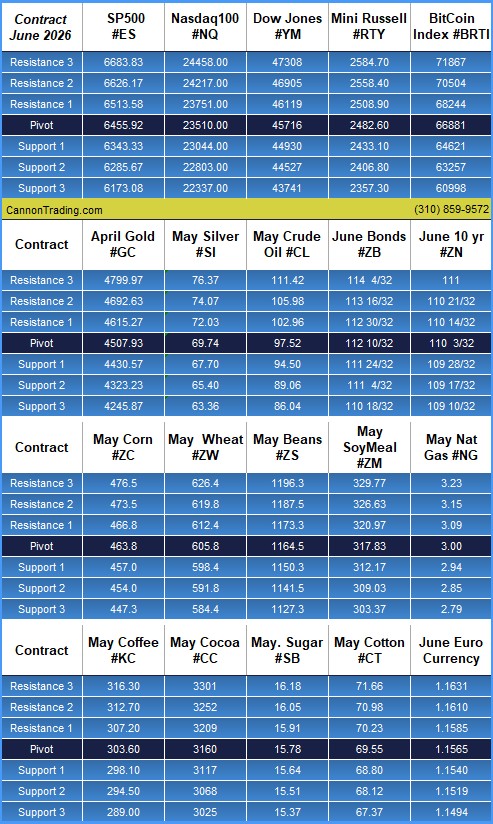
Daily Levels for June 29th, 2026

a09a5a03 b081 484a 93a8 6385c0469730

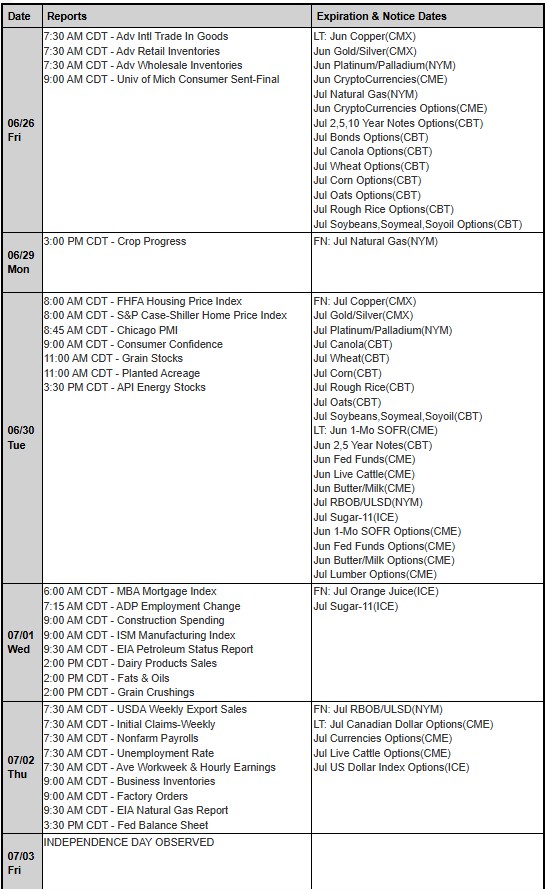
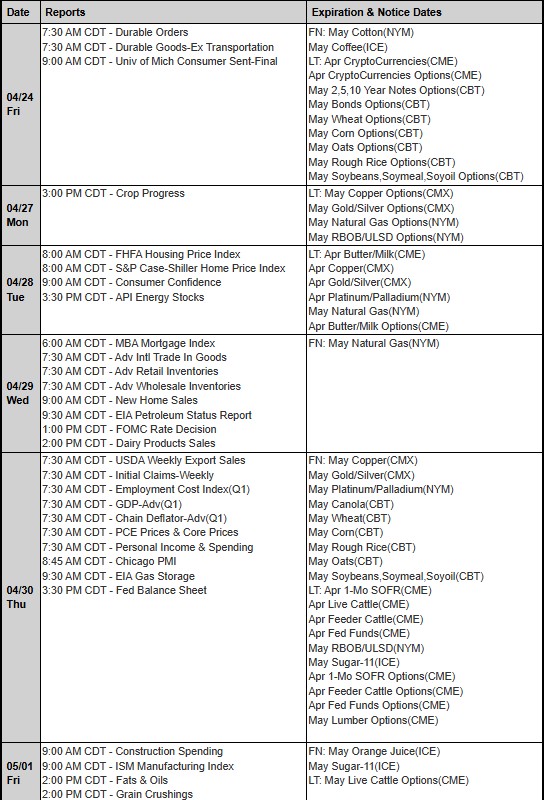
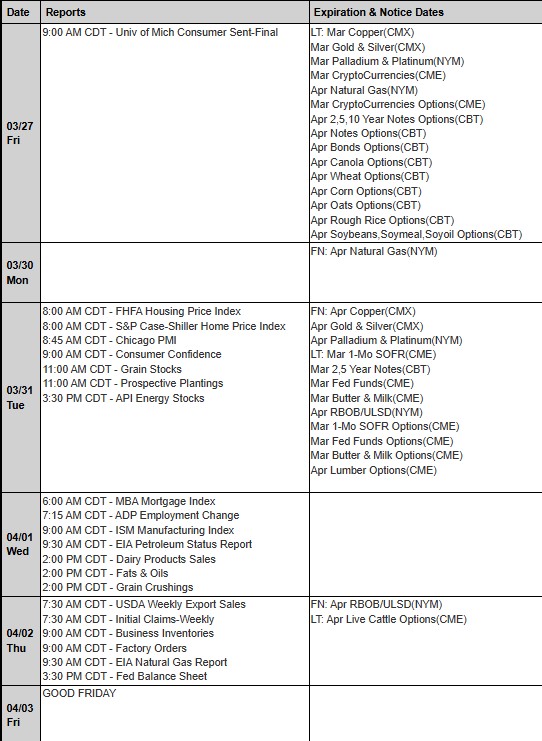
Trading Reports for Next Week

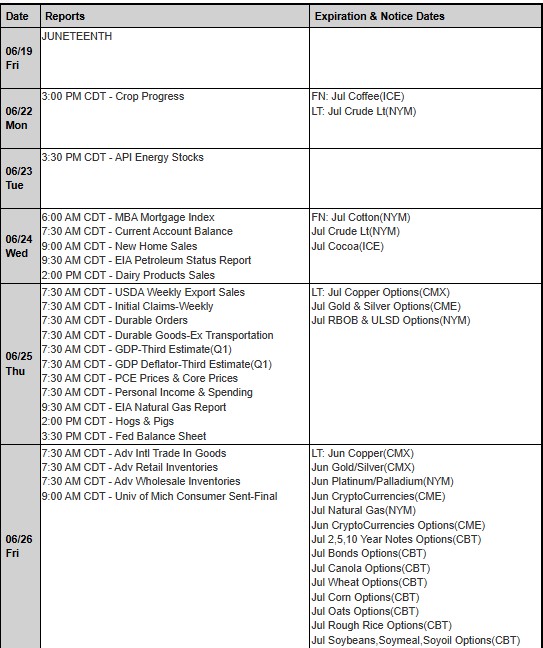
First Notice (FN), Last trading (LT) Days for the Week:

www.mrci.com

ea71630e c045 40ff abcf 8afc0e332b4a

Find us on Trustpilot

4ad8134c aa57 4adb a428 7cc476773107

Trading Futures, Options on Futures, and retail off-exchange foreign currency transactions involves substantial risk of loss and is not suitable for all investors. You should carefully consider whether trading is suitable for you in light of your circumstances, knowledge, and financial resources. You may lose all or more of your initial investment. Opinions, market data, and recommendations are subject to change at any time.

Join our Private Facebook group

Subscribe to our YouTube Channel

Listen to our podcast: Subscribe on AppleSpotify, Amazon

or wherever you listen to podcasts!

S
Facebook  Instagram  LinkedIn
S
ef3ab1c9 8d6d 4e60 a3f1 af5d9d4ecbb3
Services
Software
Tools
Community
Contact

The Week Ahead: Crude Oil & The Iran Conflict PLUS: Crypto Cup Last Chance! $50,000 in Total Prizes! August Crude Oil, CannonEdge Snapshot, Levels, Reports; Your 7 Important Can’t-Miss Need-To-Knows for Trading Futures The Week of June 22nd, 2026

7cfe5b36 db9f 4933 824a 7f264613e7fe

Cannon Futures Weekly Letter

In Today’s Issue #1295

  • The Week Ahead – Hawkish Fed? Iran Deal is Real?

  • Crypto Cup- Last Chance!! – $50,000 Total Prizes!!

  • Futures 102 – The Daily Briefing – What The Pros Know Before Trading

  • Chart & Outlook

  • Cannon Edge – Your Futures trading Map for the week ahead!

  • Trading Levels for Next Week
  • Trading Reports for Next Week

At A Glance Levels

Instrument S2 S1 Pivot R1 R2

Gold (GC)

— Aug (#GC)

4089.33 4132.67 4182.03 4225.37 4274.73

Silver (SI)

— July. (#SI)

62.35 63.92 64.93 66.51 67.52

Crude Oil (CL)

— July. (#CL)

74.31 75.45 76.11 77.25 77.91

 Sept. Bonds (ZB)

— Sept. (#ZB)

112 9/32 112 17/32 113 1/32 113 9/32 114 25/32

What Futures Traders Should Watch This Week

By John Thorpe, Senior Broker

crude oil

The Week Ahead

In addition to the Northern Hemisphere’s Summer Solstice and Father’s Day celebrations this Sunday, the key futures market news for next week focuses again on the Middle East and the flow of oil through the straits of Hormuz, Additionally, the reaction to a “hawkish” Fed Chair Warsh’s comments this past Wednesday about clearly doing what is necessary to achieve price stability.

Is the smoke clearing in the Mid-East and the markets have a renewed sense of confidence?

The Memorandum of Understanding unwinding the Iranian nuclear program among 13 other points was signed by both President Trump and Iran’s President Masoud Pezeshkian. “The text of the Islamabad Memorandum of Understanding was finalized with the signatures of the presidents,” Baghaei told the news agency IRNA. “Now it is time to test the implementation of the agreement.”

Don’t let your guard down just yet, the fog continues, tune into the Sunday evening markets to witness reactions to the weekend news streams, manufactured or true.

  Plan your trade and trade your plan!

Earnings Next Week:

·        Mon. Quiet

·        Tue. Fed-Ex, Carnival, KBHome

·        Wed. Micron Technology, Paychex, KornFerry

·        Thu. Darden Restaurants, Acuity Brands, McCormick, Commercial Metals.

·        Fri.   Quiet

FED SPEECHES: (all times CDT)

·        Mon. Quiet

·        Tues. Quiet

·        Wed. Quiet

·        Thu.  Goolsbee 5:30 pm

·        Fri.   Quiet

Econ Data:

·        Mon. Quiet   

·        Tue.  ADP Employment Weekly, Redbook, S&P PMI, Richmond Fed,

·              API Crude Stock Change

·        Wed.  Current Account Q1, New Home Sales, EIA Crude stock change,

·        Thu. Core PCE, Durable Goods, GDP Q1 Final, Personal Income, Initial Jobless claims, EIA Nat Gas Stocks, KC Fed

·        Fri. Retail Inventories, Michigan Consumer sentiment, Baker Hughes Oil Rig Count

Get a daily market edge—support & resistance levels plus key market-moving insights.

As a Cannon Trading client OR prospect, you’re invited to compete in

The Great Summer Escape Trading Competition featuring Coinbase Derivatives futures contracts!

From June 22 – July 2, trade in a simulated environment and compete for your share of $50,000 in prizes.

Contracts include:

·    Etherium: Ether, nano Ether, nano Ether Perp-Style

·    Bitcoin: Bitcoin, nano Bitcoin, nano Bitcoin Perp-Style

·    Solana: Solana, nano Solana, nano Solana Perp-Style

·    XRP: XRP, nano XRP, nano XRP Perp-Style

Sign Up Now!

46885e4b db17 4591 8a0a 0590a82f537f

Futures 102: The Daily Briefing by Cannon

Every morning, the world’s biggest banks and macro strategists publish where markets are headed. The rest of the world waits for the headline.

That intelligence stays locked inside trading desks, institutional terminals, and private client portals — accessible only to the few who pay for the privilege, and even they only get what they pay for.

This briefing changes that (100% FREE on Cannon’s website!!). Every morning we scour the open web and aggregate everything that matters — pulling from publicly available sources so you never have to — and distill it into one clear, readable edition you can get through before your first coffee is finished.

No terminals. No subscriptions. No private portals. Just everything the market is saying, gathered in one place, every morning before the bell.

Read the Latest Briefing HERE and make sure to Bookmark this page!

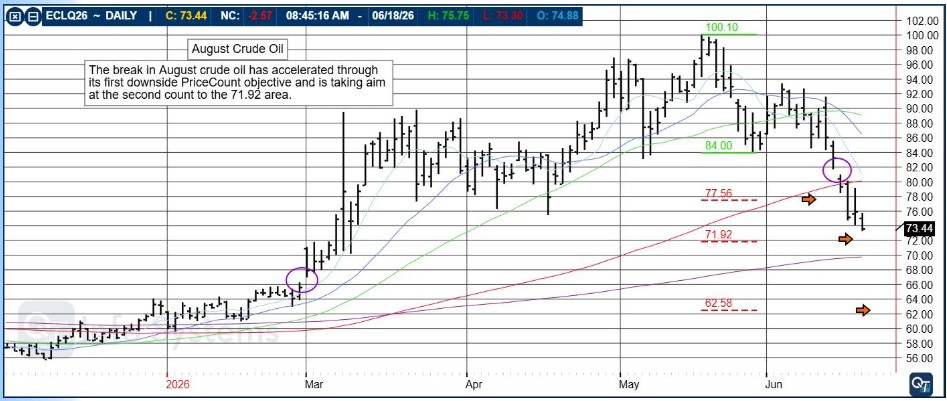
August Crude Oil

The break in August Crude Oil has accelerated through its first downside PriceCount objective and is taking aim at the second count to the 71.92 area.

2bf346a4 ba26 4e9b 91b2 4b4f55f38099

The PriceCount study is a tool that can help to project the distance of a move in price. The counts are not intended to be an ‘exact’ science but rather offer a target area for the four objectives which are based off the first leg of a move with each subsequent count having a smaller percentage of being achieved.

It is normal for the chart to react by correcting or consolidating at an objective and then either resuming its move or reversing trend. Best utilized in conjunction with other technical tools, PriceCounts offer one more way to analyze charts and help to manage your positions and risk.

Learn more at www.qtchartoftheday.com

Trading in futures, options, securities, derivatives or OTC products entails significant risks which must be understood prior to trading and may not be appropriate for all investors. Past performance of actual trades or strategies is not necessarily indicative of future results.

FREE TRIAL TO QT MARKET Center – Access to analysis, tools, news & Much more!

Highly recommended for HEDGERS!

1ab82322 3fe6 467c 8a06 58a08d52f845

Cannon Edge — Your Daily Futures Insight for the Next Trading Day! Cannon Edge for June 22nd, 2026

1d2608f0 aec7 492b 8af9 1901ade257d5

Cannon Edge is our new daily feature designed to give traders a fast, actionable overview of key futures markets. Each post delivers:

  • Current price and daily % change
  • 30‑day and 52‑week highs/lows
  • PROPRIETARY Short‑term and long‑term trend signals
  • Coverage across equity indices, metals, energies, currencies, and ags

Whether you’re scanning for breakout setups, trend reversals, or just staying informed — Cannon Edge puts the data in your hands before the open.

Built for speed. Backed by insight. Powered by CQG.

Would you like to get weekly updates on real-time, results of Automated trading systems ?

Daily Levels for June 22nd, 2026

c9249949 0585 4807 a6c3 51044fa661c9

Trading Reports for Next Week

First Notice (FN), Last trading (LT) Days for the Week:

www.mrci.com

5b1588cc e3f5 44a2 a81a adb474732f5a

Find us on Trustpilot

4ad8134c aa57 4adb a428 7cc476773107

Trading Futures, Options on Futures, and retail off-exchange foreign currency transactions involves substantial risk of loss and is not suitable for all investors. You should carefully consider whether trading is suitable for you in light of your circumstances, knowledge, and financial resources. You may lose all or more of your initial investment. Opinions, market data, and recommendations are subject to change at any time.

Join our Private Facebook group

Subscribe to our YouTube Channel

Listen to our podcast: Subscribe on AppleSpotify, Amazon

or wherever you listen to podcasts!

S
Facebook  Instagram  LinkedIn
S
ef3ab1c9 8d6d 4e60 a3f1 af5d9d4ecbb3
Services
Software
Tools
Community
Contact

Silver Earnings NEXT WEEK PLUS: June Natural Gas, CannonEdge Snapshot, Futures 102, Levels, Reports and MORE! Your 6 + Important Can’t-Miss Need-To-Knows for Trading Futures the Week of April 27th, 2026

7cfe5b36 db9f 4933 824a 7f264613e7fe

Cannon Futures Weekly Letter

In Today’s Issue #1287

  • The Week Ahead – Big Earnings, FOMC and Hormuz…

  • Futures 102 – New, Exciting Tools for Cannon’s Clients!

  • Natural Gas Chart & Outlook

  • Cannon Edge – Your Futures trading Map for the week ahead!

  • Trading Levels for Next Week
  • Trading Reports for Next Week

At A Glance Levels

Instrument S2 S1 Pivot R1 R2

Gold (GC)

— June (#GC)

4632.70 4678.10 4714.60 4763.00 4802.50

Silver (SI)

— May. (#SI)

72.65 74.27 75.47 77.09 78.29

Crude Oil (CL)

— June. (#CL)

90.16 92.80 95.33 97.97 100.50

 June Bonds (ZB)

— June. (#ZB)

113 4/32 113 20/32 113 29/32 114 13/32 114 22/32

What Futures Traders Should Watch This Week

By John Thorpe, Senior Broker

silver

Earnings alert! Wednesday April 29th

Amazon, Microsoft, Alphabet and Meta report after the close.

Together, these four represent over 14% of the S&P 500 index’s total market-weighted capitalization and as of early 2026, Microsoft, Amazon, Alphabet, and Meta constitute a significant portion of the Nasdaq-100, generally totaling over 20% combined.

Call your broker about straddles on Monday! On top of the above? Chairman Powell’s last call at the FED as chair prior to the earnings releases Wednesday. The market has already discounted, “rates remain the same” in a .0350-.0375 range.

Is the smoke clearing in the Mid-East and the markets have a renewed sense of confidence?

The Cease fire ended on Tuesday, the markets are swirling in the uncertainty of a lack of resolution to the conflict. A meet and greet in Islamabad may set the tone for next weeks market action.

Don’t let your guard down just yet, the fog continues, tune into the Sunday evening markets to witness reactions to the weekend news streams, manufactured or true. The IRAN War continues in spite of the tenuous cease fire as the war premiums that had been built into Equities, Bonds, Metals and the Energy complex, have been drastically discounted as of two week’s ago. , Crude creeps higher and Equities shrugged last week.

Well, the CME did it, they finally did it after three months of consistently raising margin rates in the precious metals, they are finally coming down. Although still high for the legacy contracts, $36375 for 100 oz Gold and $58567 for 5000 oz

Silver:

call your broker and ask to trade the smaller sized contracts if you would like to jump in. If you are an investor who sees the new rates as an opportunity to jump in, give us a call!

Of note next week FOMC meeting, Heavy, and may I reiterate, heavy earnings with a few key economic data points to watch. Earnings this week will be impactful as 5 of mag seven stocks report setting up for a very interesting picture for our stock indices.

Plan your trade and trade your plan!

Earnings Next Week:

· Mon. Verizon, Public Storage

· Tue. Visa, Coca-Cola, T-Mobile, S&P Global, Starbucks, General Motores, UPS

· Wed. Microsoft, Amazon, Alphabet, Meta, ADP General Dynamics

· Thu. Apple, Eli Lilly, Mastercard, Caterpillar, Merck, Amgen

· Fri. Exxon Mobil, Chevron, Colgate-Palmolive, CBOE

FED SPEECHES: (all times CDT)

· Mon. Quiet

· Tues. Quiet

· Wed. 1pm Fed Rate , 1:30pm Powell speech and with Q&A

· Thu. Quiet

· Fri. Period, Pre Fed Rate decision April 29th

Econ Data:

· Mon. Dallas Fed.

· Tue. ADP Weekly, Redbook, Case-Shiller Home , CB consumer confidence API Crude Stock Change

· Wed. Durable goods, Housing starts, EIA Crude stocks, Rate Decision, Presser

· Thu. PCE,GDP, Initial Jobless claims, Chgo PMI, Nat Gas Stocks

· Fri. ISM Manufacturing, Baker Hughs Oil Rig Count

Futures 102: The Daily Briefing by Cannon

Every morning, the world’s biggest banks and macro strategists publish where markets are headed. The rest of the world waits for the headline.

That intelligence stays locked inside trading desks, institutional terminals, and private client portals — accessible only to the few who pay for the privilege, and even they only get what they pay for.

This briefing changes that ( 100% FREE on Cannon’s website!!). Every morning we scour the open web and aggregate everything that matters — pulling from publicly available sources so you never have to — and distill it into one clear, readable edition you can get through before your first coffee is finished.

From the morning calls at Goldman Sachs and JPMorgan, to the independent macro voices moving markets, to the reporters who break desk leaks first — it’s all here, every day, in plain language.

No terminals. No subscriptions. No private portals. Just everything the market is saying, gathered in one place, every morning before the bell.

Read the Latest Briefing HERE and make sure to Bookmark this page!

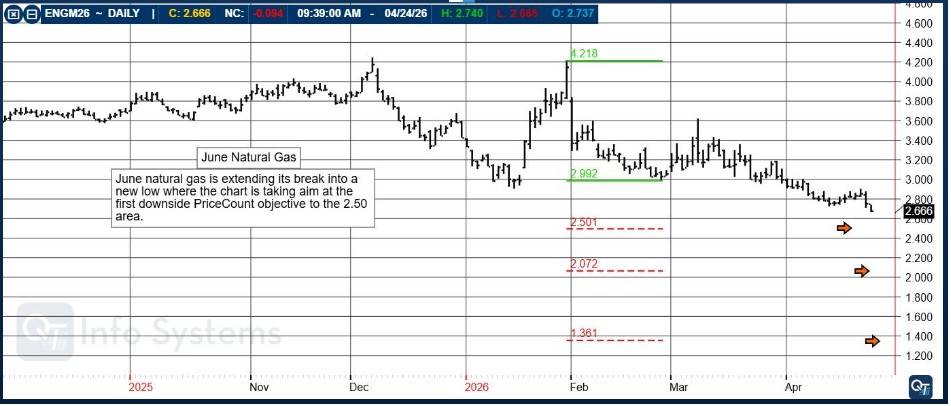
June Natural Gas

June Natural Gas is extending its break into a new low where the chart is taking aim at the first downside PriceCount objective to the 2.50 area.

2415612a df10 4b0f 8fa6 92dbb541c556

The PriceCount study is a tool that can help to project the distance of a move in price. The counts are not intended to be an ‘exact’ science but rather offer a target area for the four objectives which are based off the first leg of a move with each subsequent count having a smaller percentage of being achieved.

It is normal for the chart to react by correcting or consolidating at an objective and then either resuming its move or reversing trend. Best utilized in conjunction with other technical tools, PriceCounts offer one more way to analyze charts and help to manage your positions and risk.

Learn more at www.qtchartoftheday.com

Trading in futures, options, securities, derivatives or OTC products entails significant risks which must be understood prior to trading and may not be appropriate for all investors. Past performance of actual trades or strategies is not necessarily indicative of future results.

FREE TRIAL TO QT MARKET Center – Access to analysis, tools, news & Much more!

Highly recommended for HEDGERS!

1ab82322 3fe6 467c 8a06 58a08d52f845

Cannon Edge — Your Daily Futures Insight for the Next Trading Day! Cannon Edge for April 27th 2026

17473606 18c2 42c8 9a0c b03065b01a56

Cannon Edge is our new daily feature designed to give traders a fast, actionable overview of key futures markets. Each post delivers:

  • Current price and daily % change

  • 30‑day and 52‑week highs/lows

  • PROPRIETARY Short‑term and long‑term trend signals

  • Coverage across equity indices, metals, energies, currencies, and ags

Whether you’re scanning for breakout setups, trend reversals, or just staying informed — Cannon Edge puts the data in your hands before the open.

Built for speed. Backed by insight. Powered by CQG.

Would you like to get weekly updates on real-time, results of systems mentioned above?

Daily Levels for April 27th, 2026

3896fac1 e666 4e2b 8a60 a0758cc7246d

Would you like to receive daily support & resistance levels?

Trading Reports for Next Week

First Notice (FN), Last trading (LT) Days for the Week:

www.mrci.com

fa41a006 0f88 4fb7 b760 5f42b97b9e63

Find us on Trustpilot

4ad8134c aa57 4adb a428 7cc476773107

Trading Futures, Options on Futures, and retail off-exchange foreign currency transactions involves substantial risk of loss and is not suitable for all investors. You should carefully consider whether trading is suitable for you in light of your circumstances, knowledge, and financial resources. You may lose all or more of your initial investment. Opinions, market data, and recommendations are subject to change at any time.

Join our Private Facebook group

Subscribe to our YouTube Channel

Listen to our podcast: Subscribe on AppleSpotify, Amazon

or wherever you listen to podcasts!

S
Facebook  Instagram  LinkedIn
S
ef3ab1c9 8d6d 4e60 a3f1 af5d9d4ecbb3
Services
Software
Tools
Community
Contact

Crude Oil Testing Major Support Levels PLUS: NEW CRUDE OIL VIDEO, CannonEdge Snapshot, May KC – Chicago Wheat Spread, Levels, Reports; Your 6 Important Can’t-Miss Need-To-Knows for Trading Futures on April 16th, 2026

9dc1e02e d5f7 4ff4 abf7 1df60775f196

At-a-Glance Levels

Instrument S2 S1 Pivot R1 R2

Gold (GC)

— June (#GC)

4752.40 4784.40 4839.90 4871.90 4927.40

Silver (SI)

— May. (#SI)

76.74 78.03 79.59 80.88 82.44

Crude Oil (CL)

— May. (#CL)

84.11 87.61 90.45 93.95 96.79

 June Bonds (ZB)

— June. (#ZB)

113 23/32 113 31/32 114 15/32 114 23/32 115  7/32

Stocks on a V shape bounce, Crude Oil testing major support levels.

The conflict is far from over, but the markets act as if they “know something” OR are the markets premature?

Time will tell…. keep watching Crude Oil.

What’s Going on With Crude Oil?

crude oil
9d31668f 4e7f 48c9 87b9 0e5ebba7728d

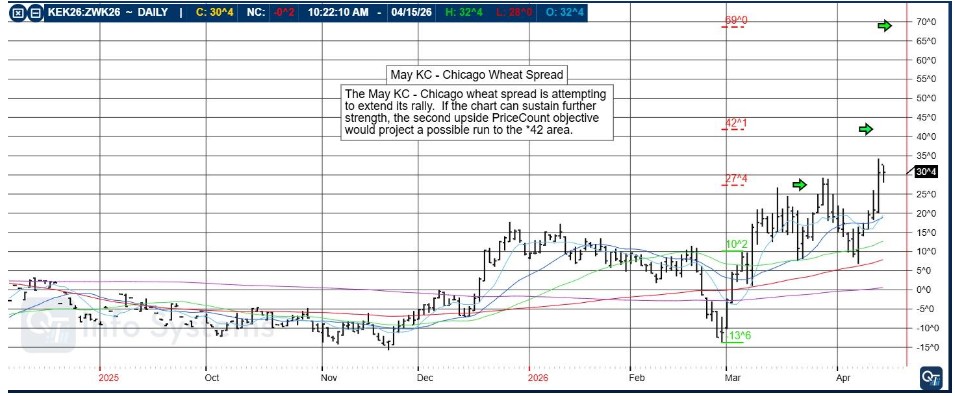
May KC – Chicago Wheat Spread

The May KC – Chicago Wheat Spread is attempting to extend its rally. If the chart can sustain further strength, the second upside PriceCount objective would project a possible run to the *42 area.

26a50ccf d317 41f6 8de9 6f59aa24735f

The PriceCount study is a tool that can help to project the distance of a move in price. The counts are not intended to be an ‘exact’ science but rather offer a target area for the four objectives which are based off the first leg of a move with each subsequent count having a smaller percentage of being achieved.

It is normal for the chart to react by correcting or consolidating at an objective and then either resuming its move or reversing trend. Best utilized in conjunction with other technical tools, PriceCounts offer one more way to analyze charts and help to manage your positions and risk.

Learn more at www.qtchartoftheday.com

Trading in futures, options, securities, derivatives or OTC products entails significant risks which must be understood prior to trading and may not be appropriate for all investors. Past performance of actual trades or strategies is not necessarily indicative of future results.

Cannon Edge — Your Daily Futures Snapshot for April 16th

e01302bc e802 4a36 93d5 b9afd7e4eee4

Daily Levels for April 16th, 2026

fef02431 5a65 4ae7 b8b0 e1aca22789e7

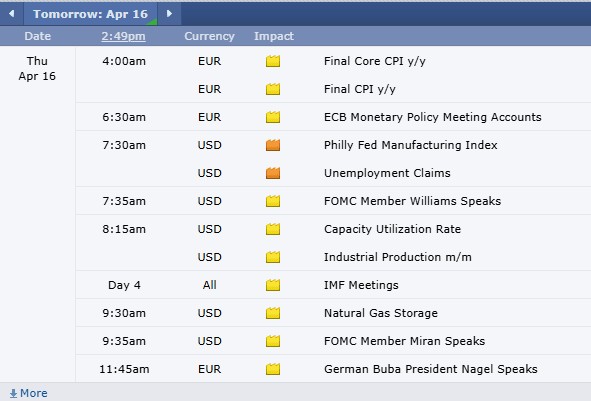
Economic Reports

provided by: ForexFactory.com

All times are Central Time ( Chicago)

3c58648c e5b5 402c b8ad 9237c81fba50

Find us on Trustpilot

603cd3d5 1e3c 4435 85b1 f25c3ed5936e

Trading Futures, Options on Futures, and retail off-exchange foreign currency transactions involves substantial risk of loss and is not suitable for all investors. You should carefully consider whether trading is suitable for you in light of your circumstances, knowledge, and financial resources. You may lose all or more of your initial investment. Opinions, market data, and recommendations are subject to change at any time.

Join our Private Facebook group

Subscribe to our YouTube Channel

Listen to our podcast: Subscribe on AppleSpotify, Amazon

or wherever you listen to podcasts!

S
Facebook  Instagram  LinkedIn
S
ef3ab1c9 8d6d 4e60 a3f1 af5d9d4ecbb3
Services
Software
Tools
Community
Contact

The Iran Conflict on the Markets PLUS: Futures 102, CannonEdge Snapshot, What’s Your Trading Blood Type?, Levels, Reports; Your 7 Important Can’t-Miss Need-To-Knows for Trading Futures the Week of April 13th, 2026

7cfe5b36 db9f 4933 824a 7f264613e7fe

Cannon Futures Weekly Letter

In Today’s Issue #1285

  • The Week Ahead – Cease Fire? Beige Book? IMF Meeting?

  • Futures 102 – New, Exciting Tools for Cannon’s Clients!

  • Cannon Edge – Your Futures trading Map for the week ahead!

  • Trading Levels for Next Week
  • Trading Reports for Next Week

At-a-Glance Levels

Instrument S2 S1 Pivot R1 R2

Gold (GC)

— June (#GC)

4715.70 4746.00 4783.00 4813.30 4850.30

Silver (SI)

— May. (#SI)

73.98 75.21 76.11 77.33 78.23

Crude Oil (CL)

— May. (#CL)

92.46 94.31 97.36 99.21 102.26

 June Bonds (ZB)

— June. (#ZB)

113 8/32 113 16/32 113 30/32 114 6/32 114 20/32

What Futures Traders Should Watch This Week

By John Thorpe, Senior Broker

iran

The fog continues, tune into the Sunday evening markets to witness reactions to the weekend news streams, manufactured or true.

Iran

The IRAN War continues in spite of the tenuous cease fire as the war premiums are built into Equities, Bonds, Metals and the Energy complex, speculation leads the volatility.

Of note next week are a few major reports/Earnings we should all know the release times for. Unlike last week, earnings this week will be impactful as more than 25 U.S. Banks report Q1 to officially kick off the earnings season, will they add or subtract to market volatility? Stay tuned. (Watch for trading desk results to lead the way when the top 5 Banks report. Think precious metals trading earlier in the quarter.  GS, JPM, C, BAC, US.)

 Why banks report first

Banks usually close their books and finalize results quickly after quarter-end, so they are among the first major companies ready to report. Their businesses are also highly regulated and standardized, which makes their earnings schedules fairly predictable.

Why investors pay attention

Bank results matter beyond banking because they act as an economic bellwether. Strong or weak numbers from big lenders can influence sentiment across stocks, especially when they hint at changes in credit conditions, deposit trends, or consumer spending.

Why the market reacts

Earnings season is built around expectations, and bank reports often reset those expectations early. If banks beat or miss estimates, traders use that as a signal for how the rest of the season may unfold, which is why their reports can move markets right away.

 Earnings Next Week:

·        Mon. LVMH, Goldman Sachs, Fastenal

·        Tue. JP Morgan, J&J, Citigroup, BlackRock, Wells Fargo, BMW

·        Wed. BofA, Morgan Stanley, PNC, M7T Bank,

·        Thu.  Netflix, Pepsi, Abbot, Charles Schwab, Bank of New York Mellon, US Bancorp

·        Fri.   March McLennan, Truist Financial, StateStreetBank

FED SPEECHES: (all times CDT)

·        Mon.  Miran 5:20 pm

·        Tues.   Goolsbee 11:15 a.m. Barr 11:45am, Collina 12:00 pm

·        Wed. Barr 7:30 am, Bowman 12:45

·        Thu.  Williams 7:35am, Miran 9:45 am

·        Fri.   Barkin 11:15am, Waller 1:00pm

Econ Data:

·        Mon. Existing Home Sales

·        Tue.  NFIB Optimism Index, PPI. Redbook, API Crude Stock Change

·        Wed. New York State Empire index.  NAHB Housing Index, EIA Crude stocks, Biege Book

·        Thu. Initial Jobless claims, Philly Fed, industrial Prod., Nat Gas Stocks, Fed Balance Sheet

·        Fri. Quiet

Futures 102: The Daily Briefing by Cannon

Every morning, the world’s biggest banks and macro strategists publish where markets are headed. The rest of the world waits for the headline.

That intelligence stays locked inside trading desks, institutional terminals, and private client portals — accessible only to the few who pay for the privilege, and even they only get what they pay for.

This briefing changes that ( 100% FREE on Cannon’s website!!). Every morning we scour the open web and aggregate everything that matters — pulling from publicly available sources so you never have to — and distill it into one clear, readable edition you can get through before your first coffee is finished.

From the morning calls at Goldman Sachs and JPMorgan, to the independent macro voices moving markets, to the reporters who break desk leaks first — it’s all here, every day, in plain language.

No terminals. No subscriptions. No private portals. Just everything the market is saying, gathered in one place, every morning before the bell.

Read the Latest Briefing HERE and make sure to Bookmark this page!

What’s Your Trading Blood Type?

This article was published by the Stocks, Futures, & Options Magazine in June, 2004 and was written by our VP, Ilan Levy-Mayer. We think this article is timeless and whether you are beginner or advanced trader, you will enjoy it.

Perhaps the greatest luxury I have in this business is the ability to ob-serve the experiences of many traders with different personalities, life schedules and risk capital, each trading in a variety of markets.

What most astute brokers realize is that, over time, as some individuals pre-maturely exit winners while others desperately cling to losers, it be-comes quite possible to match different “blood types” of those trad-ers with their correct “trading diets.”

Clearly, we’re not talking the medical blood type here, but in the figurative sense it makes the right point. With practice, it’s not too hard to determine blood types (type of trading best suited to the individual) based on the personality of the trader and then prescribe a diet based on that individual trader’s capi-tal, experience, risk profile and schedule.

READ ARTICLE NOW

1ab82322 3fe6 467c 8a06 58a08d52f845

Cannon Edge — Your Daily Futures Insight for the Next Trading Day! Cannon Edge for April 13th, 2026

2e3c26f1 8e26 4a00 a508 dc5361cc0352

Cannon Edge is our new daily feature designed to give traders a fast, actionable overview of key futures markets. Each post delivers:

  • Current price and daily % change

  • 30‑day and 52‑week highs/lows

  • PROPRIETARY Short‑term and long‑term trend signals

  • Coverage across equity indices, metals, energies, currencies, and ags

Whether you’re scanning for breakout setups, trend reversals, or just staying informed — Cannon Edge puts the data in your hands before the open.

Built for speed. Backed by insight. Powered by CQG.

Would you like to get weekly updates on real-time, results of systems mentioned above?

Daily Levels for April 13th, 2026

d98f18cb 0fe0 4456 b201 20bab5ba0a42

Would you like to receive daily support & resistance levels?

Trading Reports for Next Week

First Notice (FN), Last trading (LT) Days for the Week:

www.mrci.com

e1895d71 52fa 4ac5 87e5 672bbac888a4

Find us on Trustpilot

4ad8134c aa57 4adb a428 7cc476773107

Trading Futures, Options on Futures, and retail off-exchange foreign currency transactions involves substantial risk of loss and is not suitable for all investors. You should carefully consider whether trading is suitable for you in light of your circumstances, knowledge, and financial resources. You may lose all or more of your initial investment. Opinions, market data, and recommendations are subject to change at any time.

Join our Private Facebook group

Subscribe to our YouTube Channel

Listen to our podcast: Subscribe on AppleSpotify, Amazon

or wherever you listen to podcasts!

S
Facebook  Instagram  LinkedIn
S
ef3ab1c9 8d6d 4e60 a3f1 af5d9d4ecbb3
Services
Software
Tools
Community
Contact

Crude Oil Numbers amidst Trump’s Deadline PLUS: Weekly Chinese Renminbi, CannonEdge Snapshot, Levels, Reports; Your 5 Important Must-Knows for Trading Futures on April 8th, 2026

9dc1e02e d5f7 4ff4 abf7 1df60775f196

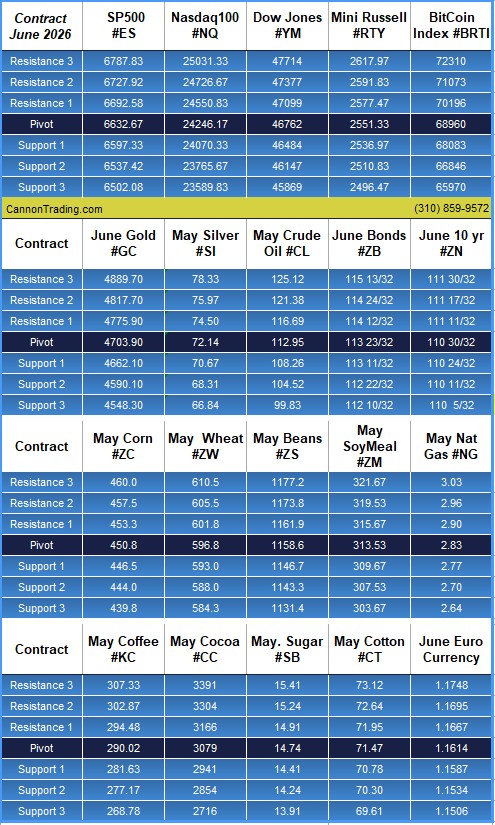
At-a-Glance Levels

Instrument S2 S1 Pivot R1 R2

Gold (GC)

— June (#GC)

4590.10 4662.10 4703.90 4775.90 4817.70

Silver (SI)

— May. (#SI)

68.31 70.67 72.14 74.50 75.97

Crude Oil (CL)

— May. (#CL)

104.52 108.26 112.95 116.69 121.38

 June Bonds (ZB)

— June. (#ZB)

112 22/32 113 11/32 113 23/32 114 12/32 114 24/32

Check out our Market Technical Analysis for the week HERE.

crude oil

Trump’s deadline tonight.

FOMC Minutes and crude oil numbers tomorrow.

Read tomorrows market brief before the open HERE.

7690a584 35fb 4331 93cb 91fcc6610064

Weekly Chinese Renminbi

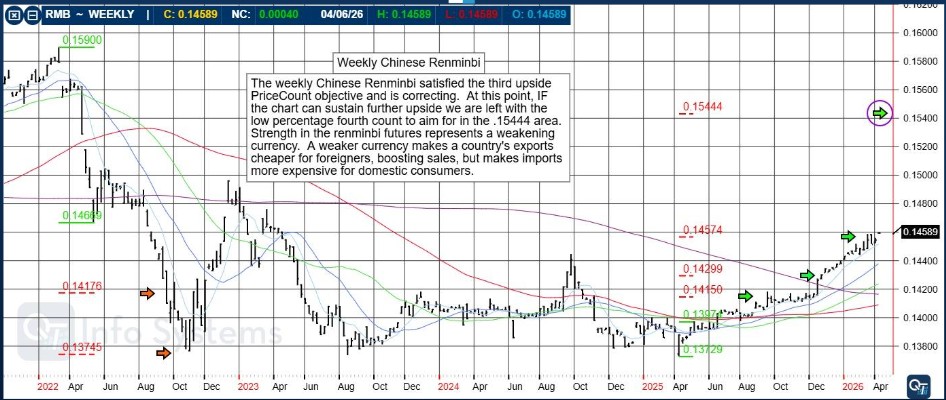
The Weekly Chinese Renminbi satisfied the third upside PriceCount objective and is correcting. At this point, IF the chart can sustain further upside we are left with the low percentage fourth count to aim for int he .15444 are. Strength in the renminbi futures represents a weakening currency. A weaker currency makes a country’s exports cheaper for foreigners, boosting sales, but makes imports more expensive for domestic consumers

a722b7e8 afe0 47a5 96b3 61121de8d136

The PriceCount study is a tool that can help to project the distance of a move in price. The counts are not intended to be an ‘exact’ science but rather offer a target area for the four objectives which are based off the first leg of a move with each subsequent count having a smaller percentage of being achieved.

It is normal for the chart to react by correcting or consolidating at an objective and then either resuming its move or reversing trend. Best utilized in conjunction with other technical tools, PriceCounts offer one more way to analyze charts and help to manage your positions and risk.

Learn more at www.qtchartoftheday.com

Trading in futures, options, securities, derivatives or OTC products entails significant risks which must be understood prior to trading and may not be appropriate for all investors. Past performance of actual trades or strategies is not necessarily indicative of future results.

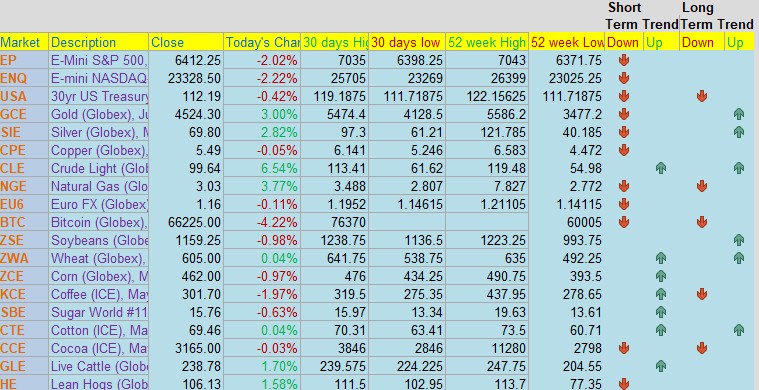
Cannon Edge — Your Daily Futures Snapshot for April 8th

3078f0da 0c23 4fb9 aae0 0bb4d2abb60a

Daily Levels for April 8th, 2026

56278d55 4c6f 4b50 8ee2 6c62354932bd

Want to feature our updated trading levels on your website? Simply paste a small code, and they’ll update automatically every day! 

Click here for quick and easy instructions.

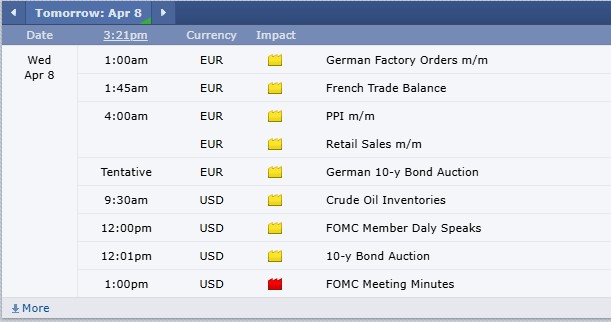
Economic Reports

provided by: ForexFactory.com

All times are Central Time ( Chicago)

cda7a5e3 0d91 4b80 aa78 3396b23ba8e9

Find us on Trustpilot

603cd3d5 1e3c 4435 85b1 f25c3ed5936e

Trading Futures, Options on Futures, and retail off-exchange foreign currency transactions involves substantial risk of loss and is not suitable for all investors. You should carefully consider whether trading is suitable for you in light of your circumstances, knowledge, and financial resources. You may lose all or more of your initial investment. Opinions, market data, and recommendations are subject to change at any time.

Join our Private Facebook group

Subscribe to our YouTube Channel

Listen to our podcast: Subscribe on AppleSpotify, Amazon

or wherever you listen to podcasts!

S
Facebook  Instagram  LinkedIn
S
ef3ab1c9 8d6d 4e60 a3f1 af5d9d4ecbb3
Services
Software
Tools
Community
Contact

Trading during War PLUS: NFP, Do Retreating Precious Metals Prices Offer a Buying Opportunity? CannonEdge Snapshot, Levels, Reports; Your 6 Important Can’t-Miss Need-To-Knows for Trading Futures the Week of March 30th, 2026

7cfe5b36 db9f 4933 824a 7f264613e7fe

Cannon Futures Weekly Letter

In Today’s Issue #1284

  • The Week Ahead – War, NFP, Good Friday!

  • Futures 102 – New, Exciting Tools for Cannon’s Clients!

  • Cannon Edge – Your Futures trading Map for the week ahead!

  • Hot Market of the Week – Precious Metals Recent Lows = Opportunity or Risk?

  • Trading Levels for Next Week
  • Trading Reports for Next Week

At-a-Glance Levels

Instrument S2 S1 Pivot R1 R2

Gold (GC)

— April (#GC)

4323.23 4430.57 4507.93 4615.27 4692.63

Silver (SI)

— May. (#SI)

65.40 67.70 69.74 72.03 74.07

Crude Oil (CL)

— April. (#CL)

89.06 94.5 97.52 102.96 105.98

 June Bonds (ZB)

— June. (#ZB)

111 4/32 111 24/32 112 10/32 112 30/32 113 16/32

What Futures Traders Should Watch This Week

By John Thorpe, Senior Broker

war

A loaded, shortened trading week. Non-Farm Payrolls on an exchange Holiday morning (CME Equities close @ 8:15 am; the report drops at 7:30 am CDT, energies and metals will not be open). The End of Q2, Chairman J. Powell speaks Monday early. AG Prospective plantings (this is a big one), Heavy Data, light earnings. Passover and plenty of fed speeches prior to the Good Friday-Easter weekend.

The IRAN War continues, speculation leads the volatility.

Historically, the second quarter (Q2: April–June) does tend to behave differently from the other quarters, but not in a dramatic or perfectly reliable way. There is a mild seasonal pattern in U.S. stocks, especially in the S&P 500, but it’s weaker than many people expect.

Average performance by quarter (long-term)

Using historical S&P 500 data since 1950:

  • Q1 (Jan–Mar): solid average returns
  • Q2 (Apr–Jun): usually positive but weaker
  • Q3 (Jul–Sep): typically the weakest and most volatile
  • Q4 (Oct–Dec): historically the strongest quarter

A simplified long-term pattern looks like:

Quarter

Typical relative strength

Q1

Strong

Q2

Moderate

Q3

Weakest

Q4

Strongest

Why Q2 often looks different

Several recurring factors affect April–June:

1. “Sell in May and go away”

This old market saying comes from a real seasonal tendency:

  • Returns from May–October have historically been lower than November–April.
  • Q2 contains May and June, which are often softer months on average.

2. Earnings and macro cycle timing

  • Q1 earnings season (April) can boost early Q2.
  • But the market often becomes more cautious later in the quarter as:
  • guidance is updated
  • macro data (inflation, Fed outlook) becomes clearer
  • This sometimes causes mid-year consolidations or corrections.

3. Investor behavior and liquidity

  • Summer vacation season begins late in Q2.
  • Lower trading volumes can lead to:
  • slower rallies
  • or sharper volatility when surprises hit.

But the key reality: differences are small

Even though these patterns exist:

  • Each quarter still has positive average returns over long periods.
  • The spread between quarters is only a few percentage points per year.
  • In any given year, macro events (Fed policy, recessions, AI booms, etc.) dominate seasonality.

For example, some of the strongest bull markets saw:

  • huge gains in Q2 during economic recoveries
  • and some crashes began in Q1 or Q3 instead.

Bottom line

Yes, Q2 is somewhat distinct:

  • usually not as strong as Q4
  • often better than Q3
  • but still positive on average

So, seasonality exists, but it’s a weak statistical tendency—not a trading rule you can rely on alone.

 Simple takeaway

The seasonal pattern often looks like:

Strong → Moderate → Weak → Strong

Q1 ██████

Q2 ████

Q3 ██

Q4 ███████

But this is only a statistical tendency, not a rule. In many years the strongest quarter can be Q2 or Q3 depending on macro events, earnings cycles, and interest rates.

 Earnings Next Week:

·        Mon. Quiet

·        Tue. Nike

·        Wed. Quiet

·        Thu.  Quiet

·        Fri.  Quiet

FED SPEECHES: (all times CDT)

·        Mon.  Chairman Powell 9:30 am , Williams 3:00 pm

·        Tues.  Goolsbee 11:00am, Barr 2:pm

·        Wed. Musalem 8:05 a.m., Barr 8:13 am

·        Thu. Logan 10:00 a.m.

·        Fri.  Good Friday

Econ Data: (all times CST)

·        Mon. Dallas Fed

·        Tue. Redbook, Case Shiller, CHGO PMI, JOLTS, Dallas Fed, PROSPECTIVE PLANTINGS, Redbook, API Crude Stock Change

·        Wed. Retail Sales, ISM, EIA Crude stocks,

·        Thu. Challenger Job Cuts, Initial Jobless claims, Nat Gas Stocks,  Fed Balance Sheet

·        Fri. NON-Farm Payrolls

Good Friday Modified Schedule

Futures 102: The Daily Briefing by Cannon

Every morning, the world’s biggest banks and macro strategists publish where markets are headed. The rest of the world waits for the headline.

That intelligence stays locked inside trading desks, institutional terminals, and private client portals — accessible only to the few who pay for the privilege, and even they only get what they pay for.

This briefing changes that (100% FREE on Cannon’s website!!). Every morning we scour the open web and aggregate everything that matters — pulling from publicly available sources so you never have to — and distill it into one clear, readable edition you can get through before your first coffee is finished.

From the morning calls at Goldman Sachs and JPMorgan, to the independent macro voices moving markets, to the reporters who break desk leaks first — it’s all here, every day, in plain language.

No terminals. No subscriptions. No private portals. Just everything the market is saying, gathered in one place, every morning before the bell.

Read the Latest Briefing HERE and make sure to Bookmark this page!

Do Retreating Precious Metals Prices Offer a Buying Opportunity?

By Erik Norland Chief Economist, CME Group

  • The Mideast conflict has heightened concerns over geopolitical uncertainty and inflation.
  • Gold has tumbled about $1,000 from its January peak amid reports of Mideast peace efforts.
  • Investor expectations for Fed rate cuts in 2026 are waning amid rising inflation concerns.
  • Any slowdown in global growth due to the Mideast conflict could lead to interest rate cuts.

➜ Read article

1ab82322 3fe6 467c 8a06 58a08d52f845

Cannon Edge — Your Daily Futures Insight for the Next Trading Day! Cannon Edge for March 30th, 2026

9d913a79 bd00 4c99 a4c8 ad35bb5eeb15

Cannon Edge is our new daily feature designed to give traders a fast, actionable overview of key futures markets. Each post delivers:

  • Current price and daily % change

  • 30‑day and 52‑week highs/lows

  • PROPRIETARY Short‑term and long‑term trend signals

  • Coverage across equity indices, metals, energies, currencies, and ags

Whether you’re scanning for breakout setups, trend reversals, or just staying informed — Cannon Edge puts the data in your hands before the open.

Built for speed. Backed by insight. Powered by CQG.

Would you like to get weekly updates on real-time, results of systems mentioned above?

Daily Levels for March 30th, 2026

c79e896c 34d4 4636 ac2a e8c9497cce98

Would you like to receive daily support & resistance levels?

Trading Reports for Next Week

First Notice (FN), Last trading (LT) Days for the Week:

www.mrci.com

e1bcec84 b62e 46da 8dfb f446550cc87e

Find us on Trustpilot

4ad8134c aa57 4adb a428 7cc476773107

Trading Futures, Options on Futures, and retail off-exchange foreign currency transactions involves substantial risk of loss and is not suitable for all investors. You should carefully consider whether trading is suitable for you in light of your circumstances, knowledge, and financial resources. You may lose all or more of your initial investment. Opinions, market data, and recommendations are subject to change at any time.

Join our Private Facebook group

Subscribe to our YouTube Channel

Listen to our podcast: Subscribe on AppleSpotify, Amazon

or wherever you listen to podcasts!

S
Facebook  Instagram  LinkedIn
S
ef3ab1c9 8d6d 4e60 a3f1 af5d9d4ecbb3
Services
Software
Tools
Community
Contact

 FOMC Rate Decision, Roll into June Equity Contracts PLUS: Futures 102 – How to Use the RSI while in a Trade, May KC – Chicago Wheat Spread, CannonEdge Snapshot, Levels, Reports; Your 6 Important Can’t-Miss Need-To-Knows for Trading Futures the Week of March 16th, 2026

7cfe5b36 db9f 4933 824a 7f264613e7fe

Cannon Futures Weekly Letter

In Today’s Issue #1282

  • The Week Ahead – Iran Crude Oil, FOMC & More!

  • Futures 102 – Trading Video – How to Use the RSI while in a Trade

  • Cannon Edge – Your Futures trading Map for the week ahead!

  • Hot Market of the Week – May KC – Chicago Wheat Spread

  • Broker’s Trading System of the Week – Gold Swing Trading System

  • Trading Levels for Next Week
  • Trading Reports for Next Week

At-a-Glance Levels

Instrument S2 S1 Pivot R1 R2

Gold (GC)

— April (#GC)

4937.43 4979.07 5055.73 5097.37 5174.03

Silver (SI)

— May. (#SI)

75.73 78.04 81.83 84.14 87.93

Crude Oil (CL)

— April. (#CL)

89.25 93.74 96.53 101.02 103.81

 June Bonds (ZB)

— June. (#ZB)

113 3/32 113 13/32 113 30/32 114 8/32 114 25/32

What Futures Traders Should Watch This Week

By John Thorpe, Senior Broker

 FOMC Rate Decision, Roll into June Equity contracts

equity

 Fertilizer and the continuing conflicts in the Middle East.

Jerome Powell’s second to last presser will be on Wednesday, 1:30 pm CDT. After the FOMC rate decision. The CME FedWatch tool is reflecting a 99% probability, as of today, remaining in the .035-.0375 % range. Investors will pay close attention to the language in the speech and q&a to follow and adjust their market positions accordingly, especially since the U.S. is heavily engaged in the Middle East conflict.

His final speech will be the April FOMC meeting before Trump’s man, Kevin Warsh, assumes the chairmanship. Warsh has expressed belief that, artificial Intelligence can boost productivity and lower costs, potentially offsetting inflation. Known as a Hawk on rates, his first meeting May, will be met with great anticipation given the current administration prefers a more dovish tone.

As many investors have been watching the fog of the  “Energy Sector” rally from the supply shock potential as a result of the fighting in the middle east, there are also substitutes in production for commodity contracts we also trade and have had the same directional bias. The Biofuels; Soybeans, Corn, Bean oil, Ethanol, these markets are all conducive to spread trading, spot vs deferreds, option spreads, product vs product like the traditional WTI, Unleaded , Heating oil and Nat. Gas markets.

The Urea market trades at the CME as well as the fertilizer market too has exploded with the threat of the Straits of Hormuz closing at the worst time for American farmers as they purchase the bulk of fertilizer in the spring time and over 20% of U.S. row crop fertilizer travels through the straights. Reach out to your broker if you are interested in these other products that a extremely liquid as well.

Begin trading the M26 contracts  June, M26 is the next month and year designation. Here is a quick Youtube Video on how to change your contract on CannonX (cqg StoneX) https://www.youtube.com/watch?v=AzeOgBa5HwA

We’ll see you next week! Please enjoy a safe and memorable weekend.

 Earnings Next Week:

·        Mon. Dollar Tree,

·        Tue. Lululemon

·        Wed. Tencent, Micron

·        Thu.  FedeX, Darden Restaurants

·        Fri.  Carnival

FED SPEECHES: (all times CST)

·        Mon.  quiet

·        Tues.   quiet

·        Wed. Jerome Powell 1:30 p.m. CDT

·        Thu.  quiet

·        Fri.   quiet

Econ Data: (all times CST)

·        Mon. NY Empire State mfg Index, Cap. Utilization, Industrial Production

·        Tue. ADP Weekly, Redbook, NAHB Housing, Pending Home Sales, API Crude Stock Change

·        Wed. Core PPI, Factory Orders, EIA Crude stocks, Fed Rate Decision, Economic projections, net long term tic flows

·        Thu. Building Permits, Initial Jobless claims, Philly Fed, new home sales Nat Gas Stocks, Fed Balance Sheet

·        Fri. Baker Hughes Rig Count

Futures 102: Using RSI as Your Trade‑Management GPS

In this week’s Futures 102 feature, broker Eli Gal Levy breaks down how he uses the Relative Strength Index (RSI) as a real‑time “GPS” while managing open trades ( in this video Crude Oil Futures).

Instead of treating RSI as a simple overbought/oversold indicator, Eli shows how it can guide position adjustments, confirm momentum, and help traders stay disciplined during fast markets.

Watch the video, and if you’d like to explore how tools like RSI can fit into your own trading plan, we’re offering a free consultation or free platform demo to help you take the next step with confidence

WATCH VIDEO HERE

thumbnail?url=https%3A%2F%2Fi.ytimg.com%2Fvi%2FU7Ke M03ETY%2Fhqdefault
1ab82322 3fe6 467c 8a06 58a08d52f845

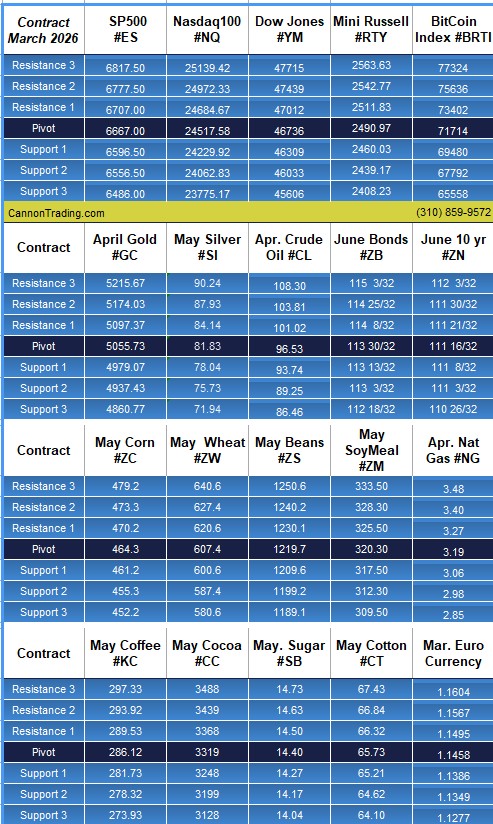
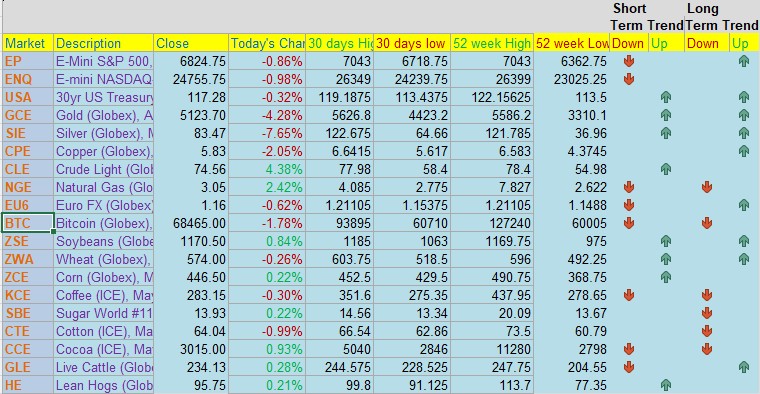
Cannon Edge — Your Daily Futures Insight for the Next Trading Day! Cannon Edge for March 16th 2026

984a60a1 5c31 4b0b 9d48 9191e6bab0bb

Cannon Edge is our new daily feature designed to give traders a fast, actionable overview of key futures markets.

Each post delivers:

  • Current price and daily % change

  • 30‑day and 52‑week highs/lows

  • PROPRIETARY Short‑term and long‑term trend signals

  • Coverage across equity indices, metals, energies, currencies, and ags

Whether you’re scanning for breakout setups, trend reversals, or just staying informed — Cannon Edge puts the data in your hands before the open.

Built for speed. Backed by insight. Powered by CQG.

Hot Market of the Week

Hot market of the week is provided by QT Market Center, A Swiss army knife charting package that’s not just for Hedgers, Cooperatives and Farmers alike but also for Spread traders, Swing traders and shorter time frame application for intraday traders with a unique proprietary indicator that can be applied to your specific trading needs.

Free Trial Available

May KC – Chicago Wheat Spread

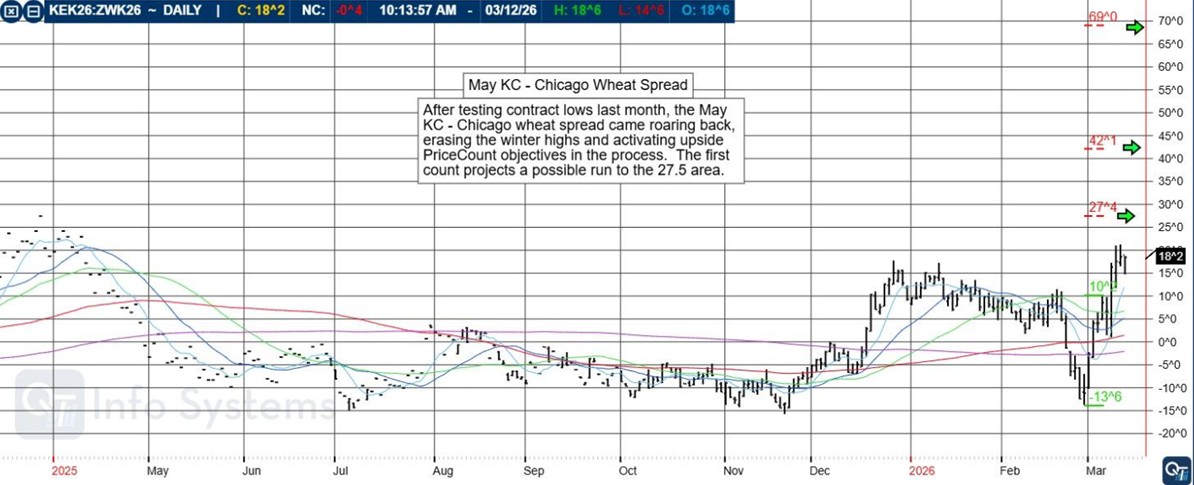
After testing contract lows last month, the May KC – Chicago wheat spread came roaring back, erasing the winter highs and activating upside PriceCount objectives in the process. The first count projects a possible run to the 27.5 area.

 Learn more spreads and seasonal patterns in commodity futures HERE

26ea2000 bfdc 417f a0fc cf455d7d4b94

The PriceCount study is a tool that can help to project the distance of a move in price. The counts are not intended to be an ‘exact’ science but rather offer a target area for the four objectives which are based off the first leg of a move with each subsequent count having a smaller percentage of being achieved.

It is normal for the chart to react by correcting or consolidating at an objective and then either resuming its move or reversing trend. Best utilized in conjunction with other technical tools, PriceCounts offer one more way to analyze charts and help to manage your positions and risk.

Learn more at www.qtchartoftheday.com

Trading in futures, options, securities, derivatives or OTC products entails significant risks which must be understood prior to trading and may not be appropriate for all investors. Past performance of actual trades or strategies is not necessarily indicative of future results.

Brokers Trading System of the Week

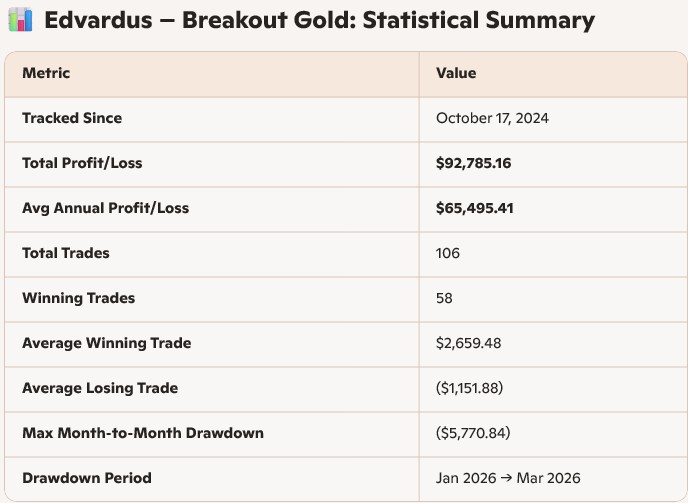
Edvardus – Breakout Gold Trading System SID#:3528

***Past performance may not be necessarily indicative of future results.

To learn more about this system, contact 800-454-9572 / 310-859-9572 or info@cannontrading.com .

This system is available for the 100 OZ gold contract and results below are based on the 100 oz contract – However, you can trade the same system logic and execution with the 10 Oz contract going as low as one micro gold which is 1/10 of the large contract.

System Description

Market Sector: Metals

Markets Traded:  GC , MGC

System Type: Swing Trading

Risk per Trade: varies

Trading Rules: Partially Disclosed

Suggested Capital: $60,000/ $6,000

Developer Fee per contract: $300.00/ $30 Monthly Subscription

System Description: 

Edvardus Breakout GOLD is a breakout swing trading strategy. It has passed robustness testing such as walk-forward analysis.

Get Started

Learn More

44591f4a 0c75 4a1c b797 117e6baa2330

Disclaimer The risk of trading can be substantial and each investor and/or trader must consider whether this is a suitable investment. Past performance is not necessarily indicative of future results.

System Trades Disclosure:

System Description

“System Description” is based upon information obtained from specific system marketing documents, system developers and/or system vendors themselves. While the information is believed to be reliable, we cannot guarantee its completeness or accuracy.

Actual Monthly Performance

The table and charts represent the monthly/quarterly/annual summation of actual trades based on system-specified contract(s) executed through Striker Securities, Inc. using the referenced trading system or system vendor for the stated time period. Commissions and monthly vendor fees are deducted from the tabulation. Results are based on 1 contract. If a client trades 2 contracts his gain or loss is twice as displayed (and so on).

This table is presented for information purposes only and is not a solicitation for the referenced system or vendor. The purpose of this information is for clients to compare their brokerage statements to what is displayed on Striker’s site. Striker as a matter of policy has no ownership with the referenced system or vendor or any other trading system or vendor. Past trade history may not be indicative of future results.

The results indicated here may or may not be typical of the performance of this system and, ALTHOUGH WE BELIEVE THIS INFORMATION TO BE ACCURATE, CANNON TRADING COMPANY MAKES NO ENDORSEMENT OF THIS OR ANY SYSTEM NOR WARRANTS ITS PERFORMANCE. This is not the only trading system that Striker executes for its clients. Potential traders should carefully investigate, evaluate and compare trading systems before investing capital. Some or all trading systems may involve an inappropriate level of risk for potential traders.

It is the nature of commodity trading that where there is the opportunity for profit, there is also the risk of loss. In opening an account through CANNON TRADING COMPANY, Customer acknowledges and agrees that he/she will rely solely upon the information that CANNON TRADING COMPANYprovides to you. Thus, all prior third-party materials provided are superseded by the information and disclosures provided by CANNON TRADING COMPANY.

Important Information About this Trading System Analysis

Statistics, tables, charts and other information on trading system monthly performance are based on actual trading unless otherwise specified. Actual dollar and percentage gains/losses experienced by investors would depend on many factors not accounted for in these statistics, including, but not limited to, starting account balances, market behavior, developer fees, incidence of split fills and other variations in order execution, and the duration and extent of individual investor participation in the specified system.

While the information and statistics given are believed to be complete and accurate we cannot guarantee their completeness or accuracy as they results are key punched and subject to human error. Performance information is not the performance of a single account, but a compilation of several accounts over time, and is based on the physical trading ticket.

THIS INFORMATION IS PROVIDED FOR EDUCATIONAL/ INFORMATIONAL PURPOSES ONLY AND USED BY CURRENT CLIENTS TO AUDIT THEIR STATEMENTS TO STRIKER SITE. These results are not indicative of, and have no bearing on, any individual results that may be attained by the trading system in the future.

This trading system, like any other, may involve an inappropriate level of risk for prospective investors. THE RISK OF LOSS IN TRADING COMMODITY FUTURES AND OPTIONS CAN BE SUBSTANTIAL AND MAY NOT BE SUITABLE FOR ALL INVESTORS. Prior to purchasing or leasing a trading system from this or any other system vendor or investing in a trading system with a registered commodity trading representative, investors need to carefully consider whether such trading is suitable for them in light of their own specific financial condition. In some cases, futures accounts are subject to substantial charges for commission, management, incentive or advisory fees.

It may be necessary for accounts subject to these charges to make substantial trading profits to avoid depletion or exhaustion of their assets. In addition, one should carefully study the accompanying prospectus, account forms, disclosure documents and/or risk disclosure statements required by the CFTC or NFA, which are provided directly by the system vendor and/or CTA’s.

The information contained in this report is provided with the objective of “standardizing” trading systems measurements, and it is intended for educational /informational purposes only. All information is offered with the understanding that an investor considering purchasing or leasing a system must carry out his/her own research and due diligence in deciding whether to purchase or lease any trading system noted within or without this report. This report does not constitute a solicitation to purchase or invest in any trading system which may be mentioned herein.

CANNON TRADING COMPANY AND STRIKER SECURITES, INC. MAKES NO ENDORSEMENT OF THIS OR ANY OTHER TRADING SYSTEM NOR WARRANTS ITS PERFORMANCE. THIS IS NOT A SOLICITATION TO PURCHASE OR SUBSCRIBE TO ANY TRADING SYSTEM.

Futures Trading Disclaimer:

Transactions in securities futures, commodity and index futures and options on futures carry a high degree of risk. The amount of initial margin is small relative to the value of the futures contract, meaning that transactions are heavily “leveraged”. A relatively small market movement will have a proportionately larger impact on the funds you have deposited or will have to deposit: this may work against you as well as for you. You may sustain a total loss of initial margin funds and any additional funds deposited with the clearing firm to maintain your position.

If the market moves against your position or margin levels are increased, you may be called upon to pay substantial additional funds on short notice to maintain your position.

If you fail to comply with a request for additional funds within the time prescribed, your position may be liquidated at a loss and you will be liable for any resulting deficit.

Would you like to get weekly updates on real-time, results of systems mentioned above?

Daily Levels for March 16th, 2026

cfb10129 5328 43c8 a64a 7f9000ef0618

Would you like to receive daily support & resistance levels?

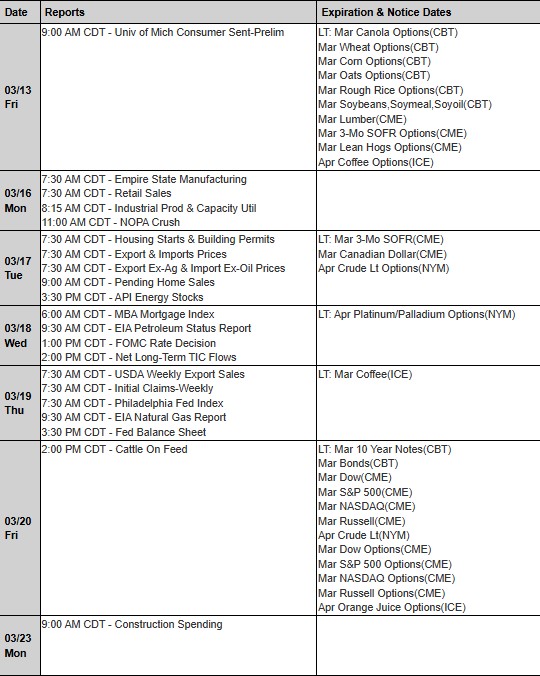
Trading Reports for Next Week

First Notice (FN), Last trading (LT) Days for the Week:

www.mrci.com

47aeb4b1 dde4 49a0 9237 07d3f4722209

Find us on Trustpilot

4ad8134c aa57 4adb a428 7cc476773107

Trading Futures, Options on Futures, and retail off-exchange foreign currency transactions involves substantial risk of loss and is not suitable for all investors. You should carefully consider whether trading is suitable for you in light of your circumstances, knowledge, and financial resources. You may lose all or more of your initial investment. Opinions, market data, and recommendations are subject to change at any time.

Join our Private Facebook group

Subscribe to our YouTube Channel

Listen to our podcast: Subscribe on AppleSpotify, Amazon

or wherever you listen to podcasts!

S
Facebook  Instagram  LinkedIn
S
ef3ab1c9 8d6d 4e60 a3f1 af5d9d4ecbb3
Services
Software
Tools
Community
Contact

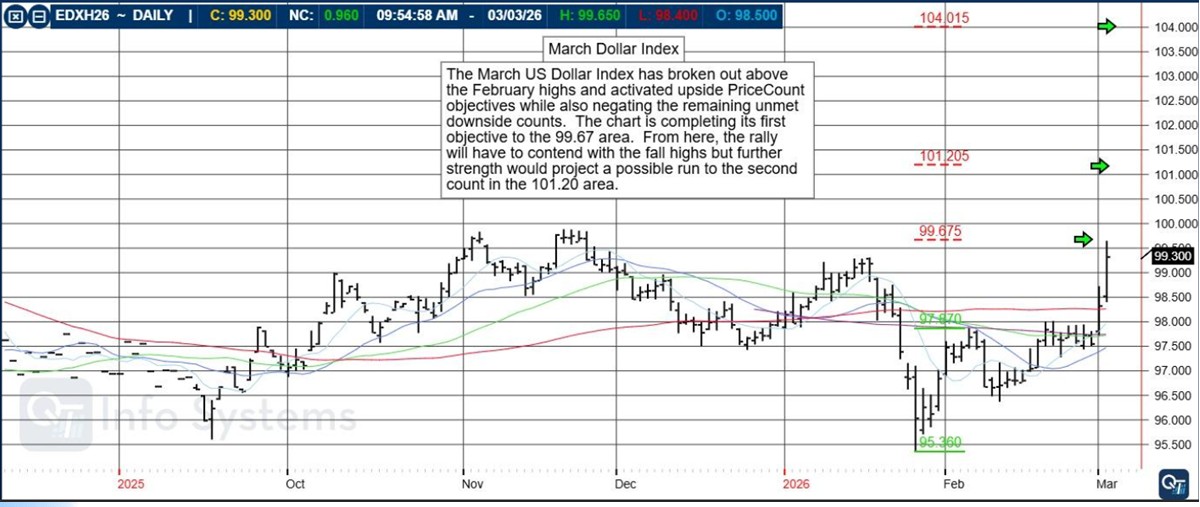
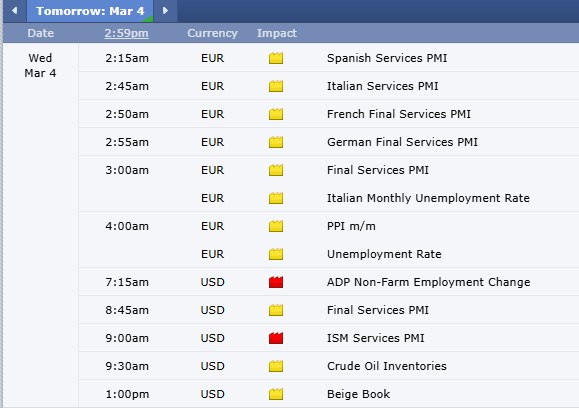
Iran & The Markets PLUS: March Dollar Index, Levels, Reports; Your 4 Important Can’t-Miss Need-To-Knows for Trading Futures on March 4th, 2026

9dc1e02e d5f7 4ff4 abf7 1df60775f196

Iran & The Markets

By John Thorpe, Senior Broker

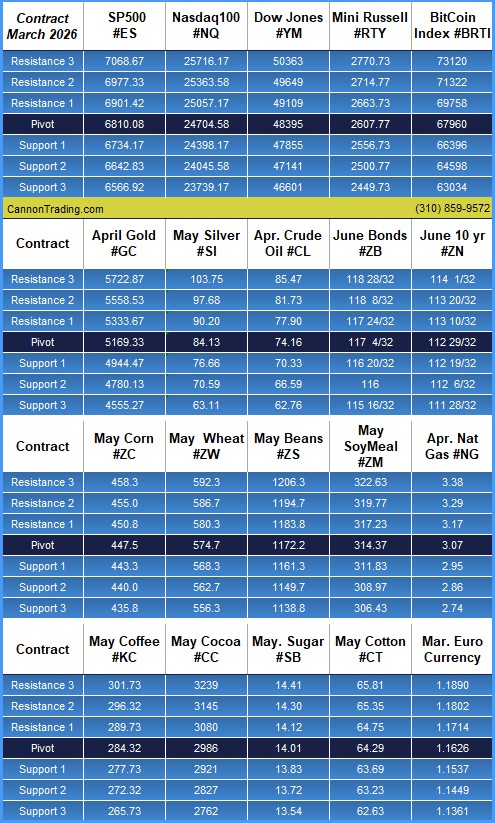
At-a-Glance Levels

Instrument S2 S1 Pivot R1 R2

Gold (GC)

— April (#GC)

4780.13 4944.47 5169.33 5333.67 5558.53

Silver (SI)

— Mar. (#SI)

70.59 76.66 84.13 90.20 97.68

Crude Oil (CL)

— April. (#CL)

66.59 70.33 74.16 77.90 81.73

 Mar. Bonds (ZB)

— Mar. (#ZB)

116 116 20/32 117 4/32 117 24/32 118 8/32

Equities get legs on back-to-back days.

iran

After a strong case that can be made for the S&P index completing the Elliot Wave 5th wave that began in November, the 6750 .00 price level has, so far, proven to be resilient. In the face of global uncertainty, it seems inertia has levitated the index just when it looked like the price was going to breakdown and violate the 200 day moving average on a closing basis in the mid 6700’s.

On each of the past two days, the index has rallied off it’s early session lows, flirting with the MA.

Crude Oil and energy by-products on a run to the upside

As of March 3, 2026,

The Strait of Hormuz is currently in a state of de facto closure. While it remains technically and legally open as an international waterway, it is effectively impassable for most commercial shipping due to extreme security risks and the withdrawal of insurance coverage.

On Truth Social, Pres. Trump recently addressed this “If necessary, the United States Navy will begin escorting tankers through the Strait of Hormuz, as soon as possible.

No matter what, the United States will ensure the FREE FLOW of ENERGY to the WORLD. The United States’ ECONOMIC and MILITARY MIGHT is the GREATEST ON EARTH — More actions to come,” in a retort to the IRGC threatening to attack any ship in the strait, hours before.

Current Status & Conflicting Claims

  • Iran’s Position: Senior officials from Iran’s Islamic Revolutionary Guard Corps (IRGC) officially declared the strait “closed” on March 2, 2026. They have issued radio warnings stating they will “set ablaze” any ship attempting to cross.
  • U.S. Position: U.S. Central Command (CENTCOM) continues to maintain that the strait is not closed and remains a protected international waterway.
  • Operational Reality: Despite the legal dispute, maritime traffic has slowed to a crawl. Major shipping firms like Hapag-Lloyd, CMA CGM, and MSC have suspended all transits through the region to protect their crews and vessels.

Key Factors Driving the Disruption

  • Insurance Withdrawal: Most maritime insurers have withdrawn war-risk coverage for the Persian Gulf, making it economically unviable for ship owners to enter the area.
  • Physical Attacks: Several tankers have reportedly been struck or damaged by Iranian fire and drone attacks over the past few days, leading to a “critical” risk assessment for the region.
  • Global Impact: Approximately 20% of global oil and gas supply passes through this chokepoint. The current disruption has caused a sharp spike in energy prices, with Brent crude opening significantly higher this week.
  • Diplomatic Pressure: China, the largest importer of oil passing through the strait, is reportedly pressuring Iran to keep the waterway open to safeguard its energy security.

Response:

OPEC’s main response so far has been to signal a modest production increase while publicly downplaying panic about supply, even as members leave room to adjust if the crisis worsens.

Production decisions

  • OPEC+ has agreed to boost output quotas by about 206,000 barrels per day starting in April, a slightly larger hike than the earlier plan of roughly 137,000 bpd.
  • The group frames this as a continuation of its gradual unwinding of past cuts, not an emergency surge, and says it retains “flexibility” to change the pace depending on market conditions.

Official messaging

  • In public statements and leaks via delegates, OPEC+ cites a “steady” global economic outlook and “healthy” market fundamentals, avoiding direct reference to the Iran war even though the timing is clearly linked.
  • Key Gulf producers have warned privately that military action against Iran could push prices above 100 dollars, signaling to Washington and others that the conflict poses serious risks despite the small quota hike.

Constraints and limits

  • Analysts note that only a few members (mainly Saudi Arabia and the UAE) hold significant spare capacity, so any OPEC+ increase beyond a couple of hundred thousand bpd would be hard to deliver in practice.
  • Several experts argue the announced 206,000 bpd increase cannot fully offset a prolonged disruption through the Strait of Hormuz, since the main bottleneck is now logistics and transit risk rather than wellhead production.

Practical behavior by key members

  • Saudi Arabia, Iraq, Kuwait, and the UAE had already been nudging exports higher in the run‑up to and immediately after the strikes, anticipating tighter balances and higher prices.
  • Russia and other members in the voluntary “V8” subgroup joined the announced adjustment, signaling a coordinated move to show responsiveness without flooding the market.​

Plan your trades and trade your plans

Cannon Edge for March 4th

4b2121a0 d840 4a01 97a7 98ab35f727b1

Introducing Cannon Edge — Your Daily Futures Snapshot Above

Cannon Edge is our new daily feature designed to give traders a fast, actionable overview of key futures markets. Each post delivers:

  • Current price and daily % change

  • 30‑day and 52‑week highs/lows

  • PROPRIETARY Short‑term and long‑term trend signals

March Dollar Index

The March US Dollar Index has broken out above the February highs and activated upside PriceCount objectives while also negating the remaining unmet downside counts. The chart is completing its first objective to the 99.67 area. From here, the rally will have to contend with the fall highs but further strength would project a possible run to the second count in the 101.20 area.

FREE TRIAL AVAILABLE

5650b3db cd9a 4ed4 8782 bf81d1188dfa

The PriceCount study is a tool that can help to project the distance of a move in price. The counts are not intended to be an ‘exact’ science but rather offer a target area for the four objectives which are based off the first leg of a move with each subsequent count having a smaller percentage of being achieved.

It is normal for the chart to react by correcting or consolidating at an objective and then either resuming its move or reversing trend. Best utilized in conjunction with other technical tools, PriceCounts offer one more way to analyze charts and help to manage your positions and risk.

Learn more at www.qtchartoftheday.com

Trading in futures, options, securities, derivatives or OTC products entails significant risks which must be understood prior to trading and may not be appropriate for all investors. Past performance of actual trades or strategies is not necessarily indicative of future results.

Daily Levels for March 4th, 2026

47ef69bb c0fc 400e b27e 0bc953a9ae6d

Want to feature our updated trading levels on your website? Simply paste a small code, and they’ll update automatically every day! 

Click here for quick and easy instructions.

Economic Reports

provided by: ForexFactory.com

All times are Central Time ( Chicago)

23744a49 9d0a 4e0a bd6e 17161bc6b86b

Find us on Trustpilot

603cd3d5 1e3c 4435 85b1 f25c3ed5936e

Trading Futures, Options on Futures, and retail off-exchange foreign currency transactions involves substantial risk of loss and is not suitable for all investors. You should carefully consider whether trading is suitable for you in light of your circumstances, knowledge, and financial resources. You may lose all or more of your initial investment. Opinions, market data, and recommendations are subject to change at any time.

Join our Private Facebook group

Subscribe to our YouTube Channel

Listen to our podcast: Subscribe on AppleSpotify, Amazon

or wherever you listen to podcasts!

S
Facebook  Instagram  LinkedIn
S
ef3ab1c9 8d6d 4e60 a3f1 af5d9d4ecbb3
Services
Software
Tools
Community
Contact