Weekly Newsletters, Futures Trading Tips & Insight, Commodity Trading Educational Resources & Much More.
Hello Traders,
For 2014 I would like to wish all of you discipline and patience in your trading!
Time sure does tick a bit different in the commodities and futures world….
Some traders know time has passed quickly when it is time to change to the Dec. contract versus the Sept. contract, others may notice it when they think “wow, monthly unemployment is this Friday, time sure flies…” and still other traders, perhaps professionals and money managers notice it when one month ends and another starts and it is time to share monthly results with their clients…..
Either way you look at it, hope October will be a great trading month!
Today I noticed a couple of market behaviors I have noticed in the past and wanted to share with you.
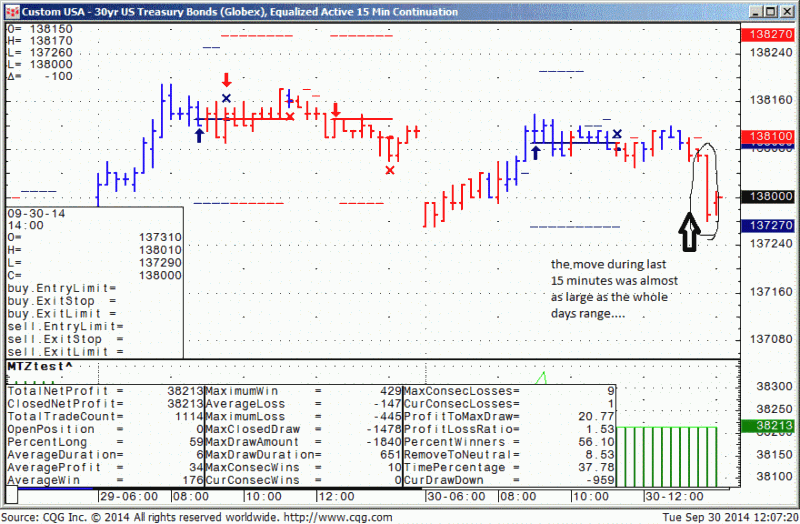
The first is us Bonds trading behavior on the last trading day of the month on the last 15 minutes of the old pit session, i.e. 13:45 to 14:00 central time.
While I did not spend any time trying to predict the direction of the move, I seen it many times, the bonds will make a 10-15 ticks ( 15 tick in bonds = $500 per contract) move during the last 15 minutes as large traders position themselves ahead of months close.
Below is a 15 minute chart of Bonds from today….notice the very tight range all day long until the last 15 minutes….if you go back to the last trading day of the month, you will notice this pattern more often than not. Of course, I leave the important work to you…and that is which way and how can one try to take advantage of it….PS: My trade system below missed entering the short by 1 tick )-:

Custom USA – 30Yr US Treasury Bonds (Globex), Equalized Active 15Min Continuation
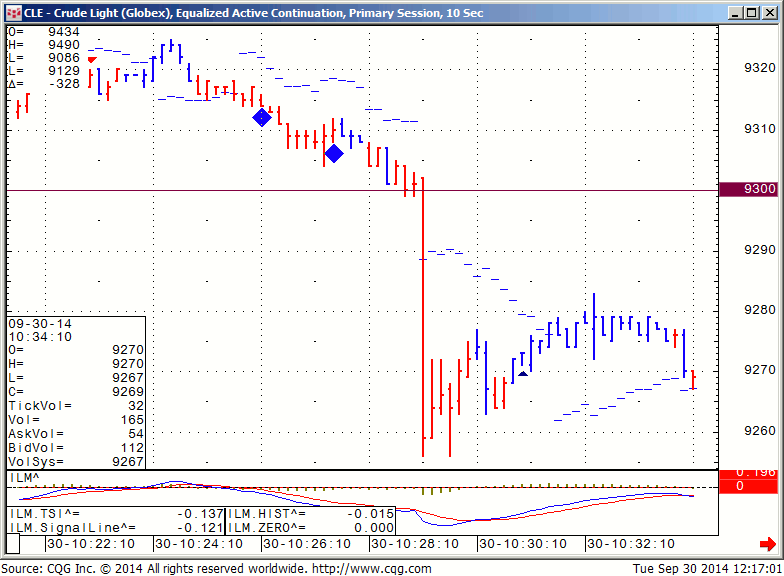
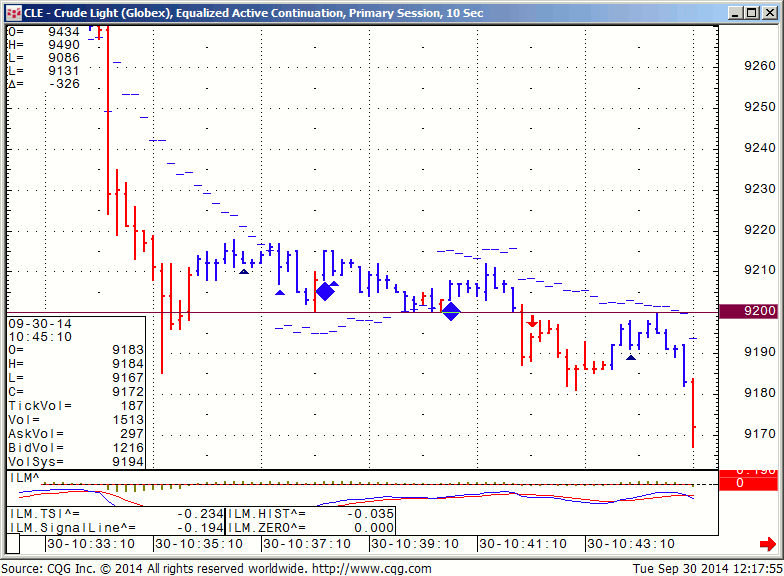
The second pattern for you to investigate if interested is the behavior of crude oil futures around “round numbers”. Today was obviously a HUGE move in crude ( down over $3 or $3000 per contract or 3.5%) but notice the 10 seconds chart I am sharing with ( yes, seconds, not minutes…) of what happened when crude broke below 93.00 and 92.00 today…..Once again, the million dollar question, how and can you take advantage of it? Obviously in this case it seems like there were MANY sell stops placed right below the round numbers which resulted in another accelerated move to the down side.
Crude breaking below $93.00

CLE – Crude Light (Globex), Equalized Active Continuation, Primary Session, 10Sec
Crude breaking below $92.00

CLE – Crude Light (Globex), Equalized Active Continuation, Primary Session, 10Sec
GOOD TRADING !
Trading Futures, Options on Futures, and retail off-exchange foreign currency transactions involves substantial risk of loss and is not suitable for all investors. You should carefully consider whether trading is suitable for you in light of your circumstances, knowledge, and financial resources. You may lose all or more of your initial investment. Opinions, market data, and recommendations are subject to change at any time. Past performance is not indicative to future results.
If you like Our Futures Trading Daily Support and Resistance Levels, Please share!
Futures Trading Levels
| Contract Dec. 2014 | SP500 | Nasdaq100 | Dow Jones | Mini Russell | Dollar Index |
| Resistance 3 | 1992.25 | 4104.58 | 17169 | 1133.17 | 87.09 |
| Resistance 2 | 1985.25 | 4084.67 | 17116 | 1125.43 | 86.71 |
| Resistance 1 | 1975.00 | 4064.08 | 17038 | 1110.97 | 86.37 |
| Pivot | 1968.00 | 4044.17 | 16985 | 1103.23 | 86.00 |
| Support 1 | 1957.75 | 4023.58 | 16907 | 1088.77 | 85.66 |
| Support 2 | 1950.75 | 4003.67 | 16854 | 1081.03 | 85.28 |
| Support 3 | 1940.50 | 3983.08 | 16776 | 1066.57 | 84.94 |
| Contract | December Gold | Dec.Silver | Nov. Crude Oil | Dec. Bonds | Dec. Euro |
| Resistance 3 | 1235.0 | 18.19 | 97.97 | 139 2/32 | 1.2837 |
| Resistance 2 | 1227.9 | 17.88 | 96.44 | 138 25/32 | 1.2773 |
| Resistance 1 | 1218.6 | 17.46 | 93.93 | 138 13/32 | 1.2705 |
| Pivot | 1211.5 | 17.16 | 92.40 | 138 4/32 | 1.2641 |
| Support 1 | 1202.2 | 16.74 | 89.89 | 137 24/32 | 1.2573 |
| Support 2 | 1195.1 | 16.43 | 88.36 | 137 15/32 | 1.2509 |
| Support 3 | 1185.8 | 16.01 | 85.85 | 137 3/32 | 1.2441 |
| Contract | Dec Corn | Dec. Wheat | Nov. Beans | Dec. SoyMeal | Dec. bean Oil |
| Resistance 3 | 329.2 | 490.0 | 944.17 | 311.30 | 33.25 |
| Resistance 2 | 327.1 | 484.3 | 937.08 | 308.30 | 33.02 |
| Resistance 1 | 323.9 | 481.0 | 925.17 | 303.60 | 32.70 |
| Pivot | 321.8 | 475.3 | 918.08 | 300.60 | 32.47 |
| Support 1 | 318.7 | 472.0 | 906.2 | 295.9 | 32.1 |
| Support 2 | 316.6 | 466.3 | 899.08 | 292.90 | 31.92 |
| Support 3 | 313.4 | 463.0 | 887.17 | 288.20 | 31.60 |
| Date | 10:18am | Currency | Impact | Detail | Actual | Forecast | Previous | Graph | |
|---|---|---|---|---|---|---|---|---|---|
| WedOct 1 | 3:15am | EUR | Spanish Manufacturing PMI | 52.6 | 52.3 | 52.8 | |||
| 3:45am | EUR | Italian Manufacturing PMI | 50.7 | 49.4 | 49.8 | ||||
| 4:00am | EUR | Final Manufacturing PMI | 50.3 | 50.5 | 50.5 | ||||
| 5:33am | EUR | German 10-y Bond Auction | 0.93|1.1 | 1.05|1.4 | |||||
| 8:15am | USD | ADP Non-Farm Employment Change | 213K | 207K | 202K | ||||
| 9:45am | USD | Final Manufacturing PMI | 57.5 | 58.0 | 57.9 | ||||
| 10:00am | USD | ISM Manufacturing PMI | 56.6 | 58.6 | 59.0 | ||||
| USD | Construction Spending m/m | -0.8% | 0.5% | 1.2% | |||||
| USD | ISM Manufacturing Prices | 59.5 | 56.8 | 58.0 | |||||
| 10:30am | USD | Crude Oil Inventories | 0.6M | -4.3M | |||||
| All Day | USD | Total Vehicle Sales | 16.9M | 17.5M |
This is not a solicitation of any order to buy or sell, but a current market view provided by Cannon Trading Inc. Any statement of facts here in contained are derived from sources believed to be reliable, but are not guaranteed as to accuracy, nor they purport to be complete. No responsibility is assumed with respect to any such statement or with respect to any expression of opinion herein contained. Readers are urged to exercise their own judgment in trading.


