Weekly Newsletters, Futures Trading Tips & Insight, Commodity Trading Educational Resources & Much More.
____________________________________________________________________
Voted #1 Blog and #1 Brokerage Services on TraderPlanet for 2016!!
____________________________________________________________________
Dear Traders,
Trading was MUCH lighter today than normal…mini SP volume is normally above 1,000,000 contracts per day. Today volume was approx. 300000.
I suspect the lower volume to continue until next Tuesday when we start trading for 2018.
Don’t confuse low volume with “dead price action”. The lower volume can sometimes help exaggerate price moves when certain news or events take place.
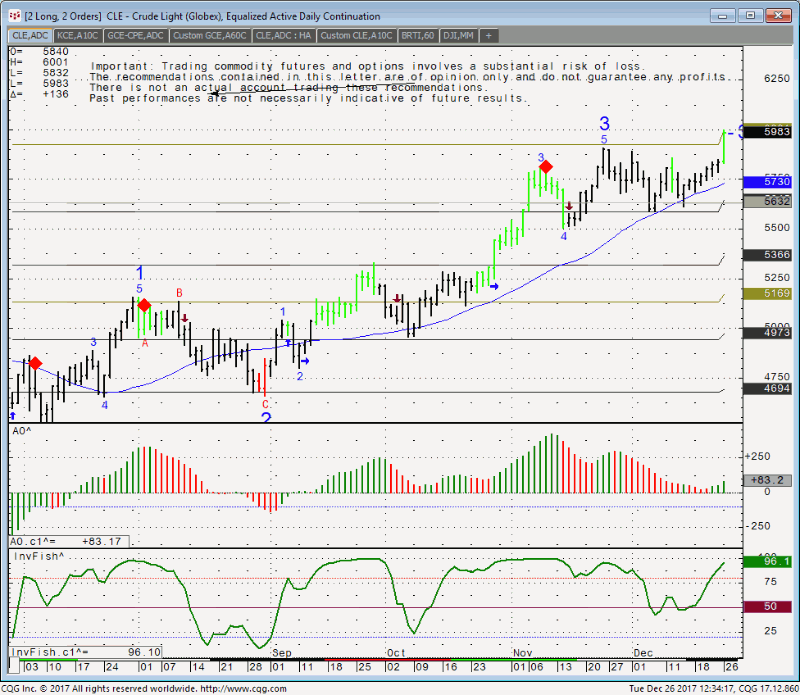
The market of today, was definitely crude oil (yes not bitcoin futures this time…). The front month, February touched 60.01 for the first time in
months, maybe couple of years…
Daily chart for review below:

Good Trading!
Trading Futures, Options on Futures, and retail off-exchange foreign currency transactions involves substantial risk of loss and is not suitable for all investors. You should carefully consider whether trading is suitable for you in light of your circumstances, knowledge, and financial resources. You may lose all or more of your initial investment. Opinions, market data, and recommendations are subject to change at any time.
Futures Trading Levels
12-27-2017
| Contract March 2017 | SP500 | Nasdaq100 | Dow Jones | Mini Russell | BitCoin Index |
| Resistance 3 | 2695.83 | 6550.50 | 24908 | 1558.63 | 18758.33 |
| Resistance 2 | 2692.67 | 6521.25 | 24853 | 1554.47 | 17447.08 |
| Resistance 1 | 2689.83 | 6490.75 | 24817 | 1551.73 | 16606.42 |
| Pivot | 2686.67 | 6461.50 | 24762 | 1547.57 | 15295.17 |
| Support 1 | 2683.83 | 6431.00 | 24726 | 1544.83 | 14454.51 |
| Support 2 | 2680.67 | 6401.75 | 24671 | 1540.67 | 13143.26 |
| Support 3 | 2677.83 | 6371.25 | 24635 | 1537.93 | 12302.60 |
| Contract | Feb. Gold | Mar. Silver | Feb. Crude Oil | Mar. Bonds | Mar. Euro |
| Resistance 3 | 1302.2 | 16.99 | 62.10 | 152 22/32 | 1.1997 |
| Resistance 2 | 1295.3 | 16.81 | 61.05 | 152 8/32 | 1.1979 |
| Resistance 1 | 1291.5 | 16.71 | 60.41 | 151 27/32 | 1.1959 |
| Pivot | 1284.6 | 16.54 | 59.36 | 151 13/32 | 1.1941 |
| Support 1 | 1280.8 | 16.44 | 58.72 | 151 | 1.1921 |
| Support 2 | 1273.9 | 16.26 | 57.67 | 150 18/32 | 1.1903 |
| Support 3 | 1270.1 | 16.16 | 57.03 | 150 5/32 | 1.1883 |
| Contract | Mar. Corn | Mar. Wheat | March Beans | Mar. SoyMeal | Feb. Nat Gas |
| Resistance 3 | 355.9 | 431.8 | 986.33 | 324.97 | 2.86 |
| Resistance 2 | 354.6 | 429.3 | 980.17 | 323.13 | 2.81 |
| Resistance 1 | 353.7 | 425.8 | 975.33 | 321.27 | 2.73 |
| Pivot | 352.3 | 423.3 | 969.17 | 319.43 | 2.68 |
| Support 1 | 351.4 | 419.8 | 964.3 | 317.6 | 2.6 |
| Support 2 | 350.1 | 417.3 | 958.17 | 315.73 | 2.55 |
| Support 3 | 349.2 | 413.8 | 953.33 | 313.87 | 2.47 |
Economic Reports, source:

This is not a solicitation of any order to buy or sell, but a current market view provided by Cannon Trading Inc. Any statement of facts here in contained are derived from sources believed to be reliable, but are not guaranteed as to accuracy, nor they purport to be complete. No responsibility is assumed with respect to any such statement or with respect to any expression of opinion herein contained. Readers are urged to exercise their own judgement in trading.


