Weekly Newsletters, Futures Trading Tips & Insight, Commodity Trading Educational Resources & Much More.
Connect with Us! Use Our Futures Trading Levels and Economic Reports RSS Feed.
![]()
![]()
![]()
![]()
![]()
![]()
1. Market Commentary
2. Futures Support and Resistance Levels – S&P, Nasdaq, Dow Jones, Russell 2000, Dollar Index
3. Commodities Support and Resistance Levels – Gold, Euro, Crude Oil, T-Bonds
4. Commodities Support and Resistance Levels – Corn, Wheat, Beans, Silver
5. Futures Economic Reports for Wednesday July 23, 2014
Hello Traders,
For 2014 I would like to wish all of you discipline and patience in your trading!
I mentioned in previous posts that I am getting to like range bar charts and Renko charts more and more when it comes for very short term trading.
The main reason why I like these type of charts along with volume charts when it comes to any time frame less than 10 minutes is because I think it helps filter out noise during slow times and help you get a quicker signal when there is time of heavier action in the market.
Example, let’s say you are using a 5 minute chart along with certain studies, to make a simple example, moving averages cross overs. Before you get a signal, the 5 minute bar has to finish so you can see the value of the moving averages and see if you got a cross over or not. There are times when the market is fast with heavy volume and you may miss 80% of the move because 5 minutes can be a long time for day traders…..On the other hand if you are using Renko/volume charts/Range bars and there is good volume, fast action, these bars will complete much faster to provide a much faster signal. On the same token, if the market is slow with low volume, you will sometimes get your moving averages cross over simply because time has passed….With volume / Renko charts you may be able to filter this out simply because the bars WONT complete unless there is enough volume/ price action. Obviously, these type of charts are by no means “holly grail” but I think one should observe and pay attention to the type of charts especially if you are a short term day trader.
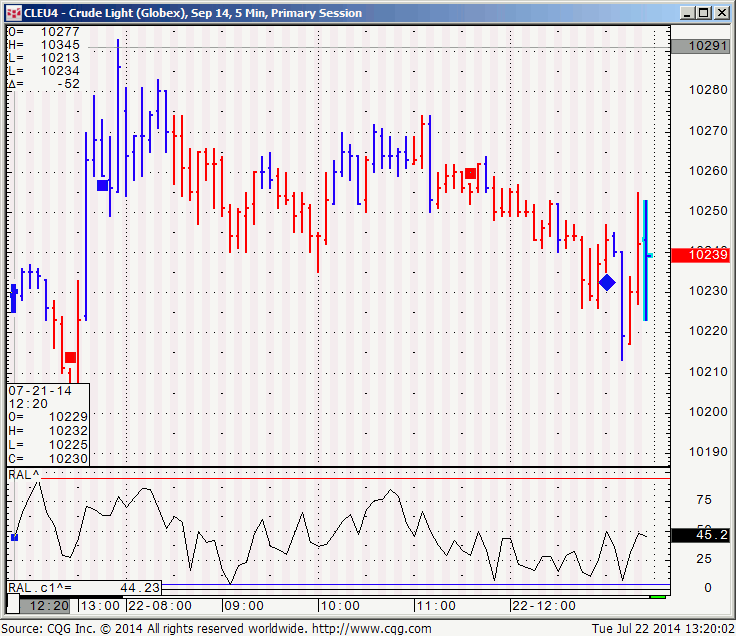
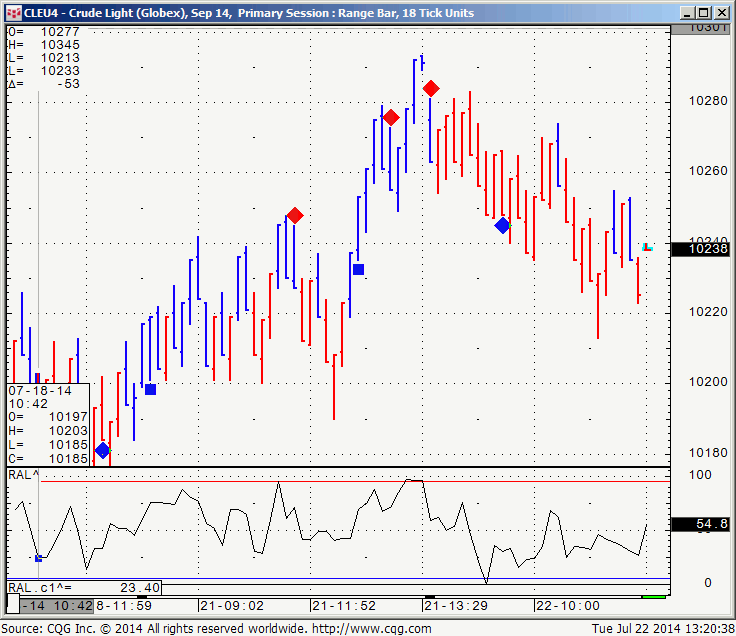
Below is an example of crude oil 18 ticks range bar from today as well as a 5 minutes chart from today with the same studies/ conditions applied just to get a visual idea. If you like to try out the same charts I am sharing, feel free to contact Cannon Futures Trading and we will set you up for a free trial:
Crude Oil 5 minute chart 7-22-2014

Crude Oil 5 Minute Chart 7-22-2014
Crude Oil 18 ticks range Bar chart 7-22-2014

Crude Oil 18 Ticks Range Bar Chart 7-22-2014
If you like the information we share? We would appreciate your positive reviews on our new yelp!!
GOOD TRADING
Trading Futures, Options on Futures, and retail off-exchange foreign currency transactions involves substantial risk of loss and is not suitable for all investors. You should carefully consider whether trading is suitable for you in light of your circumstances, knowledge, and financial resources. You may lose all or more of your initial investment. Opinions, market data, and recommendations are subject to change at any time. Past performance is not indicative to future results.
If you like Our Futures Trading Daily Support and Resistance Levels, Please share!
| Contract Sept. 2014 | SP500 | Nasdaq100 | Dow Jones | Mini Russell | Dollar Index |
| Resistance 3 | 1997.33 | 4001.33 | 17168 | 1173.97 | 81.29 |
| Resistance 2 | 1988.92 | 3980.42 | 17119 | 1165.73 | 81.11 |
| Resistance 1 | 1982.08 | 3965.58 | 17075 | 1157.87 | 80.98 |
| Pivot | 1973.67 | 3944.67 | 17026 | 1149.63 | 80.79 |
| Support 1 | 1966.83 | 3929.83 | 16982 | 1141.77 | 80.66 |
| Support 2 | 1958.42 | 3908.92 | 16933 | 1133.53 | 80.48 |
| Support 3 | 1951.58 | 3894.08 | 16889 | 1125.67 | 80.35 |
| Contract | August Gold | Sept.Silver | Sept. Crude Oil | September Bonds | Sept. Euro |
| Resistance 3 | 1329.9 | 2148.3 | 104.50 | 139 16/32 | 1.3585 |
| Resistance 2 | 1323.4 | 2130.2 | 103.97 | 139 3/32 | 1.3559 |
| Resistance 1 | 1315.3 | 2114.8 | 103.18 | 138 27/32 | 1.3514 |
| Pivot | 1308.8 | 2096.7 | 102.65 | 138 14/32 | 1.3488 |
| Support 1 | 1300.7 | 2081.3 | 101.86 | 138 6/32 | 1.3443 |
| Support 2 | 1294.2 | 2063.2 | 101.33 | 137 25/32 | 1.3417 |
| Support 3 | 1286.1 | 2047.8 | 100.54 | 137 17/32 | 1.3372 |
| Contract | Dec Corn | Sept. Wheat | Nov. Beans | Dec. SoyMeal | Dec. bean Oil |
| Resistance 3 | 379.7 | 526.2 | 1095.17 | 358.40 | 36.71 |
| Resistance 2 | 377.1 | 525.8 | 1087.58 | 354.90 | 36.58 |
| Resistance 1 | 372.7 | 525.2 | 1072.67 | 348.30 | 36.30 |
| Pivot | 370.1 | 524.8 | 1065.08 | 344.80 | 36.17 |
| Support 1 | 365.7 | 524.2 | 1050.2 | 338.2 | 35.9 |
| Support 2 | 363.1 | 523.8 | 1042.58 | 334.70 | 35.76 |
| Support 3 | 358.7 | 523.2 | 1027.67 | 328.10 | 35.48 |
| Date | 3:57pm | Currency | Impact | Detail | Actual | Forecast | Previous | Graph | |
|---|---|---|---|---|---|---|---|---|---|
| WedJul 23 | 10:00am | EUR | Consumer Confidence | -6 | -7 | ||||
| 10:30am | USD | Crude Oil Inventories | -2.1M | -7.5M |
This is not a solicitation of any order to buy or sell, but a current market view provided by Cannon Trading Inc. Any statement of facts here in contained are derived from sources believed to be reliable, but are not guaranteed as to accuracy, nor they purport to be complete. No responsibility is assumed with respect to any such statement or with respect to any expression of opinion herein contained. Readers are urged to exercise their own judgment in trading.


