New Week Begins With Continued Futures Market Volatility | Support and Resistance Levels
Posted By:- Ilan Levy-Mayer Vice President, Cannon Trading Futures Blog
In this post:
1. Market Commentary
2. Support and Resistance Levels
3. December Mini S&P 500 Continuous Futures chart
4. Economic Reports
5. Highlighted Earnings Releases

1. Market Commentary
FRONT MONTH FOR EQUITIES AND BONDS IS DECEMBER
SYMBOL FOR DECEMBER IS Z
We started the new week, right where we left off. With volatile moves in both directions.
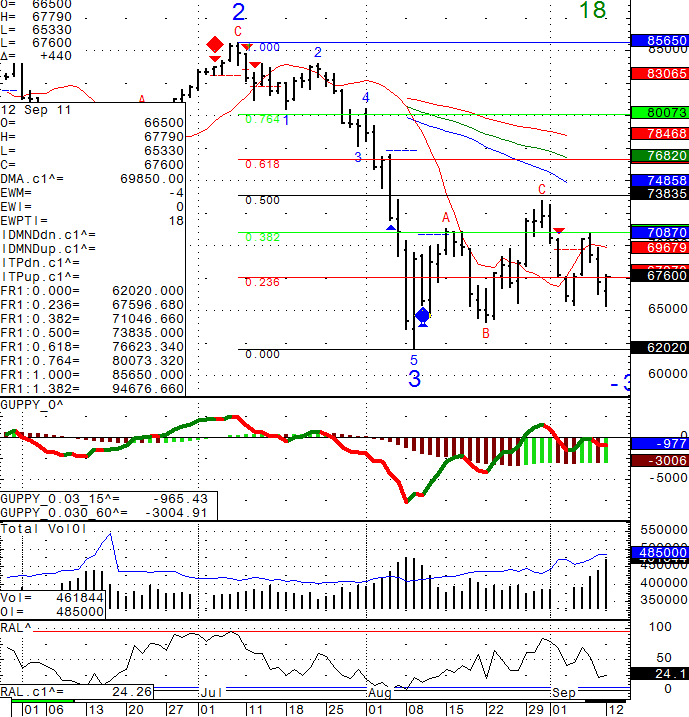
I am sharing my daily Dec. mini Russell 2000 chart with you below.. It seems that at times, the Russell 2000 index has been the leader in the moves of the general stock market. We are currently in a very wide range (volatility definitely expands the “bands”) 739 on top and 654 below.
We are currently closer to the bottom level, hence we may see some more upside before we see sellers step back in. In all honesty, I do NOT have a strong feel for the market right now and do NOT have a preferred way of trading it based on swing or overnight time frame. When I do have a better feel or direction, i will be happy to share with you.
You can also sign up for my real time intraday charts service.
GOOD TRADING!

2. SUPPORT AND RESISTANCE LEVELS!
| Contract (Sept. 2011) | SP500 (big & Mini) | Nasdaq100 (big & Mini) | Dow Jones (big & Mini) | Mini Russell |
| Resistance 3 | 1195.67 | 2296.50 | 11396 | 709.97 |
| Resistance 2 | 1176.58 | 2245.25 | 11197 | 693.93 |
| Resistance 1 | 1167.17 | 2219.50 | 11093 | 685.37 |
| Pivot | 1148.08 | 2168.25 | 10894 | 669.33 |
| Support 1 | 1138.67 | 2142.50 | 10790 | 660.77 |
| Support 2 | 1119.58 | 2091.25 | 10591 | 644.73 |
| Support 3 | 1110.17 | 2065.50 | 10487 | 636.17 |
| Contract | Dec. Gold | Sept. Euro | Oct. Crude Oil | Dec. Bonds |
| Resistance 3 | 1880.8 | 1.3948 | 94.15 | 142 21/32 |
| Resistance 2 | 1865.4 | 1.3821 | 91.55 | 142 7/32 |
| Resistance 1 | 1842.0 | 1.3750 | 90.20 | 141 20/32 |
| Pivot | 1826.6 | 1.3623 | 87.60 | 141 6/32 |
| Support 1 | 1803.2 | 1.3552 | 86.25 | 140 19/32 |
| Support 2 | 1787.8 | 1.3425 | 83.65 | 140 5/32 |
| Support 3 | 1764.4 | 1.3354 | 82.30 | 139 18/32 |

3. Daily December Mini Russell 2000 Futures Chart from September 12th, 2011


4. Economic Reports Tuesday September 13th, 2011
Import Prices m/m
8:30am USD
IBD/TIPP Economic Optimism
10:00am USD
Federal Budget Balance
2:00pm USD
Economics Report Source: http://www.forexfactory.com/calendar.php

5. Today’s Highlighted Earnings Releases
| SYMBOL | COMPANY | EVENT TITLE | EPS ESTIMATE | EPS ACTUAL | PREV. YEAR ACTUAL | DATE/TIME (ET) |
| BRC | Brady Corp | Q4 2011 Brady Corporation Earnings Release | $ 0.60 | n/a | $ 0.49 | 12-Sep |
| NSSC | Napco Security Technologies Inc | Q4 2011 Napco Security Technologies Inc Earnings Release | $ 0.05 | n/a | n/a | 12-Sep BMO |
| OCC | Optical Cable Corp | Q3 2011 Optical Cable Corp Earnings Release | n/a | n/a | n/a | 12-Sep |
| PSDV | pSivida Corp | Q4 2011 pSivida Corp Earnings Release | -$ 0.18 | n/a | n/a | 12-Sep AMC |
| TWT.TO | 20 20 Technologies Inc | Q3 2011 20 20 Technologies Inc Earnings Release | n/a | n/a | n/a | 12-Sep BMO |
| ADU.AX | Adamus Resources Ltd | Preliminary 2011 Adamus Resources Ltd Earnings Release | n/a | n/a | n/a | 12-Sep AMC |


