October Markets May Revisit August Lows | Support and Resistance Levels
Posted By:- Ilan Levy-Mayer Vice President, Cannon Trading Futures Blog
In this post:
1. Market Commentary
2. Support and Resistance Levels
3. Daily Mini S&P 500 Futures Chart
4. Economic Reports

1. Market Commentary
First trading day of October started negative for stock indices and it seems that a retest of 1070 lows from August is on the way.
October however, started very positive for my day-trading model/ ALGO.
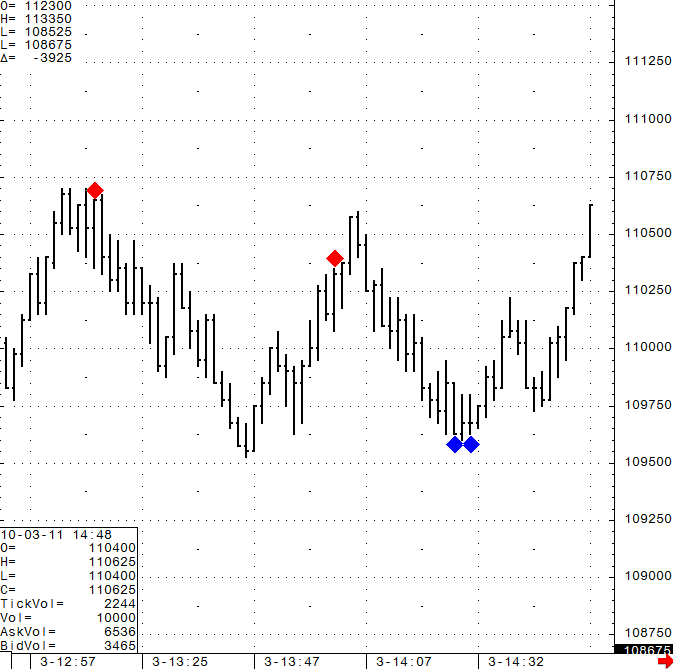
What you see below is a screen shot from the last hour or so of trading on the mini SP. You will notice DIAMONDS markings on the chart. These markings appear BEFORE THE BAR STARTS and are an output of what I have been working for over two years in an attempt to find an indicator that is LEADING by nature and NOT LAGGING….obviously not all days are as powerful as what you see in the chart below but for me this has been the one day-trading tool I have the most confidence in so far.
The DIAMONDS ALGO and a few other studies are available for traders to try using sierra charts, where one can apply the ALGO on different markets and different time frames at anytime on their PC (my recommended method) and/or via my webinar, where one is limited to see the few charts I share during US stock market hours. You can have a trial of either one if you have NOT had one before.
GOOD TRADING!

2. SUPPORT AND RESISTANCE LEVELS!
| Contract (Dec. 2011) | SP500 (big & Mini) | Nasdaq100 (big & Mini) | Dow Jones (big & Mini) | Mini Russell |
| Resistance 3 | 1166.40 | 2207.67 | 11176 | 678.93 |
| Resistance 2 | 1149.70 | 2177.83 | 11041 | 663.07 |
| Resistance 1 | 1118.60 | 2122.42 | 10786 | 633.53 |
| Pivot | 1101.90 | 2092.58 | 10651 | 617.67 |
| Support 1 | 1070.80 | 2037.17 | 10396 | 588.13 |
| Support 2 | 1054.10 | 2007.33 | 10261 | 572.27 |
| Support 3 | 1023.00 | 1951.92 | 10006 | 542.73 |
| Contract | Dec. Gold | Dec. Euro | Nov. Crude Oil | Dec. Bonds |
| Resistance 3 | 1689.5 | 1.3514 | 81.73 | 148 16/32 |
| Resistance 2 | 1678.2 | 1.3446 | 80.68 | 146 29/32 |
| Resistance 1 | 1667.1 | 1.3317 | 78.74 | 146 8/32 |
| Pivot | 1655.8 | 1.3249 | 77.69 | 144 21/32 |
| Support 1 | 1644.7 | 1.3120 | 75.75 | 144 |
| Support 2 | 1633.4 | 1.3052 | 74.70 | 142 13/32 |
| Support 3 | 1622.3 | 1.2923 | 72.76 | 141 24/32 |

3. Minute Mini S&P 500 Futures Chart from October 3, 2011

Would you like to have access to my DIAMOND ALGO as shown above and be able to apply for any market and any time frame?
If so, please send me an email with the following information:
- Are you currently trading futures?
- Charting software you use?
- If you use sierra or ATcharts, please let me know the user name so I can enable you.
- Markets you currently trade.
4. Economic Reports for Tuesday October 3, 2011
FOMC Member Raskin Speaks
9:00am
Fed Chairman Bernanke Testifies
10:00am
Factory Orders m/m
10:00am
Economics Report Source: http://www.forexfactory.com/calendar.php


