Trading Levels & Economic Reports for 10-11-2011
Posted By:- Ilan Levy-Mayer Vice President, Cannon Trading Futures Blog
In this post:
1. Market Commentary
2. Support and Resistance Levels
3. Daily Mini Mini S&P 500 Futures Chart

1. Market Commentary
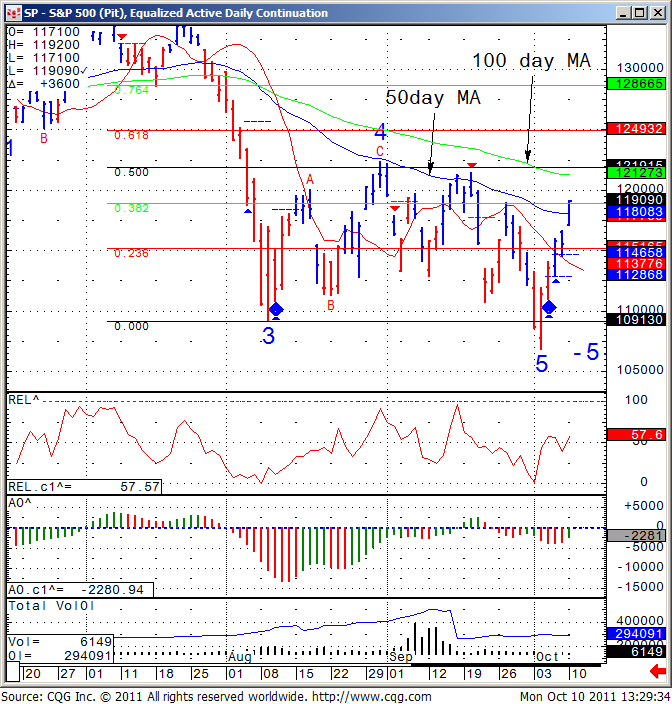
Today’s rally was impressive and completed my target I mentioned over a week ago.
We crossed the 50 day moving average and closed above it as well. The BIG question is ” was the fact that this price action took place during a bank holiday on MUCH lower volume be a fake out?”
I guess the next few days will provide answers, in between daily chart of the SP500 ( big Sp, pit session) for your review below ( I included the 50 day Moving Avg. as well as the 100 day moving avg.):
GOOD TRADING!

2. SUPPORT AND RESISTANCE LEVELS
| Contract (Dec. 2011) | SP500 (big & Mini) | Nasdaq100 (big & Mini) | Dow Jones (big & Mini) | Mini Russell |
| Resistance 3 | 1219.33 | 2375.92 | 1164 | 721.90 |
| Resistance 2 | 1205.67 | 2326.58 | 11569 | 703.40 |
| Resistance 1 | 1198.33 | 2301.67 | 11469 | 693.30 |
| Pivot | 1184.67 | 2252.33 | 11274 | 674.80 |
| Support 1 | 1177.33 | 2227.42 | 11174 | 664.70 |
| Support 2 | 1163.67 | 2178.08 | 10979 | 646.20 |
| Support 3 | 1156.33 | 2153.17 | 10879 | 636.10 |
| Contract | Dec. Gold | Dec. Euro | Nov. Crude Oil | Dec. Bonds |
| Resistance 3 | 1702.5 | 1.4081 | 90.32 | 141 29/32 |
| Resistance 2 | 1689.6 | 1.3886 | 88.21 | 141 2/32 |
| Resistance 1 | 1683.2 | 1.3762 | 86.98 | 140 9/32 |
| Pivot | 1670.3 | 1.3567 | 84.87 | 1139 14/32 |
| Support 1 | 1663.9 | 1.3443 | 83.64 | 138 21/32 |
| Support 2 | 1651.0 | 1.3248 | 81.53 | 137 26/32 |
| Support 3 | 1644.6 | 1.3124 | 80.30 | 137 1/32 |
3. Daily Mini S&P 500 Futures Chart from October 10, 2011


