Trading Levels & Economic Reports for 10-18-2011
Posted By:- Ilan Levy-Mayer Vice President, Cannon Trading Futures Blog
In this post:
1. Market Commentary
2. Support and Resistance Levels
3. Daily Mini Mini S&P 500 Futures Chart

1. Market Commentary
On Friday I wrote the following:
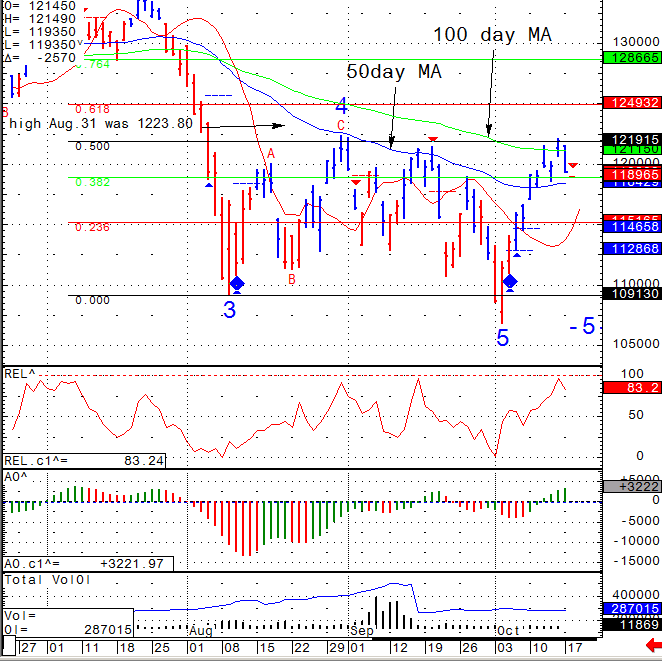
Interesting price action today and we closed right at the 1220 level I have been talking about these last few days.
Market closed right on the high and I think that price action on Monday will be very important to watch.
Follow through and a CLOSE above 1220 can open the door for a more significant rally, on the other hand if the market fails against this level and start picking up momentum on the downside, I will get a sell signal.
Well after seeing today’s price action, I think we may have more room to the downside. If we can take out 1188, we may see 1154.
REGARDLESS of your market view, trading direction etc., more important is how one manages the trade, calculate the risk and control one own emotions in a way that enables you to execute your game plan, which at times will produce winners and at times will produce losers.
GOOD TRADING!

2. Support and Resistance Levels
| Contract (Dec. 2011) | SP500 (big & Mini) | Nasdaq100 (big & Mini) | Dow Jones (big & Mini) | Mini Russell |
| Resistance 3 | 1230.17 | 2444.33 | 11904 | 739.93 |
| Resistance 2 | 1222.53 | 2416.42 | 11781 | 728.37 |
| Resistance 1 | 1208.77 | 2372.83 | 11541 | 707.53 |
| Pivot | 1201.13 | 2344.92 | 11418 | 695.97 |
| Support 1 | 1187.37 | 2301.33 | 11178 | 675.13 |
| Support 2 | 1179.73 | 2273.42 | 11055 | 663.57 |
| Support 3 | 1165.97 | 2229.83 | 10815 | 642.73 |
| Contract | Dec. Gold | Dec. Euro | Nov. Crude Oil | Dec. Bonds |
| Resistance 3 | 1708.3 | 1.4033 | 90.07 | 142 2/32 |
| Resistance 2 | 1698.7 | 1.3969 | 89.12 | 140 30/32 |
| Resistance 1 | 1686.2 | 1.3851 | 87.77 | 140 10/32 |
| Pivot | 1676.6 | 1.3787 | 86.82 | 139 6/32 |
| Support 1 | 1664.1 | 1.3669 | 85.47 | 138 18/32 |
| Support 2 | 1654.5 | 1.3605 | 84.52 | 137 14/32 |
| Support 3 | 1642.0 | 1.3487 | 83.17 | 136 26/32 |

3. Daily Mini Mini S&P 500 Futures Chart
Daily SP500 chart for your review below:


