Trading Levels & Economic Reports for 10-19-2011
Posted By:- Ilan Levy-Mayer Vice President, Cannon Trading Futures Blog
In this post: 1. Market Commentary 2. Support and Resistance Levels 3. Daily Mini Mini S&P 500 Futures Chart 
1. Market Commentary
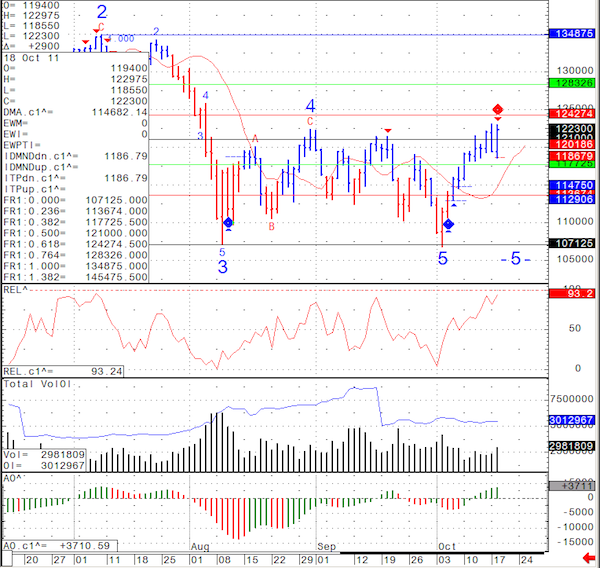
Tremendous volatility across the markets today with some news out of Europe moving most markets much higher. As far as the daily chart, I am now confused again….I got tempted on the short side and got burnt very quickly today….Once again there is a CASE for both sides, bulls and the bears and the potential for a BIG MOVE EITHER WAY is greater than normal as we are sitting on important price levels in the SP500, which has been the leader for the rest of the markets as of the last few weeks. Fast and furious moves like we have seen today encourage me to revisit the point of using AUTO stops when day trading. Many traders will disagree with me but I have seen the markets make such fast moves that by the time one decides where and when to place a stop…the market already made a very powerful move against you. I think that as a day trader who is looking to only make a few ticks on the trade, you should decide on the appropriate worst case scenario stop ( measured in ticks or $$) and use your trading software to place these stops and/ or targets as soon as you enter your position. Most of our trading platforms have that feature and your broker will be more than happy to review it with you. GOOD TRADING! 
2. Support and Resistance Levels
| Contract (Dec. 2011) | SP500 (big & Mini) | Nasdaq100 (big & Mini) | Dow Jones (big & Mini) | Mini Russell |
| Resistance 3 | 1282.90 | 2455.83 | 12028 | 754.53 |
| Resistance 2 | 1256.45 | 2413.67 | 11809 | 732.97 |
| Resistance 1 | 1239.10 | 2389.08 | 11657 | 719.93 |
| Pivot | 1212.65 | 2346.92 | 11438 | 698.37 |
| Support 1 | 1195.30 | 2322.33 | 11286 | 685.33 |
| Support 2 | 1168.85 | 2280.17 | 11067 | 663.77 |
| Support 3 | 1151.50 | 2255.58 | 10915 | 650.73 |
| Contract | Dec. Gold | Dec. Euro | Nov. Crude Oil | Dec. Bonds |
| Resistance 3 | 1703.0 | 1.4001 | 93.17 | 141 6/32 |
| Resistance 2 | 1680.9 | 1.3906 | 91.10 | 140 28/32 |
| Resistance 1 | 1672.4 | 1.3835 | 89.69 | 140 3/32 |
| Pivot | 1650.3 | 1.3740 | 87.62 | 139 25/32 |
| Support 1 | 1641.8 | 1.3669 | 86.21 | 139 |
| Support 2 | 1619.7 | 1.3574 | 84.14 | 138 22/32 |
| Support 3 | 1611.2 | 1.3503 | 82.73 | 137 29/32 |

3. Daily Mini Mini S&P 500 Futures Chart
As far as the mini SP daily chart below, we are in a WIDE range. 1185.50 ( today’s lows) and 1231 Sunday night high), maybe even bit wider if we look at the FIB levels, 1177 to 1242. I think that once the market breaks one way or another with follow through volume, we can see a significant move in that direction. 


